Incorporation of offshore shell companies as an indicator of corruption risk in the extractive industries - WIDER Working Paper 2022/14
←
→
Page content transcription
If your browser does not render page correctly, please read the page content below
WIDER Working Paper 2022/14

Incorporation of offshore shell companies as an
indicator of corruption risk in the extractive
industries

Giovanna Marcolongo1 and Diego Zambiasi2

February 2022

Abstract: We show that the incorporation of offshore entities increases when oil and gas
exploration licences are awarded. We exploit leaked data on the incorporation of shell companies
and detailed information on tax havens and the awarding rounds of oil licences to construct a new
data set covering 119 countries over the period 1990–2014. We consider the incorporation of
offshore entities as an indicator of corruption risk. We find that the number of new shell
companies increases by 11.1 per cent in the period around the award of an exploration licence. We
interpret this evidence as a strong indicator that the award of an exploration licence increases the
risk of corruption. Consistent with rent-maximising behaviour, this association is stronger when
the price of oil increases. Our work informs the fight against corruption, proposing greater
monitoring of the ultimate beneficiaries of opaque companies that participate in awarding
procedures.
Key words: oil, extractives, natural resources, corruption, tax havens, shell companies
JEL classification: D72, D73, O13, Q32
Acknowledgements: This study has been prepared within the UNU-WIDER project ‘Extractives
for Development (E4D)—Risks and Opportunities’, which is part of the Domestic Revenue
Mobilization programme. The programme is financed by specific contributions from the
Norwegian Agency for Development Cooperation. The authors thank UNU-WIDER for its
support. This project greatly benefited from the feedback and comments of Professor Tony
Addison on an earlier draft. Silvia Pedersoli, Francesco Raffaelli, and Simone Valle provided
excellent research assistance.

1   Bocconi University, Milan, Italy, corresponding author: giovanna.m@unibocconi.it 2 Newcastle University, UK
This study has been prepared within the UNU-WIDER project ‘Extractives for Development (E4D)—Risks and Opportunities’.
Copyright © UNU-WIDER 2022
This study has been prepared within the UNU-WIDER project Extractives for development (E4D)—risks and opportunities,
which is part of the Domestic Revenue Mobilization programme. The programme is financed through specific contributions by
the Norwegian Agency for Development Cooperation (Norad).
Information and requests: publications@wider.unu.edu
ISSN 1798-7237 ISBN 978-92-9267-145-7
https://doi.org/10.35188/UNU-WIDER/2022/145-7
Typescript prepared by Merl Storr.
United Nations University World Institute for Development Economics Research provides economic analysis and policy advice
with the aim of promoting sustainable and equitable development. The Institute began operations in 1985 in Helsinki, Finland, as
the first research and training centre of the United Nations University. Today it is a unique blend of think tank, research institute,
and UN agency—providing a range of services from policy advice to governments as well as freely available original research.
The Institute is funded through income from an endowment fund with additional contributions to its work programme from
Finland, Sweden, and the United Kingdom as well as earmarked contributions for specific projects from a variety of donors.
Katajanokanlaituri 6 B, 00160 Helsinki, Finland
The views expressed in this paper are those of the author(s), and do not necessarily reflect the views of the Institute or the United
Nations University, nor the programme/project donors.
1     Introduction

        Headlines from around the world make it clear: trillions of dollars in illicit money
        are circling the globe, enriching powerful individuals and keeping crooked leaders
        in power, all at the expense of everyday citizens. But headlines don’t provide much
        insight into how corruption actually works. (Gillies 2019: ch. 3)

Corruption in the extractive industries (oil, gas, and mining) is a widespread phenomenon.
Estimates of global foreign bribery suggest that 20 per cent of transnational bribes are related to
extractive industries (OECD 2014). Large windfalls and widespread involvement of the state in
the sector facilitate bad practice. Corruption in extractive industries has often been linked to the
low and unequal growth of resource-rich countries (Addison and Roe 2018; Humphreys et al.
2007) in what the literature has called the ‘resource curse’.

The awarding of licences for the exploration of oil blocks is a crucial moment for corruption to
occur. Exploration licences are usually awarded by ministries, public authorities, or local
governments, and they give the licence holder the exclusive right to explore for oil and gas within
the specified block. Corruption may take place when exploration licences are awarded, given that
very valuable contracts are at stake and the government enjoys a high degree of discretion in the
choice of the awardee. Press reports are rich in anecdotal evidence of malpractice during awards.
In 2012, a Romanian businessman named Frank Timis allegedly exploited his relationships with
Senegalese politicians to gain control of two offshore oil blocks in Senegal. At the time of the
award, Timis’s winning company did not even physically exist: it was incorporated in the Cayman
Islands later. The company lacked the capital and infrastructure to carry out the exploration.
However, it was able to sell the licence to another British Virgin Islands company, and ultimately
to resell it to two well-established and better-equipped oil corporations (Sharife and Dieng 2019).
Timis allegedly exploited multiple shell companies to carry out the transfer of property: he enriched
himself while—crucially—hiding his identity.

Policy reports and news articles highlight how relevant offshore centres are in fostering corruption.
In a report published in 2017, the Natural Resource Governance Institute collected case studies
of bribery and corruption in the award of licences and contracts (Sayne et al. 2017). The document
proposed 12 red flags that should trigger suspicion of corruption during the awarding process.
Among the indicators, the authors listed: i) ‘a competing or winning company shows signs of
having a politically exposed person [PEP] as a hidden beneficial owner’; ii) ‘a company provides
payments, gifts or favors to a PEP with influence over the selection process’; iii) ‘the government
allows a seemingly unqualified company to compete for, or win an award’ (Sayne et al. 2017: 2).

To provide systematic evidence of how offshore entities enable corruption in the awarding of oil
licences is nonetheless a difficult challenge, since one reason individuals choose to set up
companies in tax havens is to hide their identities. However, recent developments in investigative
journalism have allowed us a peek at the identities of the beneficiaries of thousands of shell
companies registered in tax havens. The Panama Papers in 2016 and the Paradise Papers in 2018
revealed the names of the beneficiaries of shell companies incorporated by two major law firms in
the Caribbean: Mossack Fonseca and Appleby.

We exploit this leaked information to provide systematic evidence of the association between the
timing of the awarding of exploration licences and that of the incorporation of entities in tax
havens. We construct a novel data set where we link detailed information about the incorporation
of offshore entities with geo-localized information about awards of exploration and production

                                                 1
licences. We check whether countries incorporate more entities in tax havens during the six
months around the award of exploration licences. We find that the number of entities incorporated
increases by 11.1 per cent in the period around the award of an exploration licence. In contrast,
we do not detect any statistically significant effect around the awarding of production licences.
Corruption is more likely to take place during oil booms (Andersen et al. 2017; Gillies 2019). When
oil prices surge, oil companies make higher profits, and they are more willing to invest and to raise
their bids in licensing rounds. Government officials and/or government ministers take advantage
of the companies’ increased willingness to pay to extract higher bribes. We test how the
relationship between the awarding of exploration licences and the incorporation of offshore
entities varies in response to fluctuations in the world price of oil. We find that when oil prices
surge, the association between the timing of awards and the incorporation of offshore entities is
even stronger. Finally, we show that the relationship between the awarding of exploration licences
and the creation of shell companies is more likely to hold in countries where oil revenues play a
central role in the whole economy.
This paper contributes to the strand of literature about natural resources and corruption (Andersen
et al. 2017; Gillies 2019; Moisé 2020). We use a novel data set to provide statistical evidence of the
role of offshore entities as indicators of potential corruption in the oil sector. This work is linked
to Andersen et al. (2017), who use data from the Bank for International Settlements on bilateral
bank deposits to show that natural resource-reliant countries with weak institutions are more likely
to respond to a surge in petroleum prices with an increase in capital deposits in tax havens. Our
paper builds on Andersen et al. (2017) and uses a direct measure of potential rent-seeking
behaviour during the award of exploration licences: leaked data from the Panama and Paradise
Papers. The awarding of licences, besides oil trade (Hsieh and Moretti 2006; Östensson 2020) and
the payment of royalties (Baragwanath 2020; Caselli and Michaels 2013), may create opportunities
for corruption. We provide systematic evidence of the relationship between the awarding of
exploration licences and the incorporation of entities in tax havens. Our work aims to inform
policy initiatives that develop indicators to enhance transparency and accountability in the
extractive industries (Gillies 2020; Sayne et al. 2017). Lastly, we contribute to the literature on the
natural resource curse (Addison and Roe 2018; Cust and Mihalyi 2017; Lahn and Stevens 2018;
Ross 2001) by shedding light on how tax havens facilitate malpractice and potentially corruption
in extractive industries, specifically the oil and gas sector.
2 Data and descriptive evidence
2.1 Data set
We construct a novel data set with detailed information about the incorporation of offshore shell
companies and the award of licences for the exploration and production of oil and natural gas. We
combine data from two main sources to i) proxy for corruption and ii) identify the timing of awards
of exploration licences. We rely on leaked data from the Offshore Leaks Database to measure
offshore entity incorporation as a proxy for corruption. We use information from Enverus, a
business intelligence provider specialized in oil and gas, to recover information about exploration
licences. We enrich the database with information from the World Bank, the Polity Index, and the
Europe Brent Spot Price from the Energy Information Administration. These three data sources
are used to measure a country’s dependency on the extraction of oil and gas (oil rents as a share
of gross domestic product (GDP)), which countries are autocracies (Polity Index), and oil booms
(surges in the oil price).
2Offshore Leaks Database
Ideally, we would like to observe any bribes channelled towards awarding authorities around the
time of the award of exploration licences. Despite such information being unavailable, investigative
accounts (Gillies 2020; Sayne et al. 2017) suggest that shell companies are the vehicle most often
used to transfer these kinds of funds. Offshore entities serve the purpose well, as they transfer
funds with simplicity while granting secrecy to the payer and the payees. We draw the data from
three massive leaks that occurred between 2010 and 2016 and that showed how the use of offshore
finance is a global phenomenon.
In 2016, the International Consortium of Investigative Journalists (ICIJ) attracted global media
attention by revealing a leak of data from Mossack Fonseca, a law firm based in Panama whose
core business was offshore entity incorporation. A secret source (self-identified as John Doe) had
passed two Süddeutsche Zeitung journalists 2.6 terabytes of data, including documents, emails, and
details on entity incorporation from Mossack Fonseca. According to The Economist (Economist
2016), the firm covered between five and ten per cent of the global shell company market and, as
reported by the ICIJ, had relationships with customers all over the world through its more than
40 worldwide offices. In the spring of 2016, the ICIJ released the Offshore Leaks Database, listing
the dates, names, and beneficiaries of more than 200,000 entities incorporated by Mossack
Fonseca. The efforts of the ICIJ to uncover the scope of tax havens and offshore finance had
already started before the Panama Papers investigation, and continued even after it. In 2013, the
ICIJ published the first list of more than 100,000 offshore entities incorporated by Portcullis
TrustNet and Commonwealth Trust Ltd, two law firms respectively based in Singapore and the
British Virgin Islands. In 2017, the ICIJ extended the Offshore Leaks Database with further data
from a new leak that contained information about Appleby, a law firm headquartered in Bermuda
and part of the ‘magic circle’ of offshore law firms. Similarly to Mossack Fonseca, Appleby’s 700
employees, located across more than 19 tax havens, allowed the company to target a widely
international market. The three leaks from Portcullis, Mossack Fonseca, and Appleby together
make up the Offshore Leaks Database.
For each entity listed in the Offshore Leaks Database, we observe the name of the single or
multiple beneficiaries (legal or natural persons) and the date on which the entity was incorporated.
Crucially for our analysis, for a subset of the entities we observe the country of their beneficiaries,
and we can therefore attribute a nationality to the company. In most cases, the country where the
entity is incorporated differs from that of the beneficiary. About ten per cent of the 740,000 entities
included in the three leaks report a ‘bearer’ as a beneficiary, 1 therefore limiting our ability to assign
a country to the beneficiary. When the beneficiary’s country is not reported, we use information
from a different variable: the address linked to the office. For 121,000 observations, however, the
variable is not evaluated. Following Alstadsæter et al. (2019), we exclude beneficiaries linked to
more than ten addresses, as these are likely to work as intermediaries too, and thus their nationality
may not reflect that of the ultimate beneficiary. Following this criterion, we disregard about 70,900
observations. We also disregard officers linked to more than ten entities (the median number of
entities per officer is two, while the 75th percentile is 130 and the 90th percentile is 245), as they are
also likely to work as go-betweens rather than being the actual beneficiaries.
We exclude from the analysis beneficiaries that report a tax haven as their location, as they are
more likely to be nominees, and their nationality is not informative of the country of the actual
beneficiary. Suppose for example that a corrupt politician from Angola incorporates an entity in
Bermuda and nominates an officer from Bermuda as a nominee. It would be incorrect to attribute
1A bearer share is a piece of paper that entitles the person who shows it to dispose of the company reported on it.
3the entity to Bermuda, as the person who disposes of the wealth of the company is actually located
in Angola. In cases where the beneficiary of an entity is linked to more than one country, we
impute the entity to each country separately.
We construct two main outcome variables that are relevant to our analysis: the number of entities
incorporated in a given month in a given country, and a dummy that equals one every month a
new entity is incorporated.
Awarding of exploration licences
We obtain detailed information about the awards of exploration and production licences for oil
and gas from Enverus, a business intelligence provider that collects information on oil and gas
awarding procedures through scouting agents located around the world. Enverus sells these
services to oil companies interested in receiving the most up-to-date information about upcoming
licensing rounds: it provides them with details on the size, location, and type (onshore/offshore)
of the block, as well as the awarding date. Crucially for our analysis, Enverus stores and sells
historical information on bidding rounds, including details on the country of the block and the
award date. Figure 1 shows the average number of licences awarded in a single month across the
world. There are wide differences across countries. Large producers of oil (Australia, Brazil,
Canada, and the United States) are more active in setting up licensing rounds. When focusing on
the developing world, we observe large differences across continents: Latin American countries
are more frequently active in licensing rounds than African countries.
In our analysis we focus on licences awarded between 1990 and 2014, as this is the period covered
by the Offshore Leaks Database. Enverus reports details on 6,334 awards across 131 countries
during this time interval. The incorporation of an offshore entity may occur in the period
immediately preceding or following the awarding of an oil licence. For example, a company may
be set up just before the incorporation to participate in the bidding round. Alternatively, and
similarly to the case reported in section 1 of this paper, the timing of the award may precede that
of the company’s incorporation: the company exists only on paper until the bidding round. The
actual incorporation takes place in the immediate aftermath of the round, once the award is certain.
To take this feature into account, we focus our analysis on the six months around the award of a
licence.
Figure 1: Distribution of monthly licence awards across the world
Source: authors’ illustration based on data from Enverus database. Map created through the command spmap of
the Stata software, with a shapefile from Natural Earth.
42.2 Descriptive evidence and statistics
We start the analysis by providing some descriptive evidence of the relationship between the award
of oil licences and the incorporation of offshore entities. In Figure 2 we plot the yearly series for
the total number of awards, the total number of incorporations of new entities, and the world oil
price. The three measures show an increasing trend over time. The series for the oil price and the
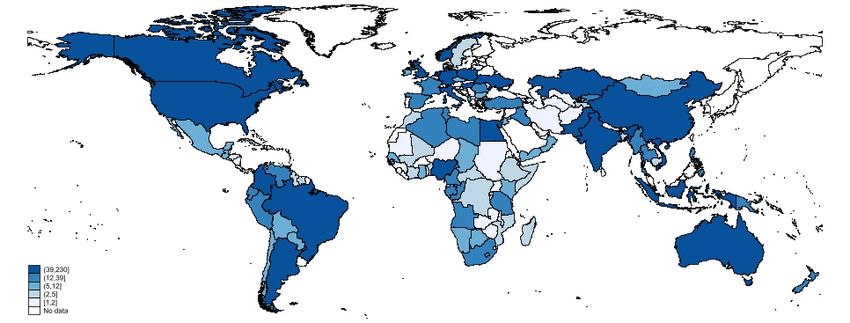
number of offshore entities map each other very closely. In Figure 3 we reproduce the same series,
distinguishing between the awards of exploration licences (top panel) and production licences
(bottom panel). A comparison of the two panels shows that the evolution of the total number of
exploration licences closely follows the dynamics of the incorporation of new offshore entities. A
similar relationship does not appear in the evolution of awards of production licences. These
stylized facts guide the choice of specification in the empirical section of this paper. We test
whether these global trends are confirmed when we exploit within-country differences in the
timing of awards. We do this by exploiting monthly data on the number of awards and the number
of newly incorporated shell companies at the monthly level.
Figure 2: Licences, oil price, and offshore entity incorporations
Note: this figure shows the general global trends of our main variables. Green triangles represent the number of
offshore entities that open every year and that we can observe in our data (left axis). Red dots represent the
number of awards for both exploration and production licences (left axis). Blue squares represent the average
price of oil in a given year (right axis).
Source: authors’ illustration.
5Figure 3: Licences, oil price, and entity incorporations by type of licence
A: Awards of exploration licences, oil price, and offshore entity incorporations
B: Awards of production licences, oil price, and offshore entity incorporations
Note: this figure shows global trends in our main variables of interest. Panel A shows global trends when we only
consider exploration awards. Panel B shows global trends when we only consider production awards. Green
triangles represent the number of offshore entities that open every year and that we can observe in our data (left
axis). Red dots represent the number of awards of exploration licences (panel A) and production licences (panel
B). Blue squares represent the average price of oil in a given year (right axis).
Source: authors’ illustration.
6Table 1 reports the descriptive statistics for our sample. The data shows great variation in the
number of offshore entities incorporated. To limit the risk that outliers will drive our results, and
to take into consideration the large number of observations where no new entities are
incorporated, we use the inverse hyperbolic sine (IHS) transformation of the number of monthly
incorporations as the dependent variable. We measure the extent to which a country’s economy
depends on petroleum by using the World Bank measure of oil rents as a share of GDP. The data
shows a vast degree of heterogeneity in this respect: Iraq and Libya rank the highest. Finally,
countries differ widely with respect to the size of their economy (real GDP) and population. It is
important to note, however, that our analysis will check for a relationship between awards and
entity incorporations by exploiting data at the monthly frequency. As long as the sizes of the
economy and of the population change at a lower frequency compared with the award of oil
licences, they are unlikely to affect our results.
Table 1: Descriptive statistics
Mean Min. Median Max. SD
No. of monthly incorporations 5.8 0.0 0.0 1088.0 24.92
At least one new incorporation 0.4 0.0 0.0 1.0 0.49
Month in an awarding interval 0.3 0.0 0.0 1.0 0.44
Month in an awarding interval: exploration 0.2 0.0 0.0 1.0 0.38
Month in an awarding interval: production 0.2 0.0 0.0 1.0 0.40
Oil rents as share of GDP 4.9 0.0 0.2 66.7 10.51
Dummy for oil rents above median 0.5 0.0 0.0 1.0 0.50
Real GDP 3447.8 0.0 2599.1 9997.8 2655.77
Population (millions) 48.3 0.4 11.8 1364.3 156.13
Observations 35268
Source: authors’ calculations.
3 Estimation strategy
We estimate the association between the timing of the award of licences and the incorporation of
offshore shell companies through a battery of two-way fixed effects models. We first estimate the
following model by ordinary least squares:
ihs(Number of Entities)it =αi + µt + βAround Award (1)
αi represents country fixed effects, allowing us to capture any systematic time-invariant
characteristics of any given country i, such as institutional features. µt represents month fixed
effects, allowing us to control for any contemporaneous shocks across countries, such as variations
in oil prices, as well as any non-linear dynamic in the expansion of Mossack Fonseca that is
common across countries. Around Awardit is a dummy that takes the value of one in the six
months around every award date in any given country i (e.g., if a licence is awarded in April, the
dummy takes the value of one from January to June). The variable ihs(Number of Entities)it is
the IHS transformation of the number of entities opened in month t whose beneficiary is from
country represents an error term correlated at the country level. The coefficient of interest β
can be interpreted as the percentage change in the number of entities opened around the award of
licences. We estimate the same model using a dummy variable that takes the value of one if at least
one new offshore entity with a beneficiary from country i is incorporated. This approach allows
7us to tease out the difference in the impact of awarding licences on the incorporation of offshore
entities on the intensive and extensive margins.
We estimate the model described in equation [1] for all licensing awards for oil and gas, and then
we estimate it separately for awards of exploration licences and of production licences. This
approach allows us to understand at what stage potential corruption is likelier to occur.
3.1 Role of an oil boom
An increase in the oil price spurs profit opportunities in the oil sector, and potentially opportunities
for corruption and rent embezzlement. When the price of oil surges, oil companies are more likely
to expand their investment opportunities, while the governments of oil-producing countries
increase their bargaining power. Licences awarded during the period of an oil boom may be
perceived as more valuable, thus leading to more corruption (Andersen et al. 2017; Gillies 2019).
To test for this channel in our setting, we enrich the specification with an interaction between the
awarding of licences and the monthly log change in the oil price:
ihs(Number of Entities)it =αi + µt + βAround Awardit + γAround Awardit × Oil
Price Change (2)
The variable Oil Price Changet represents the monthly percentage change in the oil price. The
coefficient of interest γ can be interpreted as the average percentage increase in the number of
entities incorporated by country i when the price of oil changes by one per cent between two
consecutive months.
3.2 Relevance of the oil sector and institutional setting
The scope for corruption may depend on a country’s reliance on the oil sector (Andersen et al.
2017). Similarly, the scope for sheltering funds offshore may differ depending on the institutional
setting of a country. Tax havens provide secrecy and anonymity. These features make them an
appealing destination for politicians whose countries implement strict transparency and
accountability policies. Tax havens are a ‘safe’ place to hide funds. On the other hand, countries
with autocratic regimes may be more corrupt per se, and may therefore be more used to exploit
opaque structures and to shelter funds abroad. In the end, the direction of the influence of the
institutional setting on the embezzlement of funds remains an empirical question. To test these
aspects, we enrich the main specification [1] with interactions with two dummies. One dummy
captures whether oil rents as a share of GDP are above the median; the other captures whether
the country is an autocracy or not. To limit the risk of endogeneity in the institutional setting of a
country, we measure the regime at the beginning of the sample, in 1990.
Finally, to test for complementarities across the awarding of exploration licences, the dependency
on the oil sector, and the institutional setting, we run a triple difference-in-differences specification:
ihs(Number of Entities)it =αi + µt + βAround Awardit + γAround Awardit × High
Oil Renti + δAround Awardit × Autocracyi+ ηAround Awardit × High Oil Renti ×
Autocracy (3)
84 Results
4.1 Linear probability model
Table 2 reports estimates of our coefficient of interest β, estimated according to equation [1]. In
the first three columns, the dependent variable is the IHS of the number of new entities
incorporated (intensive margin). In columns (4) to (6), the dependent variable is a dummy for any
new entity incorporated in a month (extensive margin). We do not detect any statistically significant
change in the incorporation of offshore entities around the timing of the award of licences
(columns (1) and (4)). However, results change when we distinguish by type of award. The number
of new entities increases by 11.1 per cent in the six months around the award of an exploration
licence. Similarly, the probability of observing a new entity increases by 1.9 percentage points. We
do not observe a similar increase or an effect that is statistically different from zero around the
award of a production licence (columns (3) and (6)).
Table 2: Opening of offshore shell companies and licence awards
Number of new entities (in IHS) New entity dummy
Model (1) (2) (3) (4) (5) (6)
Variables
Around any award 0.0517 0.0099
(0.0390) (0.0096)
Around exploration award 0.1112∗∗∗ 0.0192∗∗
(0.0354) (0.0096)
Around production award 0.0406 0.0102
(0.0508) (0.0125)
Fixed effects
Country Yes Yes Yes Yes Yes Yes
Month Yes Yes Yes Yes Yes Yes
Observations 35268 35268 35268 35268 35268 35268
Note: this table reports estimates of the coefficient β from equation [1]. The first three columns report estimates
for model specifications where the number of new entities incorporated (after we apply the IHS transformation) is
our main outcome variable. Columns (4) to (6) report estimates for specifications where our outcome variable is a
dummy variable that takes the value of one if at least one new entity has been incorporated. Standard errors are
clustered at the country level. Significance codes: *** 0.01, ** 0.05, * 0.1.
Source: authors’ calculations.
4.2 Role of an oil boom
Table 3 shows the results of the estimates of specification [2], in which we test for potential
complementarities between the awarding of exploration licences and oil booms. The results
confirm that oil booms increase the scope for corruption. Panel B shows that the incorporation
of offshore entities increases around the awarding of exploration licences. The coefficients on both
the intensive (11.0 percent) and extensive margin (1.9 percentage points) are almost unchanged
with respect to Table 2. They confirm that the period of the award of an exploration licence is
associated with an increase in activities in tax havens even when there is no increase in the price
of oil. The positive coefficient on the interaction term between the awarding of an exploration
licence and the change in the oil price shows that the effect is exacerbated during an oil boom. We
do not detect an effect statistically different from zero for the interaction term on the extensive
margin (column (2)). This evidence supports the claim that the awarding of exploration licences
triggers activity in offshore entities.
9Table 3: Licence awards and price of oil
Number of new New entity
entities (in IHS) dummy
Model (1) (2)
A: any award
Around any award 0.0513 0.0097
(0.0390) (0.0096)
Around any award × oil price change 0.0933 0.0477
(0.1222) (0.0466)
B: exploration licences
Around exploration award 0.1102∗∗∗ 0.0191∗
(0.0353) (0.0096)
Around exploration award × oil price change 0.2748∗∗ 0.0358
(0.1309) (0.0499)
C: production licences
Around production award 0.0404 0.0100
(0.0508) (0.0125)
Around production award × oil price change 0.0420 0.0457
(0.1480) (0.0498)
Fixed effects
Country Yes Yes
Month Yes Yes
Observations 35268 35268
Note: this table reports estimates of the coefficients β and γ from equation [2]. Panel A shows the results
obtained when any type of award (exploration or production) is considered. Panel B shows estimates that are
obtained when only awards for exploration licences are included. Panel C shows estimates that are obtained
when only awards for production are included. Column (1) shows estimates obtained when the dependent
variable is the IHS transformation of the number of entities incorporated by a given country in a given year.
Column (2) shows estimates obtained when the dependent variable is a dummy variable that takes the value of
one if at least one incorporation happened in a given month and in a given country. Standard errors are clustered
at the country level. Significance codes: *** 0.01, ** 0.05, * 0.1.
Source: authors’ calculations.
4.3 Relevance of the oil sector and institutional setting
In Table 4 we investigate whether the effect of the awarding of exploration licences is concentrated
in countries whose economy relies more on the oil sector (columns (1) and (4)), and how the
institutional setting of a country affects this relationship (columns (2) and (5)). The dummy ‘high
oil rent’ identifies countries whose oil rents as a share of GDP are above the median. High oil rent
countries are more likely to display the presence of at least one new entity around the awarding of
an exploration licence (column (4)). The coefficient is positive but not statistically significant when
we look at the intensive margin (column (1)).
When comparing the effect across countries with different institutional regimes, we do find a
negative and statistically significant effect on the interaction with the institutional regime. One
potential explanation is that tax havens are typically characterized by a high level of secrecy. This
makes them an appealing destination in which to hide the proceeds of dirty deals made in countries
with high accountability and transparency. Corrupt politicians face higher risks of being caught,
and potentially higher chances of losing power, in democracies than they do in autocracies.
Finally, in columns (3) and (6) we test for the joint complementarity of the dependency on the oil
sector and the institutional setting. The coefficient on the timing of the exploration continues to
10be positive and significant around the award of an exploration licence. This suggests that the
awarding is crucial in itself, independently of a country’s institutional setting. Countries with a high
dependence on the oil sector react to the awarding of exploration licences with a further increase
in offshore entities (second and fourth rows). When we focus on the complementarity between oil
wealth and the institutional setting, the effect is driven by autocracies on the intensive margin
(column (3), fourth row). However, there is no distinguishable difference between autocracies and
non-autocracies on the extensive margin (column (6), fourth row).
Table 4: Awarding of licences and offshore entity incorporations: analysis by relevance of the oil sector and
institutional regime
Number of new entities (in IHS) New entity dummy
Model (1) (2) (3) (4) (5) (6)
Variables
Around exploration award 0.0924∗ 0.1712∗∗∗ 0.2073∗∗∗ -0.0062 0.0345∗∗∗ 0.0089
(0.0548) (0.0442) (0.0652) (0.0132) (0.0127) (0.0161)
Around exploration award × high oil rent 0.0290 -0.0589 0.0392∗ 0.0410
(0.0891) (0.0997) (0.0221) (0.0273)
Around exploration award × autocracy -0.2119∗∗ -0.4927∗∗∗ -0.0540∗∗ -0.0651∗∗
(0.1057) (0.0819) (0.0224) (0.0304)
Around exploration award × high oil rent 0.4031∗∗ 0.0106
× autocracy
(0.1628) (0.0420)
Fixed effects
Country Yes Yes Yes Yes Yes Yes
Month Yes Yes Yes Yes Yes Yes
Fit statistics
Observations 35268 35268 35268 35268 35268 35268
Note: this table reports estimates of several specifications of equation [3]. The first three columns show
specifications where the outcome variable is the IHS transformation of the number of entities incorporated by a
given country in a given year. Columns (4) to (6) show specifications where the outcome variable is a dummy
variable that takes the value of one if at least one incorporation happened in a given month and in a given
country. Columns (1) and (4) report results from a specification where we include an interaction between our
around exploration award dummy and a dummy that takes the value of one if a country’s economy is highly
reliant on oil. Columns (2) and (5) report results from a specification where we include an interaction between our
around exploration award dummy and a dummy that takes the value of one if a country was an autocracy in
1990. Columns (3) and (6) show results from a specification where we interact our around exploration award
dummy with both dummies used in the previous columns. Standard errors are clustered at the country level.
Significance codes: *** 0.01, ** 0.05, * 0.1
Source: authors’ calculations.
5 Conclusions
How can we detect corruption in the oil sector? This question requires an urgent answer. Detecting
the massive funds that are lost to bribes and rent embezzlement (Gillies 2019) is a vital step in
stopping corruption, but it is also a prerequisite to redirect the management of extractive resources
towards sustainable development (Addison and Roe 2018). Providing an answer is challenging, as
corruption is by definition hard to detect. Researchers and policy-makers have been trying to pin
down indicators that signal the need for extra monitoring in specific stages of the management of
natural resources (Sayne et al. 2017).
In this paper we provide systematic evidence of a relationship between the awarding of exploration
licences and the incorporation of entities in tax havens. Our study sheds light on the role that shell
11companies play in limiting transparency and accountability in the awarding of licences. These
features may prepare the ground for corruption to take root (Sharife and Dieng 2019). Politically
exposed persons may exploit secrecy to hide their identities behind shell companies, award the
exploration rights to themselves, and then make profits by selling those same rights to oil
corporations.
From a policy perspective, the results of this paper call for further attention and more transparency
during the delicate times of awarding procedures. It is fundamental that the authorities in charge
of monitoring the awarding of oil licences should be independent and not subject to any political
interference. Potentially, policy institutions such as the Extractive Industries Transparency
Initiative or international authorities such as the World Bank could take the lead and ensure
transparency is satisfactory over the different stages of the awarding procedure. Finally, in
accordance with previous work by the National Resource Governance Institute (Sayne et al. 2017),
our paper underlines the importance of verifying that the awardees of oil licences are equipped
with adequate capital, experience, and capabilities to carry out the exploration operations they are
supposedly entitled to.
References
Addison, T., and A.R. Roe (eds) (2018). Extractive Industries. Oxford: Oxford University Press.
https://doi.org/10.1093/oso/9780198817369.001.0001
Alstadsæter, A., N. Johannesen, and G. Zucman (2019). ‘Tax Evasion and Inequality’. American Economic
Review, 109(6): 2073–103. https://doi.org/10.1257/aer.20172043
Andersen, J.J., N. Johannesen, D.D. Lassen, and E. Paltseva (2017). ‘Petro Rents, Political Institutions, and
Hidden Wealth: Evidence from Offshore Bank Accounts’. Journal of the European Economic Association,
15(4): 818–60. https://doi.org/10.1093/jeea/jvw019
Baragwanath, K. (2020). ‘The Effect of Oil Windfalls on Corruption: Evidence from Brazil’. Working
Paper. San Diego: University of California San Diego. https://doi.org/10.33774/apsa-2020-wpt3g
Caselli, F., and G. Michaels (2013). ‘Do Oil Windfalls Improve Living Standards? Evidence from Brazil’.
American Economic Journal: Applied Economics, 5(1): 208–38. https://doi.org/10.1257/app.5.1.208
Cust, J., and D. Mihalyi (2017). ‘Evidence for a Presource Curse? Oil Discoveries, Elevated Expectations,
and Growth Disappointments’. OxCarre Working Paper 193. Oxford: University of Oxford, Centre
for the Analysis of Resource Rich Economies. https://doi.org/10.1596/1813-9450-8140
Economist (2016). ‘A Torrential Leak’. The Economist, 9 April. Available at:
www.economist.com/international/2016/04/09/a-torrential-leak (accessed 25 January 2022).
Gillies, A. (2019). Crude Intentions: How Oil Corruption Contaminates the World. Oxford: Oxford University
Press. https://doi.org/10.1093/oso/9780190940706.001.0001
Gillies, A. (2020). ‘From Brazzaville to Miami: National Oil Company Corruption and Its Global
Implications’. Natural Resource Governance Institute Blog, 22 July. Available at:
https://resourcegovernance.org/blog/brazzaville-miami-national-oil-company-corruption-global-
implications (accessed 25 January 2022).
Hsieh, C.-T., and E. Moretti (2006). ‘Did Iraq Cheat the United Nations? Underpricing, Bribes, and the Oil
for Food Program’. Quarterly Journal of Economics, 121: 1211–48.
https://doi.org/10.1162/qjec.121.4.1211
Humphreys, M., J.D. Sachs, J.E. Stiglitz, M. Humphreys, and G. Soros (2007). Escaping the Resource Curse.
New York: Columbia University Press.
12Lahn, G., and P. Stevens (2018). ‘The Curse of the One-Size-Fits-All Fix’. In T. Addison and A.R. Roe
(eds), Extractive Industries. Oxford: Oxford University Press.
https://doi.org/10.1093/oso/9780198817369.003.0005
Moisé, G.M. (2020). ‘Corruption in the Oil Sector: A Systematic Review and Critique of the Literature’.
Extractive Industries and Society, 7(1): 217–36. https://doi.org/10.1016/j.exis.2020.01.002
OECD (2014). OECD Foreign Bribery Report: An Analysis of the Crime of Bribery of Foreign Public Officials. Paris:
OECD Publishing. https://doi.org/10.1787/9789264226616-en
Östensson, O. (2020). ‘Transparency in Extractive Industry Commodities Trading’. Working Paper
2020/172. Helsinki: UNU-WIDER. https://doi.org/10.35188/UNU-WIDER/2020/929-7
Ross, M.L. (2001). ‘Does Oil Hinder Democracy?’ World Politics, 53(3): 325–61.
https://doi.org/10.1353/wp.2001.0011
Sayne, A., A. Gillies, and A. Watkins (2017). Twelve Red Flags: Corruption Risks in the Award of Extractive Sector
Licenses and Contracts. Washington, DC: Natural Resource Governance Institute. Available at:
https://resourcegovernance.org/sites/default/files/documents/corruption-risks-in-the-award-of-
extractive-sector-licenses-and-contracts.pdf (accessed 25 January 2022).
Sharife, K., and M. Dieng (2019). ‘Senegal’s Offshore Oil Reserves a Pricey Pawn in Covert Deal’. OCCRP,
19 July. Available at: www.occrp.org/en/investigations/senegals-offshore-oil-reserves-a-pricey-
pawn-in-covert-deal (accessed 25 January 2022).
13You can also read