INDEPENDENCE GROUP NL - BMO Global Metals & Mining Conference Peter Bradford - Managing Director & CEO
←
→
Page content transcription
If your browser does not render page correctly, please read the page content below
INDEPENDENCE GROUP NL
BMO Global Metals & Mining Conference
Peter Bradford – Managing Director & CEO

                                           24 – 27 February 2019
                                             ASX:IGO / ADR:IIDDY   1
Cautionary Statements & Disclaimer
• This presentation has been prepared by Independence Group NL (“IGO”) (ABN 46 092 786 304). It should not be considered as an offer or invitation to subscribe for or purchase any
    securities in IGO or as an inducement to make an offer or invitation with respect to those securities in any jurisdiction.
• This presentation contains general summary information about IGO. The information, opinions or conclusions expressed in the course of this presentation should be read in conjunction with
    IGO’s other periodic and continuous disclosure announcements lodged with the ASX, which are available on the IGO website. No representation or warranty, express or implied, is made in
    relation to the fairness, accuracy or completeness of the information, opinions and conclusions expressed in this presentation.
• This presentation includes forward looking information regarding future events, conditions, circumstances and the future financial performance of IGO. Often, but not always, forward looking
    statements can be identified by the use of forward looking words such as "may", "will", "expect", "intend", "plan", "estimate", "anticipate", "continue" and "guidance", or other similar words and
    may include statements regarding plans, strategies and objectives of management, anticipated production or construction commencement dates and expected costs or production outputs.
    Such forecasts, projections and information are not a guarantee of future performance and involve unknown risks and uncertainties, many of which are beyond IGO’s control, which may cause
    actual results and developments to differ materially from those expressed or implied. Further details of these risks are set out below. All references to future production and production
    guidance made in relation to IGO are subject to the completion of all necessary feasibility studies, permit applications and approvals, construction, financing arrangements and access to the
    necessary infrastructure. Where such a reference is made, it should be read subject to this paragraph and in conjunction with further information about the Mineral Resources and Ore
    Reserves, as well as any Competent Persons' Statements included in periodic and continuous disclosure announcements lodged with the ASX. Forward looking statements in this
    presentation only apply at the date of issue. Subject to any continuing obligations under applicable law or any relevant stock exchange listing rules, in providing this information IGO does not
    undertake any obligation to publicly update or revise any of the forward looking statements or to advise of any change in events, conditions or circumstances on which any such statement is
    based.
• There are a number of risks specific to IGO and of a general nature which may affect the future operating and financial performance of IGO and the value of an investment in IGO including
    and not limited to economic conditions, stock market fluctuations, commodity demand and price movements, access to infrastructure, timing of environmental approvals, regulatory risks,
    operational risks, reliance on key personnel, reserve and resource estimations, native title and title risks, foreign currency fluctuations and mining development, construction and
    commissioning risk. The production guidance in this presentation is subject to risks specific to IGO and of a general nature which may affect the future operating and financial performance of
    IGO.
•   All currency amounts in Australian Dollars unless otherwise noted.
•   Net Debt is outstanding debt less cash balances and Net Cash is cash balance less outstanding debt.
•   Cash Costs are reported inclusive of Royalties and after by-product credits on per unit of payable metal basis, unless otherwise stated.
•   IGO reports All-in Sustaining Costs (AISC) per ounce of gold for its 30% interest in the Tropicana Gold Mine using the World Gold Council guidelines for AISC. The World Gold Council
    guidelines publication was released via press release on 27 June 2013 and is available from the World Gold Council’s website.
• Underlying EBITDA is a non-IFRS measure and comprises net profit or loss after tax, adjusted to exclude tax expense, finance costs, interest income, asset impairments, gain/loss on sale of
    subsidiary, redundancy and restructuring costs, depreciation and amortisation, and once-off transaction costs.
• Free Cash Flow comprises Net Cash Flow from Operating Activities and Net Cash Flow from Investing Activities. Underlying adjustments exclude acquisition costs, proceeds from investment
    sales and payments for investments.

                                                                                                                                                                                                          2
Competent Person’s Statements
• Any references to IGO Mineral Resource and Ore Reserve estimates should be read in conjunction with IGO’s Annual Update of Exploration Results, Mineral Resources and Ore Reserves
  dated 20 February 2019 (Annual Statement) and lodged with the ASX for which Competent Person’s consents were obtained, which is also available on the IGO website.
• The information in this presentation that relates to the Boston Shaker Pre-Feasibility Study is extracted from the ASX announcement dated 20 December 2018 entitled “Pre-Feasibility Study
  Confirms Potential for Underground Mine at Tropicana” and for which a Competent Person consent was obtained. A portion of the production target referred to in this announcement is based
  on Inferred Mineral Resources. There is a low level of geological confidence associated with Inferred Mineral Resources and there is no certainty that further exploration work will result in the
  determination of Indicated Mineral Resources or that the production target will be realised.
• The Company confirms that it is not aware of any new information or data that materially affects the information included in the original ASX announcements released 20 December 2018 and
  20 February 2019 and, (i) in the case of estimates or Mineral Resources or Ore Reserves, that all material assumptions and technical parameters underpinning the estimates in the original
  ASX announcement continue to apply and have not materially changed, (ii) the Competent Person’s consents remain in place for subsequent releases by the Company of the same
  information in the same form and context, until the consent is withdrawn or replaced by a subsequent report and accompanying consent, and (iii) the form and context in which the Competent
  Person’s findings are presented have not been materially modified from the original ASX announcement.

                                                                                                                                                                                                       3
Purpose 4

Global warming: An increasingly
critical global issue
• Trend away from fossil fuels to
  renewable energy
• Strong government support globally
  for mass adoption of EVs and
  energy storage
   ─ Bans on conventional ICE vehicles
     in some city centres
   ─ Subsidies for EV manufacturers
   ─ Substantial investments in recharge
     infrastructure

                                           5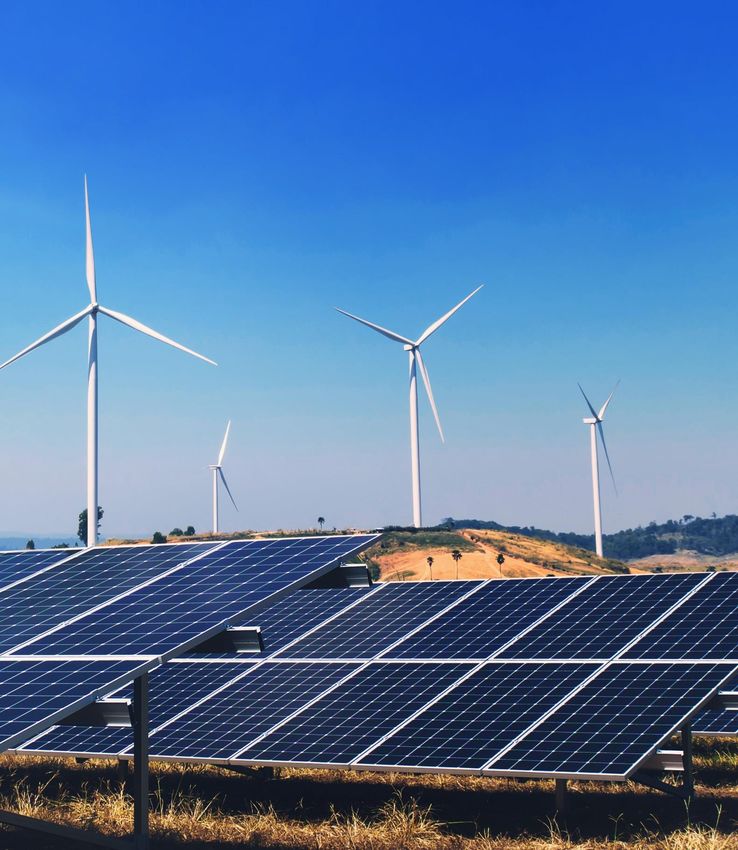
Trend to Increased EV Numbers(1)                                            Trend to More Nickel in EV Batteries(3)

Global EV sales                                                                                                                                 2.1%
(million units)                                                                                                                    2.1%

20                                                                                                                    9.0%                      4.6%
                                                                                                                                  13.8%
18                                                                                                        27.4%
                                                                                           30.4%
16

14
                                                                    38% CAGR
12

10
                                                                                           30.2%          36.2%       71.9%
                                                                                                                                                82.3%
  8
                                                                                                                                  73.1%
  6
                         45% CAGR
  4

  2
                                                                                           28.3%          25.5%
  0
                                                                                                                      8.4%

                                                                                           11.0%          10.9%       10.7%       11.0%         10.9%
                     China             Europe              US             Japan    ROW
                                                                                         NMC (111)      NMC (433)   NMC (811)     NCA           NCA+

                                                                                          Aluminium        Cobalt     Nickel    Manganese        Lithium
1) UBS Research, November 2018
2) CAGR means Compound Annual Growth Rate
                                                                                                                                                           6
3) Proportion of metals in EV battery cathodes for different battery chemistries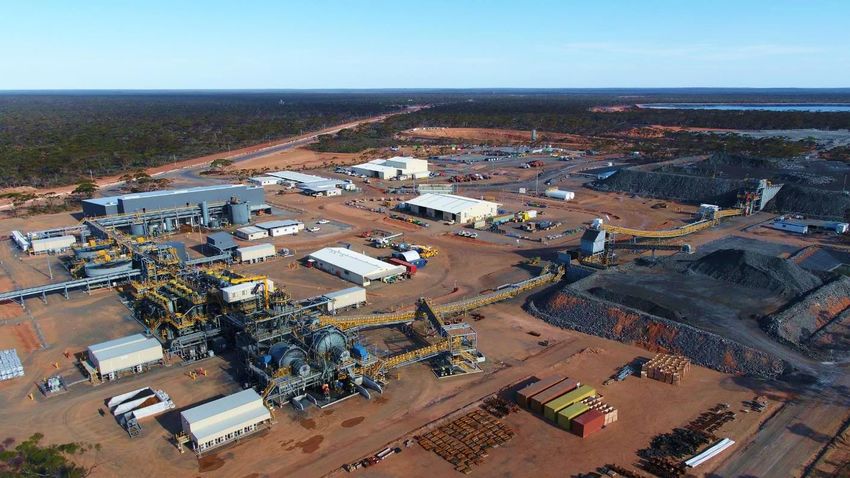
Nickel to be a big winner from EV Decreasing nickel stockpiles and
battery demand disruption with 300- stainless steel demand growth to
900kt of additional nickel required by maintain market supply deficit
2025(1)
Nickel Market Supply/Demand Balance(2) Official Nickel Exchange Stockpiles and Price(3)
(kt) Nickel Stocks Nickel Price
(kt) (US$/t)
200
152 600 23,000
Thousands
150 123 21,000
100 500
54
19,000
50 400 17,000
0 15,000
300
-50 -36 13,000
-100 200 11,000
-107
-150 9,000
100
-200 7,000
-200
-217 - 5,000
-250 -227
-248
Apr-14
Apr-15
Apr-16
Apr-17
Apr-18
Oct-14
Oct-15
Oct-16
Oct-17
Jul-18
Oct-18
Jul-14
Jul-15
Jul-16
Jul-17
Jan-16
Jan-14
Jan-15
Jan-17
Jan-18
Jan-19
-257
-300
2013 2014 2015 2016 2017 2018 2019 2020 2021 2022
LME Warehouse Nickel SHFE Nickel Stocks Nickel Price (RHS)
1) Source: UBS Research 28 Jun 2018: UBS Global I/O: Miner’s Price Review, Still Got It
2) Source: UBS Research 22 Nov 2018: UBS Global I/O: What does EV Battery Tear-Down imply for battery raw materials
3) Source: Bloomberg 7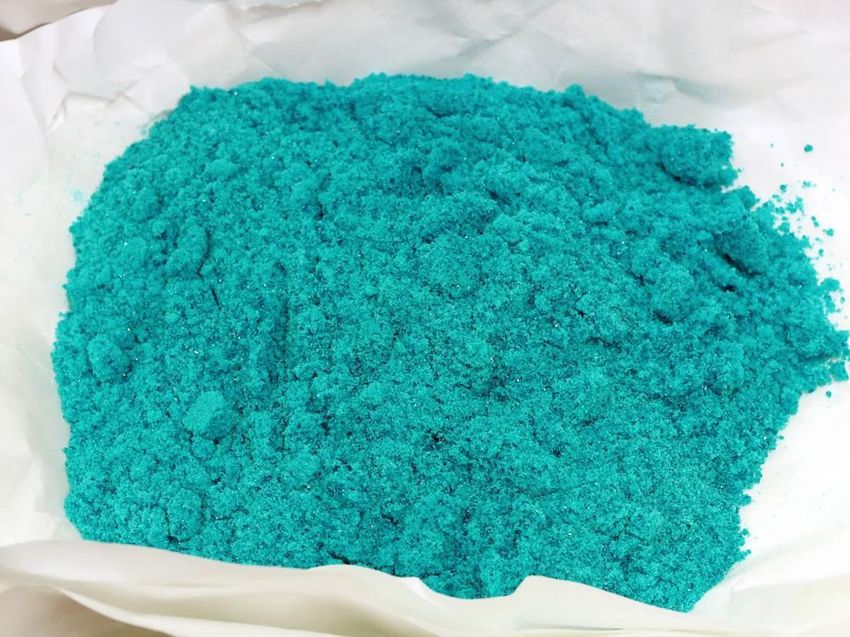
Our Purpose is Making a Difference by aligning the business to the
structural shift to clean energy

           Become a globally relevant supplier of metals that are critical to energy
           storage and renewable energy

           Be vertically integrated to produce battery grade chemicals and cathode
           precursors

           Deliver quality products desired by end users made safely, ethically,
           sustainably and reliably

           Be proactively green by using renewables, energy storage and EV mining
           equipment to reduce carbon footprint

           Delivered by people who are bold, passionate, fearless and fun – a smarter,
           kinder, more innovative team

                                                                                         8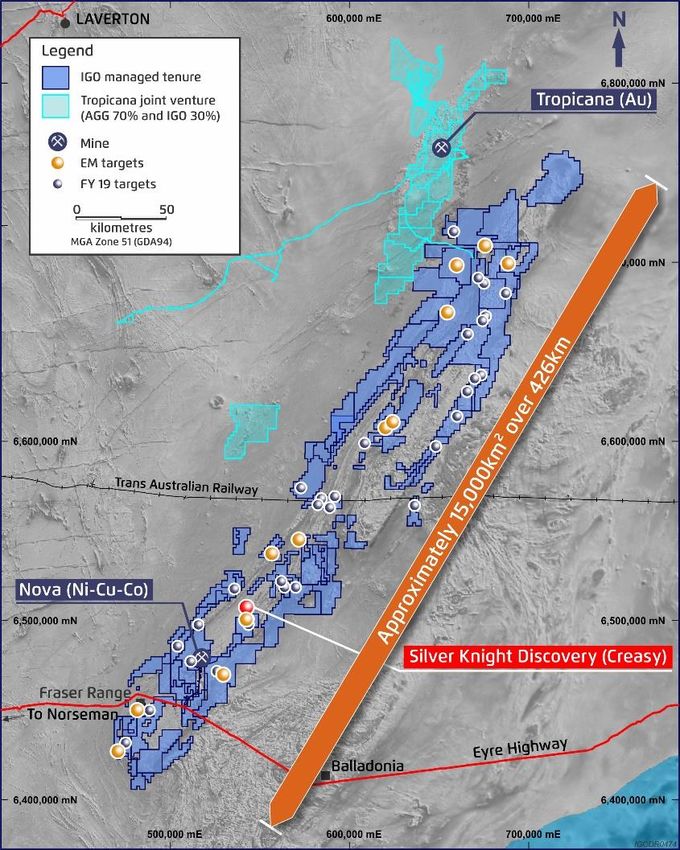
A Streamlined Core Portfolio
                               Strategic focus on minerals critical
                               to energy storage and EV
                                                            IGO EBITDA Profile (A$M)(1)
                               600

                               500

                               400

                               300

                               200

                               100

                                 -
                                 FY12      FY13    FY14             FY15    FY16   FY17   FY18 FY19e FY20e FY21e
                                          Long (A$M)               Jaguar (A$M)     Tropicana (A$M)  Nova (A$M)

                                 1) Macquarie Research – 31 Jan 2019
                                                                                                             9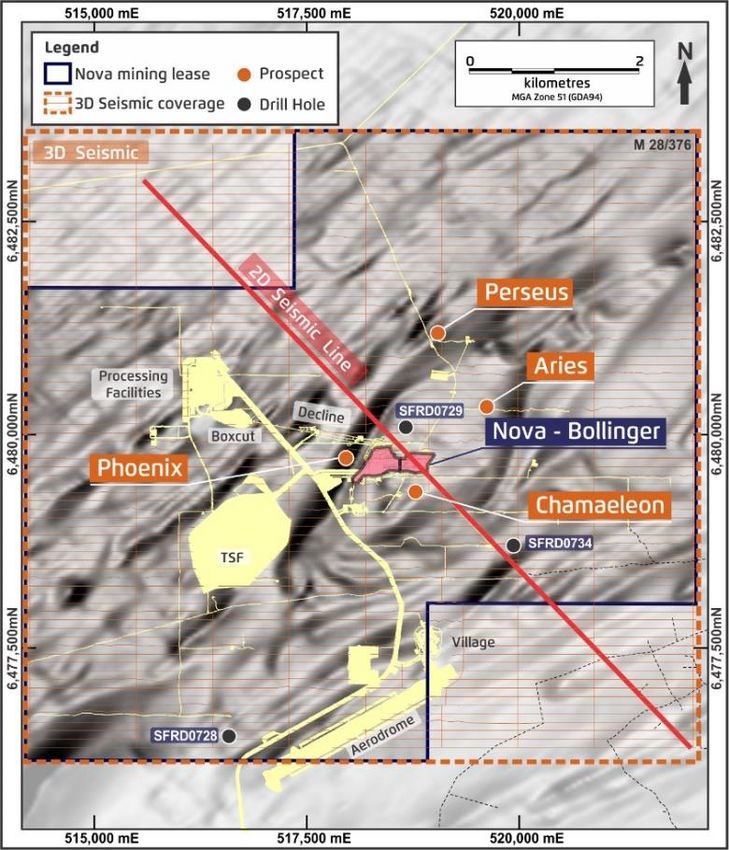
Nova

       10
Nova de-risked
• Successful first six quarters of
commercial production
─ 1.5Mtpa nameplate exceeded
─ Record production during 1H19
• Mine life sustained at 8 years with
reserve marginally higher
Nova Metal Production in Concentrate
Tonnes A$/lb Payable
8,000 7,344 7,574 4.50
6,854 4.00
7,000
5,961 3.50
6,000
3.00
5,000 4,500 4,454
2.50
4,000 3,230 3,482
3,019 2.00
3,000 2,472
2,011 1.50
1,832
2,000 1.00
1,000 0.50
0 -
1Q18 2Q18 3Q18 4Q18 1Q19 2Q19
Nickel in concentrate Copper in concentrate Payable Nickel Cash Cost
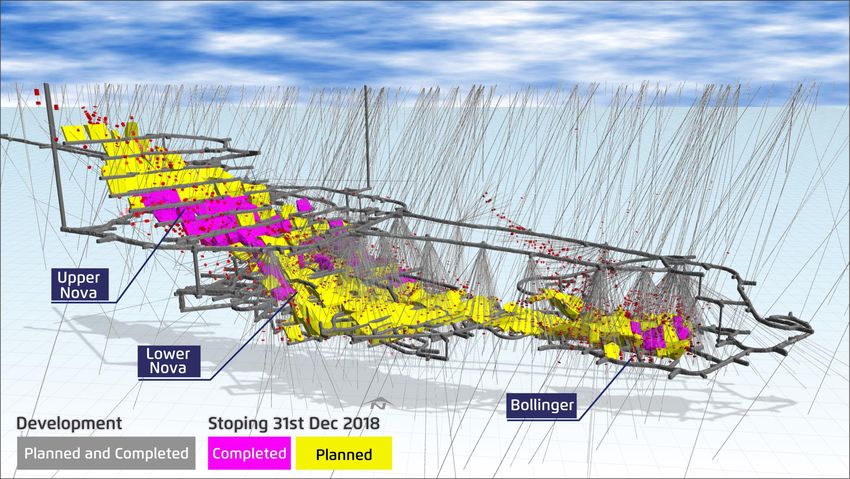
11Nova Underground Mine Design & Drilling
Grade control and underground capital development substantially complete
12Directional Production and Cash Costs
Strong outlook for Nova
kt A$/lb payable
• Consistent and higher production
30 3.0
rate expected next three years
2.5 • Main driver is higher grade stopes
20 2.0
in core of Nova and Bollinger
• Assumes:
1.5
─ 1.5Mtpa mining/processing rate
─ 89% nickel recovery and 85%
10 1.0
0.5 copper recovery
- -
─ Commodity price for by-product
FY18A FY19E FY20E FY21E
credits of A$4.08/lb for copper and
Nickel produced Nickel production min
Nickel production range Cash cost forecast range
A$50/lb for cobalt
13Nova Opportunity
14Nickel sulphate for EV batteries
• Produce nickel sulphate direct from
Nova nickel concentrate
• Technical feasibility confirmed with
continuous pilot plant testwork
• Pre-feasibility Study to be
completed during 2H FY19
• Delivers potential for:
─ Higher payability
─ Premium price, and;
─ Higher concentrator recoveries
1) Photographs to the RHS are of the 1.6kg of nickel sulphate hexahydrate crystals produced in the metallurgical
testwork. Photography by Karel Osten, Wood Plc
15Nova Near Mine Exploration
• Potential to discover brownfields
extensions to Nova system
• A$12M commitment within Nova
mining lease in FY19
• Leveraged multiple geophysical
platforms including largest hard rock
3D seismic survey in Australia
• Now drilling testing first seismic
targets
16February 2018
Fraser Range Exploration
• Greenfields exploration targeting Nova
style discoveries through systematic
exploration over ~15,000km2
• 40 targets identified for drilling in 2019
• Technical success at Andromeda with
Cu-Zn-Au-Ag discovery
• Creasy Group Silver Knight discovery
(30km NE of Nova) validates strategy
• Five high priority targets near Silver
Knight at Widowmaker concession(1)
1) Widowmaker is a joint venture between IGO (90%) and Buxton Resources (10%)
2) www.dmirs.wa.gov.au Online Catalogue 17Widowmaker
• Located immediately South of Silver
Knight Discovery(2) (30km NE of Nova)
• Five high-priority targets defined using
EM and aircore drilling, including:
─ Ecliptic contains disseminated
sulphides in aircore drilling
─ Solar is a Squid EM anomaly along
strike from Silver Knight
• Drill testing to commence in 3Q19
1) Widowmaker is a joint venture between IGO (90%) and Buxton Resources (10%)
2) www.dmirs.wa.gov.au Online Catalogue 18Tropicana
19
19Tropicana: increased production Tropicana Production (100%) & AISC
and lower costs in FY19 Gold production (oz) AISC (A$/oz)
600,000 1,200
• 30% IGO & 70% AngloGold Ashanti
(managers) 500,000 1,000
• 8.0Mtpa processing rate achieved
400,000 800
in 1H19
• 1H19 production of 262koz (100% 300,000 600
basis) at AISC of A$934/oz
• 8 year mine life remaining 200,000 400
• Value enhancement projects being 100,000 200
delivered
0 0
FY14 FY15 FY16 FY17 FY18 FY19E
Gold Production (oz) AISC (A$/oz)
1) Refer to IGO annual reports for FY14 to FY18
2) FY19E is the midpoint of guidance for FY19. Refer ASX Release dated 29 July 2018 – Guidance Range of
500,000 to 550,000oz gold production at AISC of A$890/oz to A$980/oz gold sold 20Tropicana Optimisation: Second
ball mill delivering as planned
• Project successfully commissioned
in 2Q19 as guided
• Immediate increase in throughput
rate and improvement in grind,
resulting in improved gold recovery
Throughput (tph)
Throughput (t/op.h) Grind
Grind (microns)
Size P80 Recovery
Recovery*(%)
980
4%
100 27% 91
2.5%
960 80 90
940 60 89
920 40 88
900 20 87
880 0 86
Nov Dec Nov Dec Nov Dec
21Tropicana Underground Potential Boston Shaker Underground Development Layout (3)
• Boston Shaker PFS completed in
December 2018(1) -confirmed
technical and financial viability of an
underground development
─ Mining ~1Mtpa to produce
~100koz/year over a 7 year mine life
─ Capex estimate of A$95M(2)
─ Operating cost of A$102/t inclusive
of underground capital development
costs post first gold production
• Feasiblity Study underway, expected
to be completed in 2H19
1) Refer to ASX release dated 20 Dec 2018: Pre-Feasibility Study Confirms Potential for Underground Mine at Tropicana
2) 100% basis
22
3) Refer to ASX release dated 20 Feb 2019: CY18 Mineral Resource & Ore Reserve StatementTropicana mineralised system 1) Refer to IGO ASX release dated 20 Feb 2019: CY18 Mineral Resource & Ore Reserve Statement 23
Our Critical Enablers 24
People & Culture: A key part of
the IGO Difference
• Strong sense of purpose
• Empowered people who are
  owners of the business
• Focus on doing what is right –
  because we care
• Collectively we are making a
  difference
• Fostering the next generation of
  industry leaders

                                     25
Sustainability & Safety
Industry leading ESG reporting
Key Lag Safety Metrics(1,2,4)
6
2018 ACSI Rating of ASX200 Sustainability Reporting (5)
5
LTIFR 12 MMA
4 MTIFR 12 MMA
Leading
3
Detailed 2
1
Moderate
0
Sep-17 Dec-17 Mar-18 Jun-18 Sep-18 Dec-18
Basic
Key Lead Safety Metrics(3)
No Reporting
10
Sector Sector ASX 200
1
Average Leader Average
“Leading” rating each of the last three years 0.1
1) 12 month moving average MTIFR – Medically Treated Injury Frequency Rate: calculated as the number of medically 0.01
treated injuries x 1,000,000 divided by the total number of hours worked
2) 12 month moving average LTIFR – Lost Time Injury Frequency Rate: calculated as the number of Lost Time injuries x
1,000,000 divided by the total number of hours worked
0.001
3) VSLI: Visual Safety Leadership Interaction
Sep-17 Dec-17 Mar-18 Jun-18 Sep-18 Dec-18
4) Jun-18 LTIFR rate has increased from 1.96 to 2.39 as a result of the reclassification of a single injury from the June
2018 Quarter
VSLI Index Hazard Index Near Miss Index Workplace Inspection Index
5) Australian Council of Superannuation Investors (ACSI)
26Innovating to unlock new
opportunities
• Patented downstream processing
technology to produce nickel
sulphate for the battery market
Technology • Implementation of remote stoping
operations and remote firing from
surface
• First fully integrated commercial
hybrid diesel/solar PV facility in
Australia
27Commitment to Discovery with
A$51M investment in FY19
• Best in class exploration and
discovery capability
• Greenfields focus to discover the
mines of the future
A$12.0M
Nova
Tropicana
A$3.0M
A$2.5M Long
A$33.0M
Greenfields,
Generative & Other
28Corporate & Financial
29Financial Performance: Building Momentum
Revenue & Other Income Underlying EBITDA(1) Net Cash from Operating Activities
A$(M) A$(M) A$(M)
450 426 250 180 167 163
400 205 160
355 356
200
350 140
300 120 111
150 133 131
250 223 100
198
200 100 80
82
150 69 60 52
100 50 40 26
50 20
0 0 0
1H17 2H17 1H18 2H18 1H19 1H17 2H17 1H18 2H18 1H19 1H17 2H17 1H18 2H18 1H19
Net Profit after Tax Underlying Free Cash Flow (2) Net Cash Position
A$(M) A$(M) A$(M)
60 140 150
50 120 111 91 94
50 98 100
100
40 80 50
60 41
30 0
40
20 -4
20 20 -50
0
10 -20 -100
3
1
-40 -120
0 -150
-60 -49
-3 -64 -164
-10 -80 -200
1H17 2H17 1H18 2H18 1H19 1H17 2H17 1H18 2H18 1H19 1H17 2H17 1H18 2H18 1H19
1) Underlying EBITDA is a non-IFRS measure (refer to Disclaimer page).
2) Underlying Free Cash Flow comprises Net Cash Flow from Operating Activities and Net cash Flow from Investing Activities, together with certain adjustments. Underlying Free Cash Flow in 1H19 excludes A$10M final instalment proceeds on divestment of
Stockman Project, A$0.7M net proceeds on sale of Jaguar, A$6.9M payments for the acquisition of financial assets and A$6.5M relating to acquisition of Southern Hills tenements (1H18: excludes A$11M in partial proceeds received from the divestment of 30
the Stockman Project).Focus on high quality, long life
Share Ownership
assets that deliver great financial
Substantial Holders(1) Institutional Ownership(3)
outcomes Mark Creasy 15% Australia 51%
FIL 9% USA 17%
ASX IGO T Rowe Price 8% Europe 4%
Base Perth, WA CBA 6% ROW 3%
Ausbil 5%
Market Cap(1) A$2.8 billion
Cash(2) A$208M Share Price Performance(1)
A$/share Volume (M)
Debt(2) A$114M 6.00 14.00
5.50 12.00
Shareholder Returns 15 to 25% FCF 5.00
10.00
4.50
8.00
4.00
6.00
3.50
4.00
3.00
2.50 2.00
2.00 -
Nov-18
Dec-18
Jun-18
Jan-19
Aug-18
Sep-18
Apr-18
Oct-18
Jul-18
Mar-18
Feb-18
Feb-19
May-18
1) As at market close 19 Feb 2019
2) As at 31 Dec 2018
3) As at 28 Jan 2019
31Capital Allocation to balance growth
and cash returns to shareholders
Capital to • New shareholder returns policy
Capital to grow
sustain the
the business and ─ Cash return of 15-25% of FCF
business and
increase
deliver ─ Strategy incorporates franked or
underlying value
consistent
per share unfranked dividends, special
results
dividends and share buy backs
─ Policy to be reviewed every 2 years
Cash returns to • A$58M (approx. 10 cents per share)
shareholders of fully frankable dividends
(dividend and
share buy back) available at 31 December 2018
• FY19 Interim Dividend of 2 cents per
share fully franked paid on 1 March
32Concluding Comments
• Strong free cash generation and
strengthening balance sheet
• Nova and Tropicana delivering metal
production within guidance
• Transformational growth initiatives being
successfully implemented
• Assessment of downstream nickel
sulphate opportunity nearing completion
• A$51M exploration program underway with
multiple priority targets to be tested in
2019
3334
You can also read