INDIA'S PREMIER RENEWABLE ENERGY COMPANY - RENEW POWER

Page created by Kim Bates
 
CONTINUE READING
INDIA'S PREMIER RENEWABLE ENERGY COMPANY - RENEW POWER
India’s
Premier
Renewable
Energy
Company

For Further Inquiries Please Contact
IR@renewpower.in
Anunay.Shahi@renewpower.in
INDIA'S PREMIER RENEWABLE ENERGY COMPANY - RENEW POWER
Disclaimer
THIS PRESENTATION AND ITS CONTENTS ARE CONFIDENTIAL AND ARE NOT FOR                                              solicitation or sale would be unlawful prior to registration or qualification under the securities laws of
RELEASE, REPRODUCTION, PUBLICATION OR DISTRIBUTION, IN WHOLE OR IN PART,                                         any such state or jurisdiction, and nothing contained herein shall form the basis of any contract or
DIRECTLY OR INDIRECTLY, TO ANY OTHER PERSON OR IN OR INTO OR FROM THE UNITED                                     commitment whatsoever. The contents of this presentation have not been reviewed by any
STATES OF AMERICA (EXCEPT TO QUALIFIED INSTITUTIONAL INVESTORS AS DEFINED                                        regulatory authority in any jurisdiction.
BELOW), AUSTRALIA, CANADA, JAPAN, SOUTH AFRICA OR ANY JURISDICTION WHERE
SUCH RELEASE, REPRODUCTION, PUBLICATION OR DISTRIBUTION IS UNLAWFUL.                                             If the contemplated business combination is pursued, RMG II will be required to file a preliminary and
PERSONS INTO WHOSE POSSESSION THIS DOCUMENT COMES SHOULD INFORM                                                  definitive proxy statement, which may include a registration statement, and other relevant documents
THEMSELVES ABOUT, AND OBSERVE, ANY SUCH RESTRICTIONS. THIS PRESENTATION IS                                       with the U.S. Securities and Exchange Commission (“SEC”). You are urged to read the proxy
NOT AN OFFER OR AN INVITATION TO BUY, SELL OR SUBSCRIBE FOR SECURITIES..                                         statement and any other relevant documents filed with the SEC when they become available
                                                                                                                 because they will contain important information about RMG II, ReNew and their contemplated
Presentation Disclaimer                                                                                          business combination. Shareholders will be able to obtain a free copy of the proxy statement (when
                                                                                                                 filed), as well as other filings containing information about RMG II, ReNew and their contemplated
This presentation has been prepared for use by RMG Acquisition Corp. II (“RMG II”) and ReNew                     business combination, without charge, at the SEC’s website located at www.sec.gov. RMG II and its
Power Private Limited (“ReNew”), and is intended solely for investors that are qualified institutional           directors and executive officers may be deemed to be participants in the solicitation of proxies from
buyers (as defined in Rule 144A under the Securities Act of 1933, as amended) and eligible                       RMG II’s shareholders in connection with the proposed transaction. A list of the names of such
institutional investors outside the U.S. (such as, in the EU, eligible counterparties and professional           directors and executive officers and information regarding their interests in the business combination
clients each as defined in Directive 2014/65/EU, as amended) for the purposes of familiarizing such              will be contained in the proxy statement when available. You may obtain free copies of these
investors with RMG II and ReNew in connection with their proposed business combination. Further,                 documents as described in the preceding paragraph. The definitive proxy statement will be mailed to
this presentation is only addressed to and directed at specific addressees who: (A) if in member                 shareholders as of a record date to be established for voting on the contemplated business
states of the European Economic Area (the “EEA”), are persons who are “qualified investors” within               combination when it becomes available.
the meaning of Article 2(e) of Regulation (EU) 2017/1129 (as amended) (“Qualified Investors”); and
(B) if in the United Kingdom, are Qualified Investors who are: (i) persons having professional                   While utmost care has been taken in preparing the presentation, none of RMG II, ReNew, or their
experience in matters relating to investments who fall within the definition of “investment                      respective advisors or representatives or any of their respective affiliates accept any liability
professionals” in Article 19(5) of the Financial Services and Markets Act 2000 (Financial Promotion)             whatsoever for any loss howsoever arising from any information presented or contained in this
Order 2005 (the “Order”); or (ii) high net worth entities falling within Article 49(2)(a) to (d) of the Order;   presentation, or the opinion expressed by the presenters. You must make your own assessment of
or (C) are other persons to whom it may otherwise lawfully be communicated (all such persons                     the relevance, accuracy and adequacy of the information contained in this presentation and must
referred to in (B) and (C) together being “Relevant Persons”). This presentation must not be acted or            make such independent investigation as you may consider necessary or appropriate for such
relied on (i) in the United Kingdom, by persons who are not Relevant Persons and (ii) in any member              purpose. Further, past performance is not necessarily indicative of future results. The presentation
state of the EEA by persons who are not Qualified Investors. Any investment or investment activity to            should not be construed as legal, tax, investment or other advice. This presentation does not purport
which this presentation relates is or will be available only to, and may be engaged in only with, (i)            to contain all of the information that may be required to evaluate the contemplated business
Relevant Persons in the United Kingdom; and (ii) Qualified Investors in any member state of the EEA.             combination or any investment in RMG II or any of its securities and should not be relied upon to
                                                                                                                 form the basis of, or be relied on in connection with, any contract or commitment or investment
For the purposes of this notice, the “presentation” that follows shall mean and include the slides that          decision whatsoever. This presentation is intended to present background information on RMG II
follow, the oral presentation of the slides by members of RMG II or ReNew’s management or any                    and ReNew, their business and the industry in which they operate and is not intended to provide
person on their behalf, the question-and-answer session that follows that oral presentation, hard                complete disclosure upon which an investment decision could be made.
copies of this document and any materials distributed at, or in connection with, that presentation. By
attending the meeting where the presentation is made, or by reading the presentation slides, you will            The merit and suitability of an investment in RMG II should be independently evaluated and any
be deemed to have (i) agreed to the following limitations and notifications and made the following               person considering such an investment is advised to obtain independent advice as to the legal, tax,
undertakings and (ii) acknowledged that you understand the legal and regulatory sanctions attached               accounting, financial, credit and other related advice prior to making an investment.
to the misuse, disclosure or improper circulation of this presentation.

This presentation has been prepared by RMG II and ReNew, is preliminary in nature and solely for
information and discussion purposes and must not be relied upon for any other purpose. This
presentation does not constitute an offer to sell, buy or subscribe for any securities, and is not a
recommendation or solicitation of any vote in any jurisdiction pursuant to the proposed transaction or
otherwise, or of an offer to subscribe for or purchase any securities in the United States or any other
jurisdiction nor shall there be any sale of any securities in any state or jurisdiction in which such offer,

                                                                                                                                                                                                                              2
INDIA'S PREMIER RENEWABLE ENERGY COMPANY - RENEW POWER
Disclaimer
Confidential Information                                                                                   Projections

The information contained in this presentation is confidential and being provided to you solely for the    The financial projections, estimates and targets in this presentation are forward-looking statements
purpose of assisting you in familiarizing yourself with RMG II and ReNew in connection with their          that are based on assumptions that are inherently subject to significant uncertainties and
proposed business combination. This presentation is being provided solely for your confidential use        contingencies, many of which are beyond RMG II and ReNew’s control. While all financial projections,
with the express understanding that you will not release any portion of this document, discuss the         estimates and targets are necessarily speculative, RMG II and ReNew believe that the preparation of
information contained herein, or make reproductions of or use this presentation for any other purpose      prospective financial information involves increasingly higher levels of uncertainty the further out the
without the prior express written permission of RMG II and ReNew. By reviewing this information, you       projection, estimate or target extends from the date of preparation. The assumptions and estimates
are acknowledging the confidential nature of this information and are agreeing to abide by the terms of    underlying the projected, expected or target results are inherently uncertain and are subject to a wide
this legend.                                                                                               variety of significant business, economic and competitive risks and uncertainties that could cause
                                                                                                           actual results to differ materially from those contained in the financial projections, estimates and
Forward-Looking Statements                                                                                 targets. The inclusion of financial projections, estimates and targets in this presentation should not be
                                                                                                           regarded as an indication that RMG II or ReNew, or their representatives, considered or consider the
This presentation contains forward-looking statements that reflect our current views with respect          financial projections, estimates and targets to be a reliable prediction of future events.
to, among other things, our industry, operations and financial performance. Forward-looking
statements include all statements that are not historical facts. In some cases, you can identify
these forward-looking statements by the use of words such as “outlook,” “believes,” “expects,”            IndAS, Non-IndAS, IFRS and Non-IFRS Financial Measures
“potential,” “continues,” “may,” “will,” “should,” “could,” “seeks,” “predicts,” “intends,” “trends,”
“plans,” “estimates,” “anticipates” or the negative version of these words or other comparable            This presentation includes financial data prepared in accordance with Indian Accounting Standards
words. Such forward-looking statements are subject to various risks and uncertainties.                    (“IndAS”) and International Financial Reporting Standards as issued by the International Accounting
Accordingly, there are or will be important factors that could cause actual outcomes or results to        Standards Board (“IFRS”). There are significant differences between IndAS and IFRS and U.S. GAAP.
differ materially from those indicated in these statements. Some of the factors that may cause            We have not attempted to explain such differences or quantify their impact on the financial data
actual outcomes or results to differ materially from those expressed in, or implied by, the forward-      included herein, and we urge you to consult your own advisors regarding such differences and their
looking statements include general economic conditions, competitive pressures, disruptions to             impact on our financial data. Accordingly, the degree to which the financial data included in this
information technology systems and networks, changes in regulation and other contingencies.               presentation will provide meaningful information is entirely dependent on the reader’s level of familiarity
We undertake no obligation to publicly update or review any forward-looking statement, whether            with IndAS and IFRS.
as a result of new information, future developments or otherwise, except as required by law. In
light of these risks, uncertainties and assumptions, the forward-looking events and circumstances         This presentation also includes certain financial measures not presented in accordance with IndAS or
discussed in this presentation may not occur and actual results could differ materially and               IFRS, including EBITDA and EBITDA Margin. These non-IndAS and non-IFRS financial measures are
adversely from those anticipated or implied in the forward-looking statements. We caution you             not measures of financial performance in accordance with IndAS or IFRS, respectively, and may
therefore against relying on these forward-looking statements, and we qualify all of our forward-         exclude items that are significant in understanding and assessing ReNew’s financial results or position.
looking statements by these cautionary statements.                                                        Therefore, these measures should not be considered in isolation or as an alternative to measures of
                                                                                                          profitability, liquidity or performance under IndAS or IFRS. You should be aware that ReNew’s
All information herein speaks only as of (1) the date hereof, in the case of information about RMG        presentation of these measures may not be comparable to similarly titled measures used by other
II and ReNew, or (2) the date of such information, in the case of information from persons other          companies which may be defined and calculated differently. Additionally, to the extent that forward-
than RMG II and ReNew. Forecasts and estimates regarding RMG II and ReNew’s industries and                looking non-IndAS measures are provided, they are presented on a non-IndAS basis without
end markets are based on sources we believe to be reliable; however there can be no assurance             reconciliations of such forward-looking non-IndAS measures due to the inherent difficulty in forecasting
these forecasts and estimates will prove accurate in whole or in part. You should read this               and quantifying certain amounts that are necessary for such reconciliations. Likewise, to the extent that
                                                                                                          forward-looking non-IFRS measures are provided, they are presented on a non-IFRS basis without
presentation with the understanding that our actual future results, levels of activity, performance
                                                                                                          reconciliations of such forward-looking non-IFRS measures due to the inherent difficulty in forecasting
and events and circumstances may be materially different from what we expect. You should
                                                                                                          and quantifying certain amounts that are necessary for such reconciliations
carefully consider the risks and uncertainties described in the “Risk Factors” section of the proxy
statement/prospectus on Form S-4 relating to the business combination, which is expected to be
filed by RMG II with the SEC and other documents filed by RMG II from time to time with the
SEC. These filings identify and address other important risks and uncertainties that could cause
actual events and results to differ materially from those contained in the forward-looking
statements. RMG II and ReNew assume no obligation and do not intend to update or revise
these forward-looking statements, whether as a result of new information, future events, or
otherwise.

                                                                                                                                                                                                                 3
INDIA'S PREMIER RENEWABLE ENERGY COMPANY - RENEW POWER
Our Vision:              World Economic                      Reuters Award                  UN Global Compact
                        Forum Award 2021:                         2020:                     Network India Award
“To Build the            Global Lighthouse                    Clean Energy                   2020: Sumant Sinha
Best Renewable              Network of                       Transition Award               recognized as India’s
                            Companies                                                           SDG Pioneer
Energy Company
in the World”

Largest Pure-
Play Renewable                       S&P Global Platts
                                                                            S&P Platts Global
Company in                                                                    Energy Awards
                                     2020 CSR Award:
                                                                                    2019:
India and One                       Diversified Program of
                                                                            Rising Star Company
of the Largest                             the Year
                                                                                 of the Year
in the World (1)

Note:
1. Source: IHS Markit
INDIA'S PREMIER RENEWABLE ENERGY COMPANY - RENEW POWER
About Presenters

                              • 31 years of experience
       Sumant Sinha
                              • Former COO – Suzlon; Founder & CEO – Aditya Birla Retail
       Founder,
       Chairman and CEO       • Prior Experience: Group CFO - Aditya Birla Group; Investment Banking in Citi (US)
                               and ING Barings (UK)

      D Muthukumaran          • 29 years of experience
      Chief Financial         • Head - Group Corporate Finance at Aditya Birla Group and CEO at Aditya Birla PE
      Officer                 • Prior Experience: Investment Banking in Lazard and Corporate Finance in Deloitte

      Kailash Vaswani         • 19 years of experience in Corporate Finance and Investing
      President,              • Prior Experience: Saffron Asset Advisors and Aditya Birla Group
      Corporate Finance       • Responsible for all debt and equity raising for ReNew

                              • Chairman of the Board of Romeo Power, Inc.
                              • Former Chairman & CEO of Cogentrix Energy, a fully integrated IPP
       Bob Mancini            • Prior Experience: Former Partner, Founder & Co-Head of Power Investment
       RMG CEO and Director    Business at Carlyle; Former Managing Director of Goldman Sachs; Co-Founder &
                               Head of Power Investment Business, Founder & Head of Commodities Principal
                               Investment Business

                                                                                                             5
INDIA'S PREMIER RENEWABLE ENERGY COMPANY - RENEW POWER
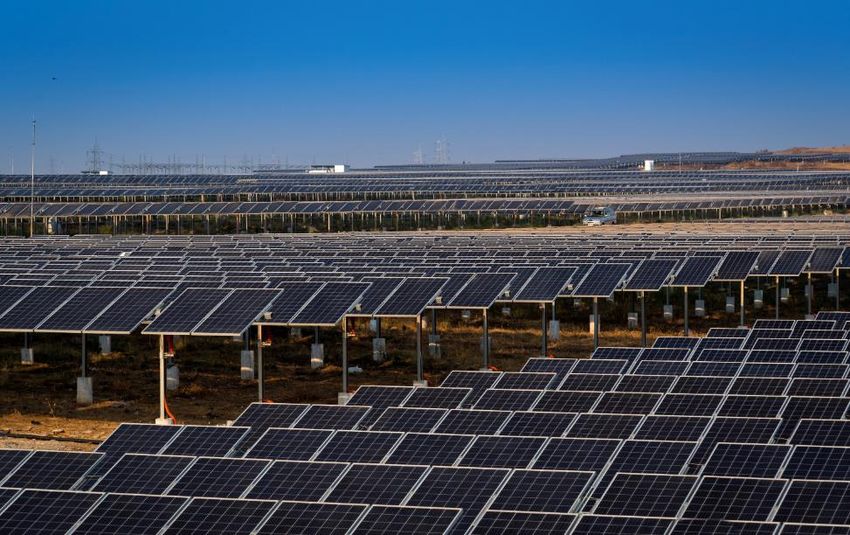
India’s Largest Renewable Energy Company

                 Large Scale                                            9.9 GW Capacity (2)                                        Balanced Asset Mix
 5.6 GW                       #1                            Operational,
 Operating Capacity           Renewable Energy              5.6 GW,
                              Company in India (1)          57%
 US$699mn                                                                                                                  Wind,                                       Solar,
 Revenue FY2021E                                                                                                           5.2 GW,                                     4.7 GW,
                              #10                                                                                          52%                                         48%
                              Renewable Energy
                                                                                                    Committed (2)
                              Company in World (1)                                                  4.3 GW,
                                                                                                    43%

          Disciplined Growth                                             Profitable Growth                                   Access to Diverse Funding
 ~2.8x                         6.2%                          US$578mn                       83% / 85%                     US$2.1bn                      Demonstrated track
 Capacity Growth vs            Market Share of               EBITDA FY2021E                 EBITDA Margin                 Pro forma Equity              record of financing
 Industry Growth of            India’s RE Installed                                         FY2021E / FY2022E             Funding (5)                   via marquee global
                                                                                                                                                        equity investors,
 1.5x (FY2017-21)              Capacity (3)                  US$810mn                                                                                   USD Green Bonds,
                               12%                           EBITDA FY2022E                 28%                           US$4.6bn                      domestic project
 ~3.3x                                                                                      EBITDA CAGR                   Debt Financing                financing and
 Capacity Growth               Market Share in
 (FY2021-25)                   Awarded Auctions (4)          US$1,685mn                     FY2022E-25E                                                 funding from
                                                             EBITDA FY2025E                                               US$1.1bn                      overseas credit
                                                                                                                          Pro forma Cash                institutions

Notes: Fiscal Year End is March 31. Exchange rate (US$/INR): 75
1. Based on operational and committed capacity
2. Committed capacity means projects for which a PPA has been signed for project development, or projects for which the bid has been won and a letter of award has been received
3. Includes 300 MW sold solar assets
4. For the period FY2018-9MFY2021
5. Fx rate as of when the money came in                                                                                                                                          6
INDIA'S PREMIER RENEWABLE ENERGY COMPANY - RENEW POWER
Contents

     India Renewable             Financial
01                     08   03
                            03                         35
     Energy Market               Overview

     ReNew Power:                Transaction Overview &
02
     Key Highlights    13   04
                             4   Valuation Comparables 41
INDIA'S PREMIER RENEWABLE ENERGY COMPANY - RENEW POWER
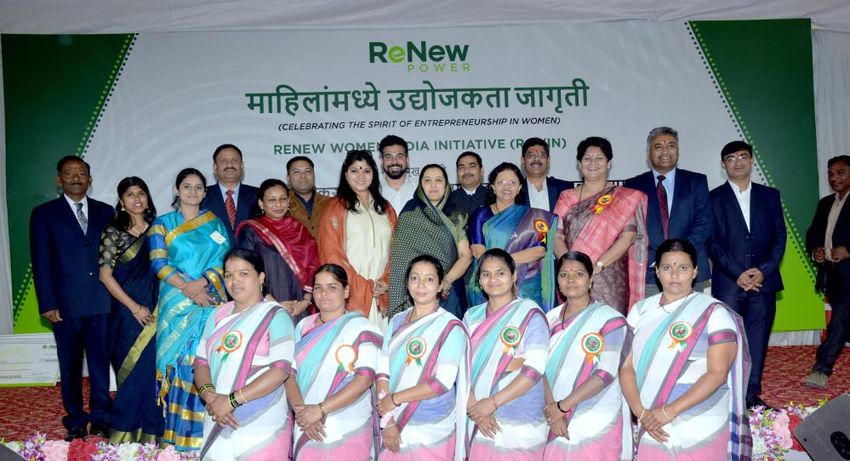
India Renewable
Energy Market
INDIA'S PREMIER RENEWABLE ENERGY COMPANY - RENEW POWER
Key Highlights of India’s Attractive Renewable Energy Market

 1    Third largest electricity market globally

      One of the lowest per capita electricity consumption
 2    in the world, which will drive future demand

      Electricity demand will double in 12 years, most of it
 3    being met from renewable energy

      Renewable Energy tariffs are significantly below
 4    grid parity without subsidies

      Therefore, renewable energy demand to grow 5X in
 5    10 years to 450 GW

                                                               9
INDIA'S PREMIER RENEWABLE ENERGY COMPANY - RENEW POWER
Massive Renewable Energy Opportunity in One of the Fastest
Growing Markets
India’s Electricity Generation Expected to Double in                        India is One of the Largest and Fastest Growing
Next Decade (1)                                                             Renewables Markets Globally (3)
TWh                                                                         Total Renewable Power Capacity (Excluding Large Hydropower) in GW, Dec-20
                                                                   2,172
                                                         1,712
                                                                                                                                    17.3%
                 1,275        1,291                                               539
   1,213                                      1,234

                                                                                           13.3%

                                                                                                    7.4%
   FY18          FY19         FY20            FY21       FY25      FY30
                                                                                                    222
                                                                                                                    4.9%              #4
Electrification Driving Long-Term Growth (2)
                                                                                                                      124
Per Capita Electricity Consumption (kWh)                                                                                              91
                                                                                                                                                        72

    13,017                                                                                                                                   (4)             (5)
                                                                                 China        United States      Germany             India           Japan

                      7,579                                                                         Renewable Generation Growth Rate (2019-2030)
                                      5,941                      Global
                                                      5,268      Average
                                                                  3,300          Share of solar and wind in aggregate electricity
                                                                  1,208      generation in India projected to grow ~3 times from 9.5%
                                                                                             in 2020 to 28.3% in 2030 (3)
 United States        Japan       Germany             China       India
Notes:                                                                     4. Commissioned Capacity as of 31 December 2020 based on Central Electricity Authority.
1. Source: CEA, IHS Markit                                                    Commissioned capacity also includes 15 GW of other Renewable technologies (small
2. Source: IHS Markit                                                         hydro and biomass)
3. Source: Bloomberg NEF                                                   5. Japan’s Renewable Power Capacity from REN21, as of Dec-19

                                                                                                                                                                   10
Utility-Scale Renewable Tariffs are Below Grid Parity Without
Subsidies
Tariffs (¢ / kWh)

         10.5

                                                                         Introduction of                                                   Breaches grid parity
                                                                       competitive bidding

                      6.7                                                                                                                                           (1)
                                   6.5                                 6.4                                                                                    6.4
                                                                                                5.7
                                                                                                                                                                              (2)
                                                                                    4.9                                                                                   4.8
                                                                                                                                                 4.3
                                                                                                                                    3.6

                         FY2014                                                       FY2017                                                  Recent Tenders
                                                          Solar           Wind            Thermal            Firm RE Power

         Drivers for falling solar and wind tariffs include decline in capex, increasing economies of scale and
                        improvement in technology leading to higher capacity utilization factors
Source: Deloitte: The Evolving Energy Landscape in India report for FY2014 tenders; Grid Parity occurs when levelized cost of electricity ("LCOE") for specified technology is less than
or equal to price of power in the grid, IHS Markit for FY2017 and Recent Solar and Wind Tenders
Notes:
1. Based on lowest bid rate for 1320 MW awarded by MP Power Management Company (MPMCL) in 2020
2. Based on levelized tariff of 400 MW of Round-the-Clock (RTC) (with storage) awarded by SECI in 2020. The project has 1,300 MW installed capacity                                    11
Government Target to Add 360 GW by 2030

India’s RE Targets (GW) (1)
                                                                                                                                   1,088

                                                                                                            450

                                                                90

                    16

       Installed Capacity (2010)                   Current Installed Capacity                          Government        International Energy Agency
                                                                                                       Target 2030              Estimate 2040

                         Renewable sector to attract investments of US$ 280bn+ over the next decade (2)

Notes: INR numbers converted to USD at 1 USD = 75 INR
1. Source: MNRE, CEA, International Energy Agency, IHS Markit, Department for Promotion of Industry and Internal Trade
2. Source: Bloomberg NEF

                                                                                                                                                       12
ReNew Power:
Key Highlights
Key Highlights

      One of the Largest Renewable Companies
  1   Globally, with Leadership Position in India

      Stable, Contracted and Diversified Portfolio of
  2
      Assets

      Vertically Integrated IPP with Diverse Execution
  3   Capabilities

      Track Record of Disciplined Project Underwriting
  4
      with Focus on Risk Adjusted Returns

  5   Robust Sustainability and Governance Culture

      High Quality and Experienced Team with
  6
      Consistent Track Record of Success

                                                         14
#1 Utility-Scale, Pure-Play Renewable Power Generation
Company in India and #10 Largest Globally
Largest, Pure-Play Renewable Energy                                           One of The Largest Renewable Energy Producers Globally
Provider in India
Net Capacity in MW (Operational + Late-Stage Pipeline) (1)                     Net Capacity in MW (Operational + late-Stage Pipeline)             (1)

  #1                                                                                                                                        #10
  9.9
                                                                              30.8

             8.2                                                               6.7
  4.3                                                                                24.3

                         6.3                                                          5.5
                                                                                            19.0

                         1.8      4.9
             6.5                                                                             6.1
                                             4.2        4.1                                        13.6
                                                                   3.9                                    12.3 12.0 11.7
                                                                              24.1                 4.0                        10.8 10.4
                                                                   1.2                                    3.1    1.8    1.6                 9.9    9.8
                                  3.5        2.3                                                                                                          8.7
  5.6                                                   2.3                          18.8                                      2.4
                                                                                                                                     3.7                         7.7   7.2
                                                                                                                                            4.3     3.7   1.2                 6.3
                         4.5                                                                                                                                            0.5
                                                                                            12.9                                                                 2.7
                                                                                                   9.7          10.2   10.1                                                   1.8
                                                                   2.7                                    9.2                  8.4
                                                                                                                                     6.6                  7.5           6.7
             1.8                             1.9        1.8                                                                                 5.6     6.1
                                  1.4                                                                                                                            5.0          4.5

                   (2)

Source: IHS Markit
                                                                 Operational               Late Stage Pipeline
Notes:
1. Late-stage pipeline includes projects scheduled to commission in next two years by end CY 2022. Data for operational and late stage pipeline reflects the net ownership of the
   assets. In case, the information about ownership percentage not available, a 100% stake has been assumed. Global players selected basis operational capacity and ranked basis
   operational + late stage pipeline
2. Adani operational capacity excludes 50% share of Total where applicable; late stage pipeline excludes 6 GW expected to be commissioned between 2023 and 2025; recently         15
   announced acquisition of Softbank Energy (yet to close)
Consistent Track Record of Market Share Growth Over Long
Term
ReNew has Successfully Grown its Capacity 2.8x Since FY2017 vs Industry Growth of 1.5x

    FY2012                                     FY2016                              FY2018                             FY2020
    Commissioned 1st                           Started in-house Solar              Acquired Ostro Energy              Started self O&M for wind;
    project with 25.2 MW,                      EPC and O&M                         with a portfolio of 1.1GW          entered innovative
    located in Jasdan                                                              of wind and solar energy           auctions and won SECI
    (Gujarat)                                                                      projects                           Peak Power and RTC bids

                                                                                                                                                     4.3GW      9.9 GW

                                                                                                                                            (2)

                                                                                                              5.9%          6.2%      6.2%
                                                                                                 5.7%
                                                                                                                                              (1)

                                                                                                                         5.4 GW      5.6 GW
                                                                                 3.5%
                                                                                                             4.6 GW
                                                                    2.1%                     3.9 GW
                                    1.1%           1.4%
      0.1%           0.5%
                                                                              2.0 GW
                                                               1.0 GW
                                 0.4 GW         0.5 GW
 0.03 GW         0.1 GW

   FY 12          FY 13           FY 14          FY 15          FY 16          FY 17          FY 18           FY 19       FY 20        FY21         FY22-23E      Total
                                                                                                                                                    Committed   (FY23E)
                         Wind Capacity (GW)             Solar Capacity (GW)                  Share in Installed Renewable Capacity (3)               Capacity

Notes: Solar capacity includes distributed solar
1. Operational capacity as of March 31, 2021
2. Includes 300W sold operating capacity for ReNew
3. Total installed renewable capacity used to calculate market share includes bio-mass and small hydro capacity

                                                                                                                                                                      16
Scale Provides Competitive Edge in Fast Evolving Market

              1   Ability to negotiate favourable terms from OEMs and other suppliers

                  Technical expertise, track record and scale to win complex bids

                  Access to diversified funding sources enhancing cost competitiveness

                  Pan-India presence to identify and execute on potential opportunities

                  Active role in policy development and advocacy

                  Access to data – 5.6 GW operating assets across 110+ sites,
                  experience in hybrid, storage, peak power and RTC solutions

                                                                                          17
Key Highlights

      One of the Largest Renewable Companies
  1   Globally, with Leadership Position in India

      Stable, Contracted and Diversified Portfolio of
  2
      Assets

      Vertically Integrated IPP with Diverse Execution
  3   Capabilities

      Track Record of Disciplined Project Underwriting
  4
      with Focus on Risk Adjusted Returns

  5   Robust Sustainability and Governance Culture

      High Quality and Experienced Team with
  6
      Consistent Track Record of Success

                                                         18
Highly Diversified Portfolio of Assets

ReNew’s Regionally Diversified Utility Portfolio (1)(2) Diversity Across Vendors Reduces Dependence
                                                        and Price Risk (3)
                                                                                                                                  Solar

                                                                                                         Others, 33%                           Longi, 24%

                3,058 MW               100 MW                                                                                                     JASolar, 21%
                                                                                                           Hareon, 7%

                                                                                                                    Jinko, 7%
                                                                                                                                       ZNShine, 7%
          1,346 MW            578 MW

                                                                                                                                  Wind
                     736 MW
                                                                                                                     Others, 15%
                                 560 MW

                                                                                                             Inox, 6%
                     2,485 MW    777 MW
                                                                                                                                                       Gamesa, 36%

                                                                                                           GE, 9%

                              100 MW
                                                     Solar – 4.7 GW

                                                     Wind – 5.2 GW                                          Vestas, 10%

                                                                                                                                         Suzlon, 24%

Notes: As of 31st March, 2021
1. Excludes 300 MW operating solar capacity sold by the company
2. Map includes only operational and committed capacity (does not include distributed solar capacity)
3. Includes operational and under development capacity (ex-distributed solar) for which equipment purchase contracts have been entered into
                                                                                                                                                                     19
Stable and Long-term Contracted Cash Flows with High Quality
Counterparties
Long Term PPAs Provide Stable Cash Flows                                     High Quality Counterparty Mix (2)
                      Contract Duration (1)                                                             Offtaker Profile
                                                                                                                    Others
                         8-20 Years                                                           Private               9%
                            8%                                                                5%
                                                                                     Gujarat
                                                                                     5%
                                                                                Madhya
                                                                                Pradesh
                                                                                                                             Central
                                                                                    6%
                                                                                                                             Agency
                                                                                   Andhra                                    49%
                                                                                  Pradesh
                                                                                      8%

                                                                                      Karnataka
                                                                                         8%
                                            25 Years                                           Maharashtra
                                              92%                                                 10%

   Central government agencies, such as SECI and NTPC, constitute almost 50% of ReNew's counterparties,
              with the remainder comprised of a diversified mix of state level distribution utilities

Notes: As of 31st March, 2021
1. Weighted by capacity
2. Karnataka includes BESCOM, MESCOM, HESCOM and GESCOM; Central Agency includes SECI, NTPC & PTC

                                                                                                                                       20
Government Reform Measures Likely to Reduce Counter-Party
Risk in Future

                             SECI is sponsored by central government of India and has a high credit profile given
                             sovereign support

                             Most of the future RE bids in India will be through SECI, which will minimize any direct
                             counter-party risk from DISCOMs

                             Renew has also been focusing on central bids as is evidenced in increasing share of
                             central projects through the years

                             Central counterparties form 86% of ReNew’s total committed pipeline

 Government is making continued efforts to improve DISCOM health by implementing short, medium
                                     and long- term policies

Short Term                                   Medium Term                                  Long Term

In 2020, the government announced $15        In this year’s budget, the government        Announced structural reforms such as
Bn liquidity package for distribution        announced to set aside $45 Bn over the       DISCOM privatization and content &
companies to clear all outstanding dues of   next 5 years to improve DISCOM               carriage separation which would provide
generators                                   performance by implementing smart            more choice to consumers
                                             meters, reducing operational and financial
                                             losses etc.

                                                                                                                                    21
Key Highlights

      One of the Largest Renewable Companies
  1   Globally, with Leadership Position in India

      Stable, Contracted and Diversified Portfolio of
  2
      Assets

      Vertically Integrated IPP with Diverse Execution
  3   Capabilities

      Track Record of Disciplined Project Underwriting
  4
      with Focus on Risk Adjusted Returns

  5   Robust Sustainability and Governance Culture

      High Quality and Experienced Team with
  6
      Consistent Track Record of Success

                                                         22
Fully Integrated Platform with Comprehensive Project Execution
Capabilities

                                Site Selection   • Access to multiple data sources such as ReNew’s own 116 met-masts         (1)   across 84 sites
                                     and         • Performance data from 5.6 GW of wind and solar operating projects
                                Development      • Visibility on 40,000 acres of land for future development
   Present Across Value Chain

                                   Land          • 22,000 acres of land acquired (2/3rd owned and 1/3rd leased) for existing projects
                                 Acquisition     • 6 regional development offices and 86 site offices to support land development efforts

                                                 • Capability to execute 100% solar and wind EPC in-house; executed 1.8 GW solar in-house
                                  Self EPC       • 440+ team in solar and wind EPC across Design & Engineering, procurement, and project
                                                   execution

                                                 • ~2.4 GW of total operational assets are self-operated across solar and wind
                                Self O&M and
                                                 • Over 340 employees manage 92% of the solar assets in-house; transitioning to in-house
                                    Asset
                                                   self O&M for all wind projects
                                Management
                                                 • Digital capabilities to remotely monitor and undertake maintenance of assets

 Fully integrated platform provides significant cost reduction benefits and superior margins
 50% higher organic execution than the next peer demonstrating its superior project execution capabilities
Note:
1. Met-masts are towers that collect meteorological data including wind speed

                                                                                                                                                     23
Digital Analytics to Manage Projects and Drive Cost Efficiencies

                                                 REMOTE ASSET
    ENERGY MANAGEMENT                                                                 RECOGNITION BY WORLD
                                                MONITORING AND
         SERVICES                                                                       ECONOMIC FORUM
                                                 MAINTENANCE

• Acquired Climate Connect in June      • ReNew Power Diagnostics Centre          • Addition to the World Economic
  2020 to give ReNew access to energy     (RPDC): State-of-the-art facility for     Forum’s Global Lighthouse
  management services                     improving the performance and             network of companies leading in the
                                          reliability of wind and solar assets      area of technology-enabled,
• Climate Connect is a digital
                                                                                    sustainable growth
  analytics, software development, AI   • With 15 member team, ReD Analytics
  and ML company specializing in          Lab helps in:                           • World’s first renewable energy
  Indian power market                     o predicting asset failures               company to be recognized as a
                                          o prioritization of O&M work              Lighthouse by World Economic
                                          o optimization of corrective actions      Forum

                                          o performing real time monitoring

                                                                                                                      24
Pioneering Development of Intelligent Energy Solutions

    FLEXIBLE ON-DEMAND                             STORAGE                                    B2B
          ENERGY                                   SERVICES                                SOLUTIONS

• Round The Clock (RTC) and peak       • Built the largest pipeline of utility   • Corporate PPA market is gaining
  power projects to be mainstay of       scale battery energy storage              traction and is growing; ReNew
  future auctions                        systems in the country                    has ~450 MW of projects with
                                                                                   >150 large corporate customers
• Won the first-ever auction for RTC   • Partnered with Stanford
  project                                University to enhance research
                                         into battery storage solutions
• Committed capacity of 1.7 GW in
  RTC and Peak Power Projects –
  combination of wind, solar and
  storage

     ReNew is staying ahead of the curve in a fast evolving market by focusing on integration of storage
                            into traditional solar and wind renewable sources

                                                                                                                     25
ReNew Continues to Be Focused on Growing Through
Investment Across “Green” Energy Value Chain

        Efficiency                             Core Business                               Who to sell
          Gains               Backward                                   Forward
                             Integration                               integration                Distribution
                              for more                                  to create
                            control over                                more RE
                                                                                          Corporate
                               supply                                    demand
                                                                                            PPAs

   Manufacturing                           Generation - RE & Storage                         Customer
  Future Option

                                                                                     H2
      Value

                                                                        3. New technologies/
                  1. Third-party Digital         2. Third-party O&M
                                                                             Innovation

Three focus areas are:
1 Disciplined growth strategy for new bids and acquisitions
2 Backward integration into our supply chain; and
3 Evaluate entry into future growth areas

                                                                                                            26
Key Highlights

      One of the Largest Renewable Companies
  1   Globally, with Leadership Position in India

      Stable, Contracted and Diversified Portfolio of
  2
      Assets

      Vertically Integrated IPP with Diverse Execution
  3   Capabilities

      Track Record of Disciplined Project Underwriting
  4   with Focus on Risk Adjusted Returns

  5   Robust Sustainability and Governance Culture

      High Quality and Experienced Team with
  6
      Consistent Track Record of Success

                                                         27
Strong Track Record of Disciplined Bidding Focused on
Profitable Growth
Strict Project Underwriting Over the Years Resulting in Compelling Risk Adjusted Returns (1)

Capacity Bid by ReNew

              54.9 GW                                                                                                          Maintaining high level of
                                                           Selective bidding highlights
                                                            disciplined approach and                                         discipline in bidding through
                                                           strong internal underwriting                                        multiple market cycles…
                                                                    thresholds

                                                                                                                              …has enabled ReNew to
                                                                                                                          typically target attractive levered
                                                                                            Strong win rate when           project equity IRRs of 16-20%
                                                                                             ReNew chooses to
                                                                                                 participate                      on an INR basis…

                                                    15.0 GW                                            12%
                                                                                                   Market Share              …and achieved ~40% (2) win
                                                                                                                              rate when participating in
                                                                                           6.5 GW
                                                                                                                                      auctions

          Capacity Bid Out                  Capacity Bid by ReNew                 Capacity Won by ReNew

Notes:
1. Data from FY18-9MFY21. Excludes solar PV manufacturing linked capacity; RTC 400MW bid considered at installed capacity, which is 1,300MW
2. Calculated as capacity won by ReNew divided by capacity bid by ReNew
                                                                                                                                                             28
Key Highlights

      One of the Largest Renewable Companies
  1   Globally, with Leadership Position in India

      Stable, Contracted and Diversified Portfolio of
  2
      Assets

      Vertically Integrated IPP with Diverse Execution
  3   Capabilities

      Track Record of Disciplined Project Underwriting
  4
      with Focus on Risk Adjusted Returns

  5   Robust Sustainability and Governance Culture

      High Quality and Experienced Team with
  6
      Consistent Track Record of Success

                                                         29
ReNew is Leading Energy Transition in India and is Committed
to the Global Sustainable Development Goals
 Partnerships with                                Our ESG Initiatives

                            Environment
                                          • Mapping Scope 1, Scope 2 and Scope 3 emissions
                                          • Achieving “Net Zero” by 2050

                                          • Adopted Dupont Safety Guidelines
 Signatory to
                                          • Benefitting communities in India surrounding our projects
       GRI Sustainability
                                            ‒ Encouraging rural women to become entrepreneurs (ReWIN)
         Imperatives          Social
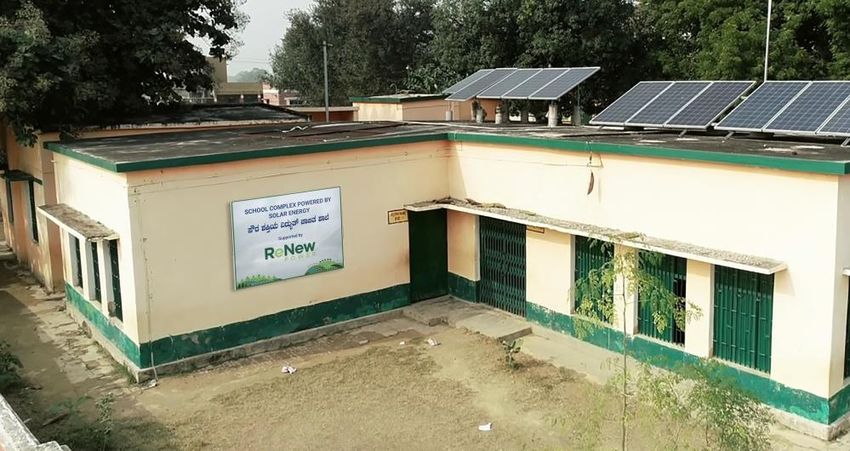
                                            ‒ Electrification of schools (Lighting Lives)
                                            ‒ Scholarship program for under privileged students (ReSET)
                                            ‒ Community-Based Water Management
                                          • Drive policy advocacy through partnerships and programs under
                                            ReNew Foundation

                                 Social

                            Governance
                                          • Strong governance, transparent and ethical operations
                                          • Diverse and majority independent Board
 Plans to
 adopt                                    • Board requirements exceed minimum requirements for FPIs

                                                                                                            30
Impacting Communities with Sustainability Initiatives

    ReNew Women India Initiative (ReWIN)       Lighting Lives – Electrification of Schools

    Community-Based Water Management       ReNew Scholarship for Exceptional Talent (ReSET)

                                                                                             31
Key Highlights

      One of the Largest Renewable Companies
  1   Globally, with Leadership Position in India

      Stable, Contracted and Diversified Portfolio of
  2
      Assets

      Vertically Integrated IPP with Diverse Execution
  3   Capabilities

      Track Record of Disciplined Project Underwriting
  4
      with Focus on Risk Adjusted Returns

  5   Robust Sustainability and Governance Culture

      High Quality and Experienced Team with
  6
      Consistent Track Record of Success

                                                         32
Led by a Visionary Founder and a Highly Experienced
Management Team of ReNew India
                                                                             Lighting Lives – Electrification of Schools

   Sumant Sinha          D Muthukumaran                     Balram Mehta                    Sanjay Varghese          Mayank Bansal
Founder, Chairman and       Chief Financial                 Chief Operating                  President, Solar    Chief Commercial Officer
         CEO                    Officer                         Officer
     10      31               2        29                      10       26                         4   21                3      21

  Kailash Vaswani           Vaishali N. Sinha                  Ajay Bhardwaj                  Garima Garg        Col. Pushkar Prasad
 President, Corporate   Chief Sustainability Officer               President,                 Interim CHRO      President, Regional Affairs
       Finance          & Chair, ReNew Foundation                 New Business                                        Development

      10      19                  10        24                      3        36                    1   16               8       29

                                                 Years at ReNew              Years of Experience

                                                                                                                                              33
Updates Since Business Combination and PIPE Announcement
Successfully Secured US$855mn in PIPE Commitments in Feb-21

                                                     Update on 9MFY21
            Commissioning of                                                            Potential Impact of 2nd Wave of
                                                (Dec-20) Financials and Bond
            515 MW Capacity                                                                COVID-19 on Operations
                                                          Issuances
                                               • Revenue: $526mn; EBITDA:
 • 300 MW Wind project: PPA with                 $444mn; Margin: 84%(1)
                                                                                        • ReNew prudently revised their CoD
   SECI
                                                                                          dates of committed projects due to
                                               • On track to achieve FY21
                                                                                          anticipated delays on account of
 • 105 MW Solar Project: PPA with                projections of $699mn revenue and
                                                                                          COVID
   Gujarat DISCOM                                $578mn EBITDA
                                                                                        • No material impact on the financial
 • 110 MW Solar Project: PPA with              • Issued US$585 MM USD green
                                                                                          projections
   SECI                                          bonds in Apr-21 at 4.5% coupon, 7
                                                 year tenor

                                                                                            Recognized as a Global
    Import Tariffs Announced on
                                               Focused on Employee Welfare              Lighthouse by World Economic
           Solar Modules
                                                                                                   Forum

                                                                                        • First renewable energy company in
  • GoI announced import tariffs of 40%
                                               • Organised two vaccination drives for     the world to be recognised as a
    on solar modules and Production
                                                 all employees & their families           Lighthouse
    Linked Incentive (PLI) scheme to
    promote domestic manufacturing
                                               • ReNew will also reimburse the cost     • Recognized for adoption of 4 IR
                                                 of vaccines for its employees and        technologies to achieve growth that
  • ReNew is setting up 2GW module
                                                 their immediate family                   is not only profitable, but also
    and cell manufacturing facility
                                                                                          sustainable

Note: FY represents fiscal year end March 31                                                                                    34
1. Excludes finance income
Financial
            3
Overview    5
Track Record of Efficient Capital Raise from Diverse Sources of
  Funding

   Outstanding Funding (31-Dec-20) (1)                                                         Raised US$3bn+ in Bond Offerings Through 7
                                                                                               USD Bond Offerings at Competitive Rates
                                                                                                                                                 Reduction in
                                                                                                                  6.67%                          cost of debt
                                                                                                                            6.45%                  1.71%
                                Working Capital Loan                                                   6.00%
                      INR Bonds        0.5%                                                                                           5.88%
                        12.9%                                          (2)
                                                    Equity
                                                                                                         Weighted average cost of debt: 5.38%
                                                    23.0%
                                                                                                                   6.25% (4)
                                                                                                                                                                      4.50%
                                        Total
                                                                                                                                                  Weighted average
                                      Funding:                                                                                                   cost of debt: 4.54% (4)
                                       $6.1bn                      Secured Bank Loan
                                                                                                                                                          4.00%
                                                                         11.1%
Senior Overseas Green
              (3)
        Bonds                                                                                          Feb'17 Mar'19 Sep'19 Jan'20              Oct'20    Feb'21      Apr'21
        34.0%                                                                                             Coupon Rate (%)               Weighted Average Cost of Debt
                                                  Secured Loan from FIs
                                                         18.5%                                 Size       475      525       300       450        325       460        585
                                                                                               ($mn)
                                                                                               Tenor
                                                                                                          5.0    4.5-5.0      3.0       7.0       3.5       6.0        7.25
                                                                                               (yrs)

        USD bonds are hedged                                                                      Ability to refinance existing debt at lower interest cost,
                                                                                                    longer tenor, top-ups to release liquidity and less
        USD bonds are rated BB- by S&P, BB-/ BB by Fitch
                                                                                                    onerous restricted payment conditions
         and Ba3 by Moody’s
                                                                                                   Increases liquidity for financing capex of new projects
        Corporate rating of Ba2 by Moody’s
        Local rating (CARE) of A1+ for short term debt and A+
         for long term
   Notes:                                                                                    3. Senior USD Green Bonds stated based on the actual USD amount raised
   1. Assumes 1 USD = 75 INR                                                                 4. Weighted by issue size                                                         36
   2. Includes Compulsory Convertible Preference Shares. Based on actual USD amount raised
18 GW Capacity by FY25 Through Organic and Inorganic Growth

Installed Capacity
(In GW)

                                                                                                                                                        18.1

                                                                                                                                       14.6

                                                                                                              12.0
                                                                                                                                                         8.2
                                                                                                               2.1                      4.7
                                                                                      8.2
                                                                                      0.9
                                   5.4                      5.6
          4.6
                                                                                                               9.9                      9.9              9.9
                                                                                      7.3
                                   5.4                      5.6
          4.6

        FY19                      FY20                     FY21                     FY22                     FY23                     FY24              FY25

                                           Committed           New Bids & Acquisitions                  Incremental Bids & Acquisitions

     Installed capacity is existing operational projects + capacity of committed projects + ReNew’s current estimates of its ability
      to win wind and solar projects in future auctions and acquisitions
     Long runway of capacity growth in India from 90 GW to 450 GW
     Implied market share (1) of ~10% by FY25
Note: FY represents fiscal year end March 31
1. Total installed renewable capacity for FY2025 calculated basis annual growth rate of 17.4% (CAGR to achieve 450GW by 2030 from 90 GW as of Nov-20)
                                                                                                                                                               37
Strong Revenue Growth and Stable Margins

Revenue (1)
(In $mn)
                               In line with FY21                                                       1,954
                                   projections
                                                                                       1,653
                                                                      1,325                              654          19% growth in capacity in FY20 offset by
                                                                                        349
                                                       950             217                                             lower tariffs on new projects
     619             682              699                      45
                                                                                       1,304           1,300          FY21E revenue growth impacted by low
                                                       905            1,108                                            wind PLFs, offset by increase in solar
     619             682              699
                                                                                                                       power generation
    FY19            FY20             FY21             FY22       FY23         FY24                     FY25
                                    Committed           New Bids & Acquisitions
EBITDA (2)
(In $mn)

    87%              83%             83%              85%              86%              86%             86%

                                                                                                       1,685
                                                                                       1,425                          Decrease in FY20 EBITDA margin was due
                                                                      1,135                             563            to lower PLF
                                                                                        297
                                                      810              182
                     567              578                                                                             In-house O&M and EPC, cost efficiency
     536                                                       37
                                                                                       1,128           1,122           and digitalization measures will drive
                                                      773              953
     536             567              578                                                                              EBITDA margins to ~86%

   FY19          FY20               FY21      FY22          FY23                      FY24             FY25
                        (2)
              Committed                New Bids & Acquisitions                           EBITDA Margin

Notes: FY represents fiscal year end March 31; INR numbers converted to USD at 1 USD = 75 INR
1. Revenue and EBITDA figures do not include interest income. EBITDA does not include non-cash expenses such as amortization of USD bond hedging costs
2. EBITDA from committed assets is net of corporate overhead

                                                                                                                                                                38
Stable Net Leverage Expected to be Maintained at 5.3-5.6x

Capital Expenditure and Leverage
(In $mn)

                                                                                                 2,310           2,290
                                                          7.1x
                                                                                                         1,837
                                                                                1,597
        6.3x                     6.3x

         816
                                                                                                 5.6x
                                  524                                              5.5x
                                                          430
                                                                                                         5.3x    5.3x

       FY19                     FY20                     FY21                     FY22           FY23    FY24    FY25

                                                                             Net Debt / EBITDA

                                                         75 – 80% capex funded through debt

 Capex is based on the anticipated expenditure to be incurred to achieve the CoD, or the expected purchase price for
  acquired capacity
 USD green bonds have bullet repayments and are assumed to be refinanced prior to maturity, while other loans are
  expected to amortize in line with long tenor of PPAs
 Amortizing debt assumes back-end heavy amortization (typical in renewable project finance)
 Note: FY represents fiscal year end March 31; INR numbers converted to USD at 1 USD = 75 INR

                                                                                                                         39
RECAP: ReNew is the Leading Renewable Energy Player in a
Rapidly Growing Market

            Renewables are the mainstay of electricity growth in India – most economical and
   1        fastest growing

            ReNew with 9.9 GW committed capacity, diversified, and high quality portfolio is
   2        the largest renewable energy company in the country and one of the largest globally

            End-to-end project value chain capabilities with site selection, land development,
   3        in-house EPC, O&M and asset management capabilities coupled with digitalization
            driving cost efficiencies and superior margins

            Strong capital base with ~US$2.1bn equity raised to date (1) and US$4.6bn
   4        financing across debt markets

            Well positioned to execute on integrated and intelligent energy solutions
   5
            and services

   6        Superior growth and strong margins

   7        At the forefront of environment, sustainability and governance

            High quality and experienced management and board with strong track record of
   8        delivering superior returns and performance for its stakeholders

Note:
1. Including US$700 MM primary raised in business combination with RMG II
                                                                                                  40
Transaction
Overview and
Valuation
Comparables

               41
Transaction Overview and Valuation

Overview
• Transaction will be funded by $345mn of RMG II cash held in trust and up to $855mn in PIPE
  proceeds
• Post-closing company is anticipated to be listed on the NASDAQ and retain its ReNew Power name
• Primary proceeds will be used to fund attractive near-term growth and reduce leverage
• Transaction expected to complete by early Q3 2021

Valuation
• Transaction reflects a $4,370mn post-money equity valuation for ReNew, representing a highly
  attractive opportunity to invest in a leader in renewable energy
   – ReNew to receive up to $610mn cash at closing which, together with its expected cash balance of
     $730mn (1), will be used to fund attractive near-term growth opportunities and reduce leverage
• $7,846mn Enterprise Value (1)

    Compelling entry multiple of 9.7x EV / FY2022E EBITDA relative to median peer multiple of 18.8x
                                     (at transaction announcement)
Source: Peer company public filings, and FactSet
Note:
1. Pro forma as of March 31, 2021, assuming $4,816mn of exiting debt, $730mn of cash on balance sheet and up to $610mn of primary proceeds

                                                                                                                                             42
Overview of RMG II Management Team

Highly Experienced RMG II Management Team                         RMG Acquisition Corp. II Overview
           Jim Carpenter                                          • RMG Acquisition Corp. II (“RMG II”) is NASDAQ listed SPAC
           Chairman
                                                                    which completed its $345mn IPO on December 14, 2020
           • Founder and CEO of Riverside
             Management Group
                                                                  • RMG II management team has significant public company
           • Former CEO of Horsehead Industries
                .                                                   board experience (NYSE, NASDAQ, and TSX)
           • Co-Founder of Mohegan Energy
           • Founding Investor & Board Member of                  • The team consummated a business combination with Romeo
             Allied Resource Corp.
                                                                    Power (NYSE: RMO) in December 2020 through RMG
                                                                    Acquisition Corp (RMG I), a NYSE listed SPAC which
                                                                    completed its IPO in February 2019
           Bob Mancini
                                                                  • Supported by Riverside Management Group, a leading
           CEO and Director
           • Former Partner, Founder & Co-Head of Power             merchant bank with ~25 years of experience in M&A advisory
             Investment Business at Carlyle (NASDAQ:CG)             and principal investing
           • Former Managing Director of Goldman Sachs
             (NYSE:GS)
           • Co-Founder & Head of Power Investment

                                                                  RMG II’s Due Diligence Conducted on ReNew
             Business, Founder & Head of Commodities
             Principal Investment Business at Goldman
             Sachs (NYSE:GS)
           • Chairman of the Board of Romeo Power, Inc.
             (NYSE: RMO)                                          • General corporate, employment matters and benefits,
           • Former Chairman & CEO of Cogentrix Energy
                                                                    legal, litigation and potential claims, intellectual property,
                                                                    environmental health and safety, contract review, real
           Phil Kassin
                                                                    estate and joint venture capital structure due diligence
           President, COO and Director
           • Former Senior Managing Director of Evercore            performed by
             (NYSE:EVR)
           • Former Head of M&A & Financing at Access             • Technical due diligence performed by
             Industries
           • Former Board Member and Chairman of the Finance
             & Investment Committee at LyondellBasell             • Accounting and Tax due diligence performed by
             (NYSE:LYB)
           • Senior investment banking roles at Morgan Stanley,   • Business and financial due diligence completed by
             Goldman Sachs, Merrill Lynch and AIG
           • Board Member of Romeo Power, Inc.
             (NYSE: RMO)

                                                                                                                                     43
~70% of Post-Transaction Shareholding Held by Existing
Shareholders
Pre-Transaction Shareholding                                                       Post-Transaction Economic Shareholding
%                                                                                  % at Closing (2)
                                  Employees and
Founder Entities                  ex-employees                                                                                         (1)
6.1%                              0.0%                                                                           Management ESOPs
                                                                                                                 0.8%
                                                                           (1)
 GEF SACEF                                            Management ESOPs
 2.9%                                                 1.0%
                                                                                             PIPE Investors
                                                                                             19.8%                                               GS
            JERA                                                                                                                                 32.3%
            8.0%

                                                                                    Current SPAC
                                                                                    Public Share-
                                                                GS                  holders
    ADIA                                                        46.5%               8.0%
    17.6%
                                                                                     RMG
                                                                                     2.0%
                                                                                     Founder Entities
                                                                                     3.6%

                                                                                     GEF SACEF                                               CPPIB
                                                                                     2.0%                                                    12.5%
                       CPPIB                                                                                            ADIA
                       17.8%                                                          JERA                              12.3%
                                                                                      6.6%

                                                                                                          ~28% free float upon listing

Notes:
1. Management and employee ESOPs includes ESOPs exercisable within 60 days of closing
2. Secondary share split among shareholders is: Sumant ($62mn), GS ($242mn), CPP ($92mn), ADIA ($90mn), and GEF ($14mn). Assumes GS, ADIA and CPP Investments CCPS is
   exchanged into ReNew Global shares. Does not account for warrants dilution
                                                                                                                                                                  44
Structural Overview

                                               Existing
                                             Shareholders

 Existing    Offshore
 Structure   India
                          Founder and     ReNew Power Private
                        GS and CPP CCPS     Limited (“RPPL”)

                 SPAC Sponsor &                Existing             New
                    Investors                Shareholders       PIPE Investors

 Proposed                                       NewCo
 Structure
             Offshore

             India

                          Founder and
                                                RPPL
                        GS and CPP CCPS

                                                                                 45
ReNew’s Financial Profile is Superior Compared to Public
Comparables
      ReNew             Indian Peer                                  European Peers                                                    North American Peers
 Revenue Growth (2020-2023 CAGR)       (1)(2)

                                                                                                         72.1%

      24.9%                                                      25.6%                                                        28.1%
                13.8%     16.1%                 10.7%                                                                                                          11.5%
                                                                                     6.3%                                                      7.3%

 EBITDA Growth (2020-2023 CAGR)       (1)(2)

                                                                                                         39.4%
      26.2%
                          22.6%                                  21.6%
                11.8%                                                                11.7%                                    12.0%                             9.0%
                                                5.4%                                                                                           5.3%

 2021E EBITDA Margin
                                                                                                                              100.6%
      82.7%                                     83.6%            84.8%                                                                         88.4%
                77.1%
                          69.2%                                                                                                                                70.6%
                                                                                                         54.5%
                                                                                     40.8%

                                                                                                                                                              Peer Median
Source: ReNew Company data, public company filings and FactSet as of May 14, 2021
Notes:
1. ReNew and Azure metrics based on fiscal year end March 31; metrics for other peers represent fiscal year end December 31
2. Renew & Azure metrics shown as FY2020-2023 (April 2019 – March 2023)

                                                                                                                                                                        46
Peer Valuation Benchmarking – Highly Attractive Valuation
Compared to Peers
                                                                                                  Equity Value for Comparable Indian Platforms
 • Robust demand in public markets for renewable energy companies, particularly those                                              Capacity                 Equity Value
    with exposure to large addressable markets and enormous growth opportunities                    Company
                                                                                                                                    (MW)                     (US$ mm)
 • While multiples have traded down recently, longer term multiples will support
    significant upside potential in value                                                                                           7,019                     22,367 (3)
 • Potential to trade at a premium to peer multiples given leadership position in the                                               6,048                      5,750 (4)
    region supplemented by scarcity value of high-quality listed players from India
                                                                                                                                    9,863                       4,370

 Current NTM EV/EBITDA Multiples (1)
                                                                                                                                                                    19.7x
                                                                 17.4x              16.5x              16.1x
              14.9x                          13.1x                                                                         13.8x
                          10.8x                                                                                                                11.1x
       9.7x

    At $10 p.s
 1 Year Average NTM EV/EBITDA Multiples (2)                                         20.1x                                                                           20.2x
                                                                 17.5x
              14.9x                                                                                    15.5x
                                             13.7x                                                                         14.4x
                          13.2x
                                                                                                                                               11.7x
       9.7x

    At $10 p.s
                                                                                                                                                                 Peer Median
Source: Renew Company data, public company filings and FactSet as of May 14, 2021
Notes:
1. Based on EBITDA for NTM period starting May 14, 2021                                3. Adani Green’s market capitalization as of May 14, 2021
2. Represents average daily NTM EV/EBITDA over one year period                         4. Equity value for Greenko in the recently announced minority investment transaction with
   ending May 14, 2021                                                                    Orix Corp (source: Greenko Press Release)
                                                                                                                                                                               47
Thank you
For Further Inquiries Please Contact

Investor Contact
IR@renewpower.in
Anunay.Shahi@renewpower.in

                                       48
You can also read