INFLAMMATORY BIOMARKERS, BRAIN VOLUMETRIC MRI, FDG-PET RESULTS IN PATIENTS WITH TYPE 2 DIABETES IN AZELIRAGON PHASE 3 TRIAL IN MILD ALZHEIMER'S ...

Page created by Judith Carpenter
 
CONTINUE READING
INFLAMMATORY BIOMARKERS, BRAIN VOLUMETRIC MRI, FDG-PET RESULTS IN PATIENTS WITH TYPE 2 DIABETES IN AZELIRAGON PHASE 3 TRIAL IN MILD ALZHEIMER'S ...
INFLAMMATORY BIOMARKERS, BRAIN VOLUMETRIC MRI, FDG-PET
  RESULTS IN PATIENTS WITH TYPE 2 DIABETES IN AZELIRAGON
      PHASE 3 TRIAL IN MILD ALZHEIMER’S DISEASE (AD)
    Carmen Valcarce, Imogene Dunn, Tom Soeder, Aaron Burstein
INFLAMMATORY BIOMARKERS, BRAIN VOLUMETRIC MRI, FDG-PET RESULTS IN PATIENTS WITH TYPE 2 DIABETES IN AZELIRAGON PHASE 3 TRIAL IN MILD ALZHEIMER'S ...
Disclosure

Carmen Valcarce
Full time employees of vTv Therapeutics LLC
INFLAMMATORY BIOMARKERS, BRAIN VOLUMETRIC MRI, FDG-PET RESULTS IN PATIENTS WITH TYPE 2 DIABETES IN AZELIRAGON PHASE 3 TRIAL IN MILD ALZHEIMER'S ...
Targeting RAGE with Azeliragon

• Azeliragon’s novel MOA: antagonizing the Receptor                                                                                                                   Azeliragon Mechanism of Action
  for Advanced Glycation Endproducts (RAGE)                                                                                                                                                           Azeliragon binds to RAGE,
                                                                                                                                                   Select ligands bind to RAGE                      blocking ligands from binding
   •RAGE is expressed at low levels in healthy tissues
    (except skin and mucus membranes)                                                                                                                                                                        to receptor

   •Increases in the concentration of RAGE ligands
    induce RAGE expression
              • In AD, increases in RAGE protein and percentage of
                RAGE-expressing microglia parallel the severity of
                disease
   •The interaction of AGEs (or other RAGE-ligands) with
    RAGE leads to:                                                                                                                                                                 RAGE                                             RAGE
              • Sustained cellular damage and inflammation; and
              • Insulin resistance
                                                                                                                                                                                    Tau
• Unlike most investigational AD treatments,                                                                                                   Ab
                                                                                                                                           accumulation                        phosphorylation       Ab
                                                                                                                                                                                                                                    Tau
                                                                                                                                                                                                                               phosphorylation
  azeliragon does not rely on just one hypothesis (e.g.,                                                                                                                                         accumulation
  amyloid or tau), but it targets several components                                                                                        Metabolic                             Cytokine
                                                                                                                                           dysregulation                        release and       Metabolic                        Cytokine
  of AD pathology                                                                                                                                                Vascular      inflammation      dysregulation
                                                                                                                                                                                                                  Vascular
                                                                                                                                                                                                                                 release and
                                                                                                                                                                dysfunction                                                     inflammation
                                                                                                                                                                                                                 dysfunction
                                                                                                                                                                   Amyloid b            S100              AGEs            HMGB1
  For review see Dhananjayan et al. (2018) Advance Glycation, Diabetes and Dementia https://doi.org/10.1016/B978-0-12-809454-9.00009-3

March 2019                                                                                                                               vTv Therapeutics LLC                                                                               3
INFLAMMATORY BIOMARKERS, BRAIN VOLUMETRIC MRI, FDG-PET RESULTS IN PATIENTS WITH TYPE 2 DIABETES IN AZELIRAGON PHASE 3 TRIAL IN MILD ALZHEIMER'S ...
RAGE Involved in Diabetic Complications and AD

                                               Pre-clinical Evidence with Azeliragon Treatment
                                            Animal model               Main Results: Treatment with Azeliragon
                          Retinal Disease
                                            Rat Diabetic Retinopathy   Protection Against Vascular and Neuronal Lesions:
                                                                       • Reduces acellular capillaries and improves
                          Kidney Disease                                   pericyte/endothelial cell ratio
   Diabetes

                                                                       • Reduces activated microglia
              AGEs/        Stroke           Adriamycin Induced Mouse   Protection from the Development of Massive Albuminuria,
              RAGE                          Nephropathy model          Mesangial Expansion and Glomerular Sclerosis
                           Dementia
                                            Alzheimer’s disease        •   Reduces amyloid deposition and inflammation in the
                                            Transgenic Mouse model         brain
                          Cardiovascular    (human APP Swedish and     •   Increase Glucose Uptake in the brain
                                            London mutations)          •   Preserves cognitive/ behavioral function

                          Neuropathy        C57BLKS/J-m+/+Lepr db      Dose related decrease in wound closure time and % closure
                                            mice (Lepr db)             at all doses
                          Wound Healing

March 2019                                   vTv Therapeutics LLC                                                           4
INFLAMMATORY BIOMARKERS, BRAIN VOLUMETRIC MRI, FDG-PET RESULTS IN PATIENTS WITH TYPE 2 DIABETES IN AZELIRAGON PHASE 3 TRIAL IN MILD ALZHEIMER'S ...
Phase 3 STEADFAST Study Design

                                                                               Two Pivotal Studies
                                                                               Under One Protocol
                                                                        5mg/day azeliragon (AZL) or
                                                                     Placebo (PBO) + Standard of Care
                    A-Study                                                                                                      B-Study
                405 Patients
                                                            Patients with probable mild AD, MMSE 21-26, CDR                     475 Patients
             Readout April 2018                                                global 0.5-1                                     Terminated
                                                                 Co-Primary Endpoints: ADAS-cog11 and CDR-SB
                                                              Co-Primary Endpoints to be analyzed as independent studies

                                                          Secondary Endpoints: MRI volumetric measures, FDG-
                                                               PET, functional / behavioral measures, etc
                                                                      Secondary Endpoints to be analyzed as one study

                                                              Patients with diabetes were included in the study
                    A-Study                                                                                                      B-Study
                                                                                (HbA1c ≤7.7%)
         47 Patients HbA1c≥6.5%*                                                                                           47 Patients HbA1c≥6.5%*
                                                                                                                                  Terminated

*At any time during the study; referred to as ADA-T2D subgroup throughout the presentation
March 2019                                                                                   vTv Therapeutics LLC                                    5
INFLAMMATORY BIOMARKERS, BRAIN VOLUMETRIC MRI, FDG-PET RESULTS IN PATIENTS WITH TYPE 2 DIABETES IN AZELIRAGON PHASE 3 TRIAL IN MILD ALZHEIMER'S ...
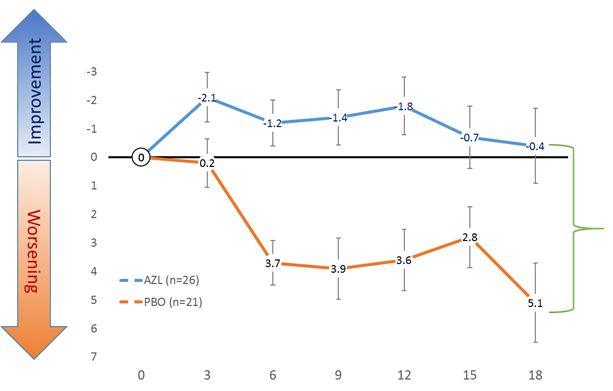
Potential Beneficial Effect on Cognition in Patients with Elevated
       HbA1c
                               STEADFAST A-Study (FAS)                                                       STEADFAST A-Study ADA-T2D Subgroup (FAS)
                  Change from Baseline in ADAS-cog11 (LSMEANS)                                                      Change from Baseline in ADAS-cog11 (LSMEANS)

                                                                                                                                                            p=0.752#

                                                                                                                                                                         ∆=5.5
                                                                                                                                                                        p=0.006#

                                                                                                                                                            p=0.0006#

   Results are LSMeans ± SE based on MMRM model. AD-T2D=HbA1c ≥6.5% at anytime during the study. #All p values are nominal. FAS =Full Analysis Set

March 2019                                                                                   vTv Therapeutics LLC                                                          6
INFLAMMATORY BIOMARKERS, BRAIN VOLUMETRIC MRI, FDG-PET RESULTS IN PATIENTS WITH TYPE 2 DIABETES IN AZELIRAGON PHASE 3 TRIAL IN MILD ALZHEIMER'S ...
Potential Beneficial Effect on Cognitive Function in Patients with
       Elevated HbA1c
                               STEADFAST A-Study (FAS)                                                           STEADFAST A-Study ADA-T2D Subgroup (FAS)
                               Change from Baseline in CDR-SB                                                                       Change from Baseline in CDR-SB

                                                                                                                                                                      p=0.053#

                                                                                                                                                                           ∆=1,1
                                                                                                                                                                          p=0.16#

                                                                                                                                                                     p=0.0005#

     Results are LSMeans ± SE based on MMRM model. AD-T2D=HbA1c ≥6.5% at anytime during the study. #All p values are nominal. FAS =Full Analysis Set

March 2019                                                                                       vTv Therapeutics LLC                                                            7
INFLAMMATORY BIOMARKERS, BRAIN VOLUMETRIC MRI, FDG-PET RESULTS IN PATIENTS WITH TYPE 2 DIABETES IN AZELIRAGON PHASE 3 TRIAL IN MILD ALZHEIMER'S ...
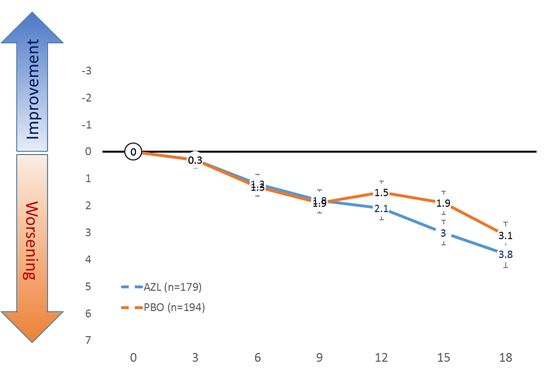
Cognitive Improvement Cannot be Explained by Improvement in
       Glycemic Control

                STEADFAST A-Study ADA-T2D Subgroup (FAS)                                                             STEADFAST A-Study ADA-T2D Subgroup (FAS)
                                  Change in HbA1c (%) at Month 18                                                       Change in Non-fasting Glucose (mg/dL) at Month 18
                          0.1                                                                                               15

                        0.08                                                                                                10
                        0.06
                                                                                                                             5
                        0.04

                        0.02                                                                                                 0
                            0
                                                                                                                             -5
                       -0.02

                       -0.04                                                                                                -10

                       -0.06
                                                                                                                            -15
                       -0.08

                         -0.1                                                                                               -20
                                                   AZL (n=26)       PBO (n=21)                                                            AZL (n=26)   PBO (n=21)

    • Stable therapy was required throughout the study
    • Insulin was not allowed
   AD-T2D=HbA1c ≥6.5% at anytime during the study. Results are Means ± SE ,FAS = Full Analysis Set
March 2019                                                                                           vTv Therapeutics LLC                                                   8
Demography and Baseline Characteristics:
       No Notable Imbalance Between Treatment Arms
                    STEADFAST Study ADA-T2D Subgroup                          STEADFAST Study ADA-T2D Subgroup
                   Demographics (A&B Studies Combined)                  Baseline Characteristics (A&B Studies Combined)

   AD-T2D=HbA1c ≥6.5% at anytime during the study

March 2019                                               vTv Therapeutics LLC                                             9
Change in MRI Brain Volume at Month 18 in the ADA-T2D Subgroup:
   Trend Towards Less Brain Atrophy in the AZL-treated Group
                                                                                                    ADA-T2D Subgroup                                                                    ADA-T2D Subgroup
           ADA-T2D subgroup
                                                                                                                                                                                    Change in Total Hippocampus
    Change in Whole Brain volume (%)                                                            Ventricular Enlargement (%)                                                                 Volume (%)
                     0                                                                           0.6                                                                                   0

                                                                                                 0.5                              p=0.0008 #
                  -0.5                                                                                                                                                             -0.005

                                                                                                                                                                        Decrease
    Decrease

                                                                                                 0.4
                    -1                                                                                                                                                              -0.01

                                                                                                 0.3

                                                                                     Increase
                  -1.5                                                                                                                                                             -0.015
                                                                                                 0.2

                    -2                             p=0.0002#                                                                                                                        -0.02
                                                                                                 0.1                                                                                                               p=0.004#

                                           P=0.015
                  -2.5                                                                             0                                                                               -0.025

                              AZL (n=41)          PBO (n=35)                                                AZL (n=41)         PBO (n=35)                                                    AZL (n=41)         PBO (n=35)

    AD-T2D=HbA1c ≥6.5% at anytime during the study.**Results are change from baseline LSMeans ± SE ANCOVA adjusted for baseline, FAS. # 1-sample test nominal significance indicating worsening. All p values are nominal

March 2019                                                                                                    vTv Therapeutics LLC                                                                                            10
Change in FDG-PET SUVR in the ADA-T2D Subgroup:
       Less Reduction in Glucose Utilization in AZL-treated Group
                                                              Month 12                                                                               Month 18
                                                         0                                                          0

                                                      -0.01                                                    -0.01
             Change from Baseline in SUVR (LSMeans)

                                                      -0.02                                                    -0.02

                                                      -0.03                                                    -0.03
                                                                                p
Inflammatory Marker Panel: Changes at Month 18 of Treatment
         in ADA-T2D Subgroup
     •    Inflammatory biomarkers were measured in plasma using LincoPlex system and the human cytokine/chemokine full panel (panel
          1, Millipore)
     •    No notable differences between placebo and azeliragon at baseline
     •    Statistically meaningful differences between azeliragon and placebo for changes from baseline in select inflammatory markers

                               Baseline (pg/mL)                                                Change from Baseline (%)

   AD-T2D=HbA1c ≥6.5% at pre-dose
March 2019                                                        vTv Therapeutics LLC                                                   12
Changes in Biomarker Profile Consistent with RAGE Inhibition

                                                                                            Biomarker Profile

                                                                              Azeliragon treatment significantly decreased
                                                                              the following markers linked to RAGE:
                                                                                • IL6
                                                                                • IL12
                                                                                • INFg
                                                                                • CD40L
                                                                                • MIP-1
                                                                                • IL2
                                                                                • TNFb

                                                                              Each of these markers is a major player in the
                                                                              neuroinflammatory pathway1

  *nominal p
Data from the ADA-T2D Subgroup and Prediction Using Ingenuity Software Support
Hypothesis that Inhibition of RAGE Could Result in Beneficial Effects

March 2019                              vTv Therapeutics LLC                     14
Conclusions
 ❑   Results from the post-hoc analysis of a subgroup of patients with HbA1c≥6.5% support
     the hypothesis that treatment with azeliragon may:
    ▪   Improve/preserve cognition and function
    ▪   Reduce Whole Brain and Hippocampus atrophy and ventricular enlargement
    ▪   Preserve glucose uptake

 ❑   The results from the inflammatory marker analyses revealed changes consistent with
     RAGE inhibition, possibly indicating functional pharmacologic activity of azeliragon in this
     subgroup of patients

 ❑   Further clinical studies are necessary to confirm this hypothesis:
    ▪   vTv is Initiating start-up activities for a study to evaluate the safety and efficacy of azeliragon in subjects
        with mild AD and type 2 diabetes (HbA1c ≥6.5%)
        ― Part 1: Objective is to demonstrate efficacy on a cognitive endpoint and establish proof of concept
        ― Part 2: To be initiated upon positive results from Part 1. Objective is to demonstrate efficacy on co-primary
             endpoints of cognition and function

March 2019                                                   vTv Therapeutics LLC                                         15
Thank you!

             We greatly appreciate all the patients, families, investigators and staff for
                                their participation in STEADFAST
March 2019                                     vTv Therapeutics LLC                          16
You can also read