Economic Evaluation of Climate Change Impacts and Adaptation in the United States
←
→
Page content transcription
If your browser does not render page correctly, please read the page content below
Economic Evaluation of Climate Change Impacts
           and Adaptation in the United States:
             Comparing Models and Methods

                             Jim McFarland (US EPA)
                                      Collaborators
Mei Yuan (MIT), Elodie Blanc (MIT), John Reilly (MIT), Jeremy Martinich (US EPA), Marcus
Sarofim (US EPA), Jameel Alsalam (US EPA), Allen Fawcett (US EPA), James Neumann (IEc),
       Jacqueline Willwerth (IEc), Gary Yohe (Wesleyan Univ.), James Rising (LSE)

                                   WiNDC Meeting
                                      April 24, 2020

                                                                                           1
Outline

   • Models and methods

   • Climate impacts in general equilibrium

   • Research extensions

   • Database developments
                                              Disclaimer: Views expressed in
                                              presentation do not necessarily
                                              represent those of the U.S. EPA.
                                                                            2
Models and Methods
Objectives of the study
 • Introduce bottom-up sectoral climate impacts into a CGE model: MIT’s U.S. Regional
   Energy Policy Model (USREP)
 • CGE models provide an consistent accounting and structural framework to
   • evaluate impacts to the broader economy of sectoral shocks
   • examine the interactions across sectors
 • Initial phase (this talk)
   • Disaggregate USREP from 12 to 29 regions and extend years from 2050 to 2100
   • Introduce median climate impacts from the Climate Impacts Lab (i.e., Hsiang et. al.) for
     three impacts: labor, agriculture, and heat mortality
   • Examine the magnitude and incidence of the climate damages within the USREP model

                                                                                                4
Economy-Wide Climate Impact Analyses
• US - Climate Impacts Lab / American Climate Prospectus
• RHG-MUSE model
• 7 sectors: labor, heat mortality, coastal, energy, agriculture, crime
• Economy-wide impacts are 50% greater than direct damages
• Heat mortality treated as lost labor
• EU - JRC PESETA I, II, III
• Static implementation in GEM-E3
• 6 sectors: labor, heat mortality, coastal, inland flooding, ag
• Focus on 2 degrees (2030-2040)
• EU GDP loss ~2%, half coming from heat mortality VSL
• Global - OECD Circle Project
• ENV-Linkages model
• Global analysis to 2060
• Crop yields and labor supply impacts lower GDP by 0.9% and 0.8%
Source: Hsiang et al. Science 2017
5Methodology: applying impacts from Hsiang et al.
• Apply median results from
several RCP’s, primarily RCP 8.5
and RCP 4.5 for 3 shocks
• Labor: productivity shock
introduced as an adjustment to
labor supply. Low-risk labor
applied to services sector.
• Agriculture: productivity shock High-risk Labor (0.5% to -3%) Low-risk Labor (0.5% to -3%)
introduced as adjustment to
total output (i.e., not land).
Impact applied across all crops
weighted by output
• Heat Mortality: shock
introduced as a reduction in the
labor/leisure endowment of the
representative agent
Agricultural yields (+45 to -99%) Mortality (chng deaths per 100k -60 to +80)
Median climate damages for RCP8.5 averaged over 2080-2099.
Source: excerpt from Figure 2, Hsiang et al., Science 2017 6Caveats and Limitations
• Initial foray looks only at median impacts and does not explore the distribution of
impacts across the climate models.
• Adaptation to heat mortality in underlying study is more limited than that reported in
recent research, which may inflate the mortality losses. However, the value of
statistical life is kept constant (i.e., does not rise the GDP), which understates the
losses.
• Decreased cold mortality reported in Hsiang et al. was not found to be significant in a
separate work published as part of the CIRA study.
• A single, aggregated agricultural sector masks differential impacts on particular crops
and cannot represent important interactions in the sector (e.g., substitution between
crops and livestock).
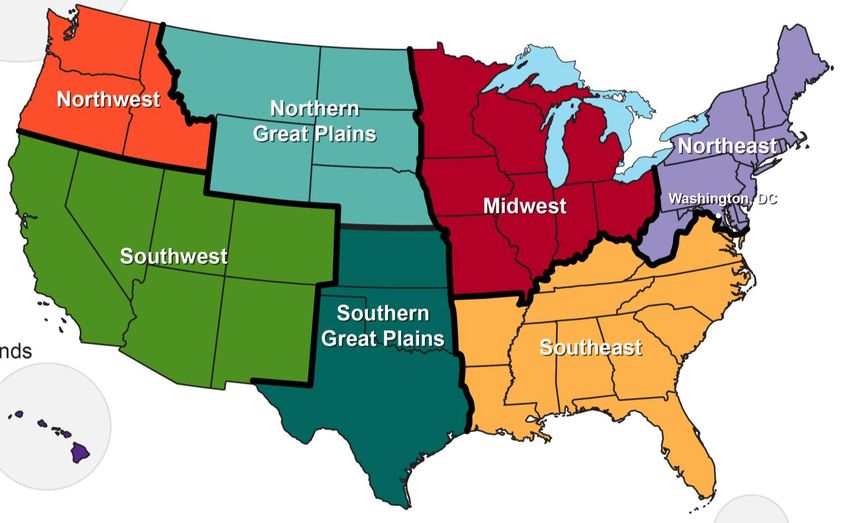
7US National Climate Assessment Regions
• Results reported at national and
NCA region levels
8Regional Input Shocks and GDP Output for RCP8.5 in 2100
Regional input shock by sector and
change in GDP (output)
• Heat mortality exhibits a difference in
sign and magnitude between the
northern and southern regions.
• The agricultural productivity shock is
strongly negative in the Midwest and
Southeast. The Northwest, and to a lesser
extent the Southwest, experience a
positive shock.
• The labor productivity shock is quite
small in comparison to the other shocks
in percentage terms.
9
Preliminary results. Not for citation or quotation.Climate Impacts
Regional impacts on Consumption and GDP
 • In 2100 under RCP 8.5, labor productivity                     Change in consumption and GDP in 2100
   losses lower consumption by almost $1.7                       for RCP 8.5
   trillion (2.5%) and GDP by $2.7 trillion
   (2.9%).
 • Agricultural impacts lower consumption
   and GDP by $200 billion (0.3%) and $500
   billion (0.5%) , respectively.
 • Heat mortality effects lower consumption
   by $400 billion (0.6%), but have much less
   of an effect on GDP.
 • When all impacts are introduced
   simultaneously, the consumption effects
   are less than the sum of the separate
   effects. GDP is roughly additive.

                                Preliminary results. Not for citation or quotation.                      11
Regional impact differences across RCPs
• Impacts are substantially lower under
RCP 4.5 than RCP 8.5 with some regional
variation.
• Impacts across the Northwest, Northern
Great Plains, and Northeast are minimal
under RCP 4.5.
• The impacts in the Midwest, Southwest,
and Southeast are reduced by roughly
50%.
• Reductions in the Southern Great Plains
are only 30%.
Preliminary results. Not for citation or quotation. 12Impact on Sectoral output by region with “All” shocks
• The largest impacts in absolute terms, in
2100 under RCP 8.5 are in Services, Other
Industries, Energy Intensive Industries,
and Agriculture.
• Services, Other Industries, and Energy
Intensive Industries all use significant
intermediate inputs which makes them
more susceptible to the labor productivity
shock.
• The aggregate national effects on output
miss important regional shifts.
• Positive effects on output in some
northern regions for agriculture, energy
intensive, and other industries.
Preliminary results. Not for citation or quotation. 13Extensions
Extension 1 – Introduce sectoral impacts covered in CIRA
• Introduce detailed sectoral
  impacts from bottom-up
  models into USREP.
• Detailed bottom-up,
  sectoral data enables
  improved representation in a
  CGE framework
  • Break-out of impacts by
    inputs (e.g., capital, labor,
    and energy) is possible.
  • This is particularly relevant
    for coastal adaptation which
    requires substantial capital
    investment to mitigate
    losses.                                Many important impacts are not included in
                                           the modeling framework. Future work will
  • Spatial detail only limited by         expand and deepen the sectors covered.
    bottom-up model.
                                                           ** internal *
                                                           deliberative*

                                                                                        15
Extension 2 – Introduce damages from reduced-form models
• Reduced-form damage functions were developed for 15 CIRA sectors based on CIRA 2.0 results at the NCA-region
level as functions of temperature, precipitation, population, and GDP.
• Publication forthcoming in REEP: “Climate damage functions for estimating the economic impacts of climate change in the United States” by
Neumann, Wilwerth, Martinich, McFarland, Sarofim, and Yohe.
• Projected damages were developed for three end-of-century temperature targets (1.5, 3.0, and 4.5 C) for median, 5th
and 95th moments to capture uncertainty in climate system and damage functions.
Trajectories of Global Mean Temperatures Estimated Economic Damage Uncertainty
(Yohe 2017 Climatic Change) Range - Labor Sector in S. Grt Plains Region
(Neumann et al forthcoming REEP)
16Database developments
• State-level GHG emissions consistent with national inventory
• 1990 to present
• Non-CO2 GHG Marginal Abatement Cost Curves
• Projections and Abatement Curves to 2050
• Potential areas:
• Agriculture
• Forestry
17Contact:
Jim McFarland
mcfarland.james@epa.gov
18You can also read