Influence of Different Segmentations on the Diagnostic Performance of Pericoronary Adipose Tissue
←
→
Page content transcription
If your browser does not render page correctly, please read the page content below
ORIGINAL RESEARCH
                                                                                                                                                 published: 03 March 2022
                                                                                                                                           doi: 10.3389/fcvm.2022.773524

                                             Influence of Different Segmentations
                                             on the Diagnostic Performance of
                                             Pericoronary Adipose Tissue
                                             Didi Wen 1† , Rui An 1† , Shushen Lin 2 , Wangwei Yang 3 , Yuyang Jia 1 and Minwen Zheng 1*
                                             1
                                              Department of Radiology, Xijing Hospital, Fourth Military Medical University, Xi’an, China, 2 Siemens Healthineers Ltd.,
                                             Shanghai, China, 3 Department of Cardiology, Xijing Hospital, Fourth Military Medical University, Xi’an, China

                                             Objective: To investigate the influence of different segmentations on the diagnostic
                                             performance of pericoronary adipose tissue (PCAT) CT attenuation and radiomics
                                             features for the prediction of ischemic coronary artery stenosis.
                                             Methods: From June 2016 to December 2018, 108 patients with 135 vessels were
                                             retrospectively analyzed in the present study. Vessel-based PCAT was segmented
                                             along the 40 mm-long proximal segments of three major epicardial coronary arteries,
                                             while lesion-based PCAT was defined around coronary lesions. CT attenuation and
                           Edited by:
                                             radiomics features derived from two segmentations were calculated and extracted.
                 Giuseppe Signoriello,
          University of Campania Luigi       The diagnostic performance of PCAT CT attenuation or radiomics models in
                         Vanvitelli, Italy   predicting ischemic coronary stenosis were also compared between vessel-based and
                     Reviewed by:            lesion-based segmentations.
                       Jiayin Zhang,
    Shanghai General Hospital, China         Results: The mean PCAT CT attenuation was −75.7 ± 9.1 HU and −76.1 ± 8.1 HU
                         Lisheng Xu,
                                             (p = 0.395) for lesion-based and vessel-based segmentations, respectively. A strong
       Northeastern University, China
                                             correlation was found between vessel-based and lesion-based PCAT CT attenuation
               *Correspondence:
                    Minwen Zheng             for all cohort and subgroup analyses (all p < 0.01). A good agreement for all cohort
       zhengmw2007fmmu@163.com               and subgroup analyses was also detected between two segmentations. The diagnostic
     † These authors have contributed        performance was comparable between vessel-based and lesion based PCAT CT
    equally to this work and share first     attenuation in predicting ischemic stenosis. The radiomics features of PCAT based
                            authorship
                                             on vessel or lesion segmentation can both adequately identify the ischemic stenosis.
                    Specialty section:       However, no significant difference was detected between the two segmentations.
          This article was submitted to
                                             Conclusions: The quantitative evaluation of PCAT can be reliably measured both from
              Coronary Artery Disease,
                a section of the journal     vessel-based and lesion-based segmentation. Furthermore, the radiomics analysis of
  Frontiers in Cardiovascular Medicine       PCAT may potentially help predict hemodynamically significant coronary artery stenosis.
      Received: 10 September 2021
                                             Keywords: pericoronary adipose tissue, pericoronary adipose tissue CT attenuation, radiomics analysis, ischemic
       Accepted: 10 February 2022
                                             coronary artery stenosis, fractional flow reserve
         Published: 03 March 2022

                            Citation:
Wen D, An R, Lin S, Yang W, Jia Y and
 Zheng M (2022) Influence of Different
                                             INTRODUCTION
    Segmentations on the Diagnostic
Performance of Pericoronary Adipose
                                             Vascular inflammation is a driver of coronary atherosclerotic plaque formation and also a typical
                              Tissue.        feature of atherosclerotic plaque rupture (1). Patients with coronary artery disease (CAD) have
  Front. Cardiovasc. Med. 9:773524.          histological evidence of local inflammation both within culprit lesions and throughout the entire
     doi: 10.3389/fcvm.2022.773524           coronary vascular bed (2). Coronary computed tomography angiography (CCTA) is a widely

Frontiers in Cardiovascular Medicine | www.frontiersin.org                           1                                             March 2022 | Volume 9 | Article 773524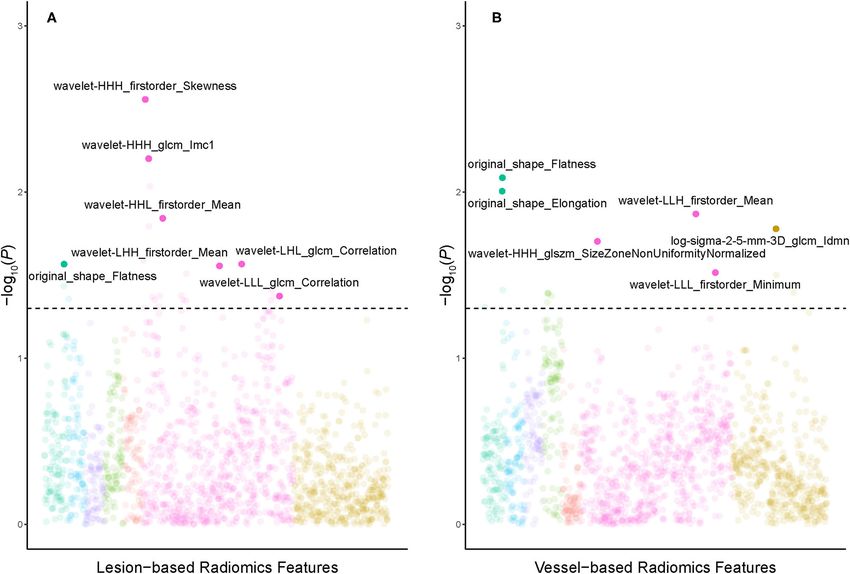
Wen et al.                                                                                                 PCAT Assessment With Different Segmentations

used non-invasive modality for the diagnosis of CAD. Recent               TABLE 1 | Patients characteristics.
research demonstrated that signals released from the inflamed
                                                                          Characteristics                                            Overall (n = 108)
coronary artery diffuse to the perivascular adipose tissue,
inhibiting local adipogenesis. Such an inflammatory response              Age, mean (SD), years                                           59 ± 10
changes the composition of perivascular adipose tissue around             Male, n (%)                                                   78 (72.2%)
inflamed arteries, shifting its attenuation on CCTA from the              Body mass index, mean (SD), kg/m2                             24.8 ± 2.9
lipid [more negative Hounsfield unit (HU) values (e.g., closer            Risk factors, n (%)
to −190 HU)] to the aqueous phase [less negative HU values                  Diabetes mellitus                                           11 (10.2%)
(e.g., closer to −30 HU)]. The changes in pericoronary adipose              Hypertension                                                54 (50.0%)
tissue (PCAT) attenuation can be non-invasively measured                    Hyperlipidemia                                              38 (35.2%)
using routine CCTA, and enable early detection of vascular
                                                                            Current smoker                                              45 (41.6%)
inflammation in coronary arteries. The relationship between
                                                                          CACS, Agatston                                            188.8 (54.1–398.12)
PCAT and coronary atherosclerosis has been studied by several
                                                                          Interval between ICA and CCTA, mean (SD), days                   9±6
authors, including its link with plaque composition, vulnerability,
and hemodynamic significance (3–6). Moreover, higher PCAT                 CACS, coronary artery calcium score; CCTA, coronary computed tomography
CT attenuation was revealed to be associated with an increased            angiography; ICA, invasive coronary angiography; SD, Standard deviation.

risk of cardiac mortality and poor prognosis (7). The importance
of PCAT radiomics features in cardiac risk prediction was
also revealed by Oikonomou et al. (8). However, the area                  Image Acquisition and Analysis
of PCAT measurement in different studies was inconsistent.                All CCTA scans were performed on a second generation
Among previous studies, the majority investigated PCAT in the             128-slice dual source CT (Somatom Definition Flash, Siemens
proximal 40-mm segment of all three major epicardial coronary             Healthineers, Forchheim, Germany) with retrospectively
vessels [right coronary artery (RCA), left anterior descending            electrocardiogram-triggered spiral acquisition. The detailed
artery (LAD), and left circumflex artery (LCX)] (5, 7, 9–11)              scanning parameters are specified in Supplementary Appendix.
or one of the coronary arteries (RCA or LAD) (2–4, 8, 12–                 Plaque characterization was performed using dedicated plaque
16). Some studies suggested that a lesion-specific assessment             analysis software (Coronary Plaque Analysis, version 5.0.0,
of PCAT might provide greater insight into atherosclerotic                Siemens Healthineers, Germany). Coronary artery calcium
biology than the proximal segments of the major arteries alone            score was calculated on gated non-contrast CT using the
(6, 17). To resolve this inconsistency, this study aimed to               Agatston method.
clarify whether a proximal 40 mm assessment or a lesion-specific
assessment was more appropriate in the evaluation of PCAT. Our            ICA and FFR Measurement
secondary objective was to compare the diagnostic performance             Selective ICA was performed by standard catheterization
of PCAT CT attenuation and radiomics features between two                 in accordance with the American College of Cardiology
segmentations for the prediction of hemodynamically significant           recommendations for coronary angiography (18). FFR was
coronary artery stenosis.                                                 measured using a 0.014-inch pressure sensor tipped guidewire
                                                                          (Pressure Wire, St. Jude Medical Systems, St. Paul, Minnesota)
                                                                          as previously described (19). Hyperemia was induced with
                                                                          intravenous continuous infusion (160 µg/kg/min) of adenosine
METHODS
                                                                          (20). Intracoronary nitroglycerin was administered immediately
Study Patients                                                            before measurement of FFR. FFR ≤0.80 was indicative of
This retrospective study complied with the Helsinki Declaration           hemodynamically significant stenosis.
(2000). From June 2016 to December 2018, 191 consecutive
patients with suspect CAD who underwent CCTA, invasive                    PACT Analysis
coronary angiography (ICA), and fractional flow reserve (FFR)             To measure PCAT CT attenuation, 3-dimensional layers within
examination were retrospectively screened from our institution’s          radial distance from the outer coronary wall equal in thickness
database. All patients gave written informed consent, and the             to the average diameter of the vessels were constructed
study protocol was approved by the institutional review board             automatically from the CCTA (Figure 1) using semi-automated
of Xijing Hospital affiliated with the Fourth Military Medical            software (Perivascular Analysis function, Coronary Plaque
University (KY20194007). Exclusion criteria were previous                 Analysis, version 5.0.0, Siemens Healthineers, Germany). Within
revascularization (n =47), normal angiograms in CCTA (n = 1),             the predefined volume of interest, voxels with tissue attenuation
the interval between CCTA and FFR measurement > 1 month (n                ranging from −190 HU to −30 HU were defined as PCAT
= 28) and poor CCTA image quality (n =7). Additionally, vessels           (7). Two cardiovascular radiologists (with 8- and 10-years of
with total occlusion (n = 8) and normal angiogram (n = 5) were            experience in cardiac imaging) who were blinded to ICA and
further excluded (Supplementary Figure S1). Finally, 135 lesions          FFR results, independently performed the PCAT segmentation.
in 108 patients (mean age, 59 years ± 10; range, 30 ∼ 77 years,           On a per vessel level, PCAT segmentation was performed around
78 males and 20 females) were analyzed. Details of the patients’          the 40 mm-long proximal segments of LAD, LCX, and RCA. To
characteristics were shown in Table 1.                                    avoid the effects of the aortic wall, we excluded the most proximal

Frontiers in Cardiovascular Medicine | www.frontiersin.org            2                                           March 2022 | Volume 9 | Article 773524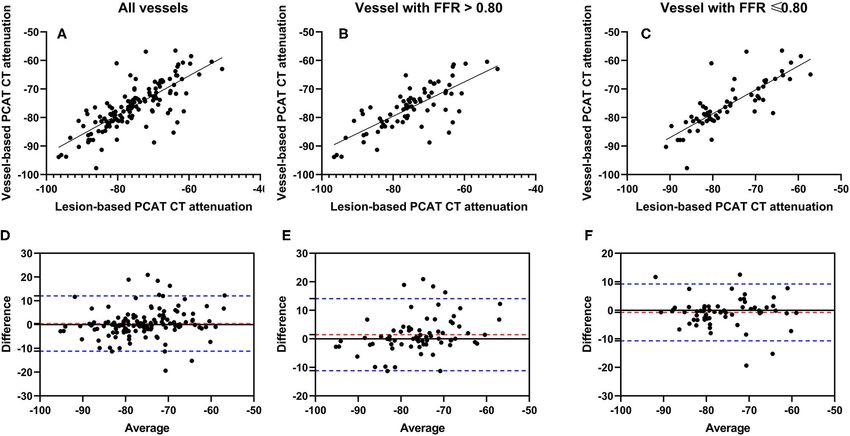
Wen et al. PCAT Assessment With Different Segmentations
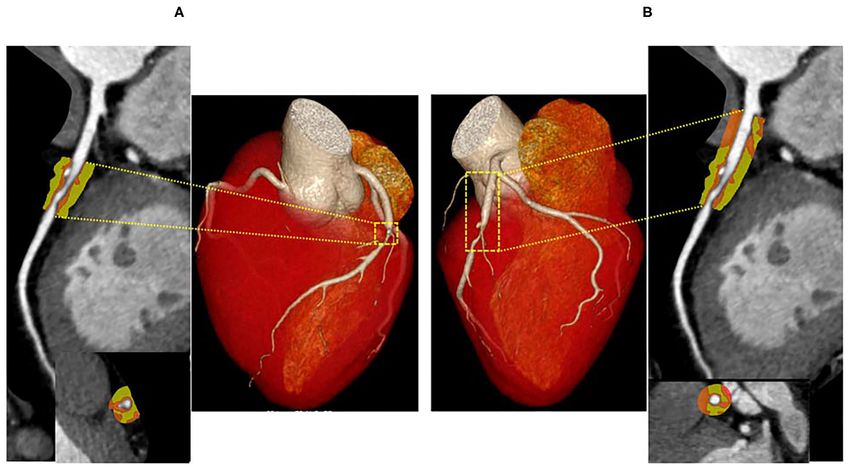
FIGURE 1 | Representative CCTA image of PCAT around LAD. A hemodynamically significant stenosis (FFR = 0.73) in the middle segment of LAD. PCAT CT
attenuation was defined as the mean CT attenuated value within a radial distance equal to the diameter of the vessel. The length of the lesion-based PCAT was
defined from the proximal to the distal shoulder of the lesion (A), the vessel-based PCAT was focused on the proximal 40-mm segments of all three major epicardial
coronary vessels (10 to 50 mm from right coronary artery ostium) (B). LAD, left anterior descending artery; PCAT, pericoronary adipose tissue.
10 mm of RCA and analyzed the proximal 10–50 mm of the vessel Radiomics Models Construction
(7). In LAD and LCX, we did not analyze the left main coronary Eligible lesions were randomly split into a training (60%) and a
artery because of its variable length. Given that previous studies testing set (40%), in order to identify optimal radiomics features
(6, 17) have shown PCAT surrounding lesions to be a potential extracted from different PCAT segmentations and to further
sensor of ischemic stenosis, lesion-based PCAT segmentation was validate their association with hemodynamic status of coronary
also performed around coronary lesions on a per lesion level. The artery stenosis. Univariate logistic regression was conducted in
lesion causing the highest-grade stenosis on each coronary vessel the training dataset to initially screen out radiomics features
was chosen for PCAT analysis, and the length of the lesion-based irrelevant to hemodynamic outcome by creating Manhattan
PCAT was defined from the proximal to the distal shoulder of plots. Based on a pre-defined statistical significance of p < 0.05,
the lesion. PCAT CT attenuation was defined as the mean CT features above the threshold of 1.301 (–log10 based) remained
attenuation in the adipose tissue. for more rigorous selection. The least absolute shrinkage and
selection operator (LASSO) with logistic regression was used to
separately select the ideal combination of features from lesion-
based and vessel-based PCAT. Finally, 10-fold cross validation
Radiomics Analysis was applied to determine the optimal lambda value, which was
Lesion- and vessel-based PCAT segmentations were loaded
fed into the prediction model in order to discern dichotomized
into a stand-alone software prototype (Radiomics, version
hemodynamic significance.
1.2.2, Siemens Healthineers, Germany), which extracted
radiomics features via PyRadiomics library. A total of 1,691
features were calculated for each segmentation, including Statistical Analysis
17 shape, 18 first-order and 75 texture features in the Continuous variables are presented as mean ± standard
original images. High-dimensional radiomics features were deviation and categorical variables as frequencies (percentages).
calculated through pre-processing, which multiplied first- The interobserver agreement for PCAT CT attenuation was
order and texture features through Laplacian of Gaussian determined with the intraclass correlation coefficient (ICC).
(LoG) filtering, wavelet filtering, and non-linear intensity Pearson correlation coefficient was calculated for assessment
transforms (Supplementary Table S1). of the relationship of vessel-based and lesion-based PCAT CT
Frontiers in Cardiovascular Medicine | www.frontiersin.org 3 March 2022 | Volume 9 | Article 773524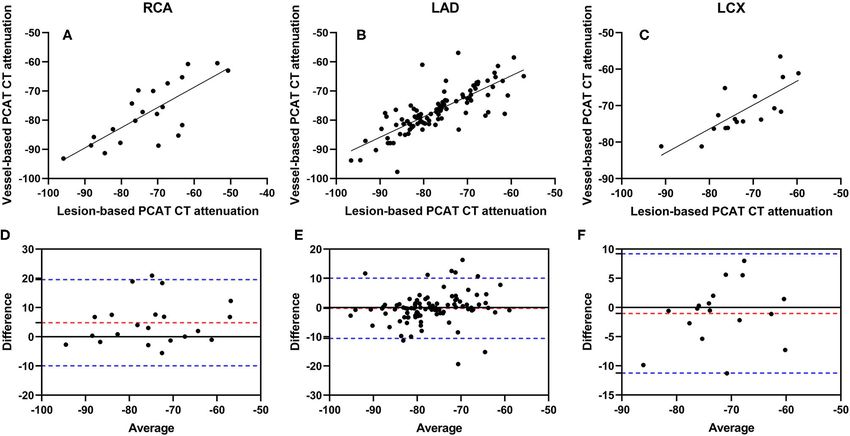
Wen et al.                                                                                                                       PCAT Assessment With Different Segmentations

TABLE 2 | Lesion characteristics in coronary computed tomography angiography.

Variables                                                Overall (n = 135)                    FFR > 0.80 (n = 72)                     FFR ≤ 0.80 (n = 63)                        p

DS (%), mean (SD)                                           61% ± 19%                              59% ± 21%                               64% ± 17%                          0.084
Lesion localization, n (%)                                                                                                                                                    0.000
  LAD                                                        97 (71.8%)                            39 (28.9%)                               58 (43.0%)
  LCX                                                        17 (12.6%)                            15 (11.1%)                                2 (1.5%)
  RCA                                                        21 (15.6%)                            18 (13.3%)                                3 (2.2%)
Lesion territory                                                                                                                                                              0.046
  Proximal                                                   76 (56.3%)                            47 (34.8%)                               29 (21.5%)
  Middle                                                     33 (24.4%)                             12 (8.9%)                               21 (15.6%)
  Distal                                                     26 (19.6%)                             13 (9.6%)                               13 (9.6%)
Lesion length, mean (SD), mm                                26.2 ± 12.3                            23.2 ± 11.5                             29.6 ± 12.4                        0.002
MLA, mean (SD), mm2                                           3.5 ± 2.4                             4.0 ± 2.7                               2.9 ± 1.7                         0.007
Total plaque volume (mm3 )                                 223.4 ± 191.1                         214.7 ± 182.8                            233.3 ± 201.0                       0.452
  Calcified plaque volume (mm3 )                           76.8 ± 111.84                          70.4 ± 109.1                            84.0 ± 115.3                        0.519
  Fibrotic plaque volume (mm3 )                            139.4 ± 94.41                          136.7 ± 91.4                            142.5 ± 98.3                        0.685
  Lipid plaque volume (mm3 )                                 7.2 ± 12.4                             7.7 ± 13.3                              6.8 ± 11.4                        0.654
PCAT CT attenuation, mean (SD), HU
  Lesion-based segmentation                                 −75.7 ± 9.1                            −75.1 ± 9.9                             −76.3 ± 8.3                        0.463
  Vessel-based segmentation                                 −76.1 ± 8.1                            −76.1 ± 7.9                             −75.5 ± 8.5                        0.453

DS, diameter stenosis; FFR, fractional flow reserve; LAD, left coronary artery; LCX, left circumflex; MLA, minimal lumen area; PCAT, pericoronary adipose tissue; RCA, right coronary
artery; SD, Standard deviation.

 FIGURE 2 | Correlation and Bland-Altman plots of vessel-based and lesion-based PCAT CT attenuation as clarified by invasive FFR. Pearson correlation analyses
 show the correlation vessel-based and lesion-based PCAT CT attenuation in all vessels (A), vessels with FFR > 0.80 (B) and vessels with FFR ≤0.80 (C), respectively.
 Bland-Altman plots show PCAT CT attenuation between vessel-based and lesion-based in all vessels (D), vessels with FFR >0.80 (E) and vessels with FFR ≤0.80
 (F). The red dotted lines represent the mean difference (bias), and the blue dotted lines represent the 95% limits of agreement. FFR, fractional flow reserve; PCAT,
 pericoronary adipose tissue.

attenuation in the entire cohort as well as sub-group analysis.                              created assuming a parametric distribution, and 1-sample t-
Bland-Altman plots were created comparing vessel-based and                                   tests were run to detect any significant fixed bias. Diagnostic
lesion-based PACT CT attenuation. Confidence limits were                                     performance of PCAT radiomics features was assessed with

Frontiers in Cardiovascular Medicine | www.frontiersin.org                               4                                                March 2022 | Volume 9 | Article 773524
Wen et al.                                                                                                           PCAT Assessment With Different Segmentations

 FIGURE 3 | Correlation and Bland-Altman plots of vessel-based and lesion-based PCAT CT attenuation in different coronary arteries. Pearson correlation analyses
 show the correlation vessel-based and lesion-based PCAT CT attenuation in RCA (A), LAD (B) and LCX (C), respectively. Bland-Altman plots show PCAT CT
 attenuation between vessel-based and lesion-based in RCA (D), LAD (E) and LCX (F). The red dotted lines represent the mean difference (bias), and the blue dotted
 lines represent the 95% limits of agreement. LAD, left anterior descending artery; LCX, left circumflex artery; PCAT, pericoronary adipose tissue; RCA, right
 coronary artery.

receiver operating characteristic (ROC) curve analysis, and                          lesion-based measurement, and −76.1 ± 8.1 HU for vessel-
the DeLong test was used to compare the area under the                               based measurement (p = 0.395) (Table 2). A strong significant
curves (AUCs). Statistical analysis was performed using MedCalc                      correlation was observed between vessel-based and lesion-based
version 11.4.2 (MedCalc Software, Mariakerke, Belgium) and                           PCAT CT attenuation (r = 0.7686, p < 0.0001) in the entire
R, version 3.6.3 (R Foundation for Statistical Computing,                            cohort (Figure 2A), as well as sub-group analysis [r = 0.7540,
Vienna, Austria). A 2-tailed value of p < 0.05 was considered                        p < 0.0001 for vessels with FFR > 0.80 (Figure 2B) and r =
statistically significant.                                                           0.8166, p < 0.0001 for vessels with FFR ≤ 0.80 (Figure 2C)]. A
                                                                                     Bland-Altman analysis comparing lesion-based and vessel-based
                                                                                     PCAT CT attenuation showed the following mean differences:
RESULTS                                                                              0.4356 (95% limits of agreement: −11.18 to 12.05) in all vessels
                                                                                     (Figure 2D), 1.467 (−11.16 to 14.09) for vessels with FFR >0.80
Lesion Characteristics                                                               (Figure 2E) and −0.743 (−10.70 to 9.212) for vessels with FFR
Lesions were most often present in LAD (71.8%), followed by
                                                                                     ≤0.80 (Figure 2F), respectively.
RCA (15.6%) and LCX (12.6%). Among the 135 lesions, 76
                                                                                         Pearson correlation coefficients of vessel-based and lesion-
(56.3%) lesions were located in the proximal of coronary artery,
                                                                                     based PCAT CT attenuation were as follows: RCA: r = 0.7649
33 (24.4%) lesions in the middle segment and 26 (19.3%) lesions
                                                                                     (p = 0.0001) (Figure 3A), LAD: r = 0.7921 (p < 0.0001)
in the distal segment. Moreover, 103 (76.3%) lesions with stenosis
                                                                                     (Figure 3B), and LCX: r = 0.7656 (p = 0.0003) (Figure 3C).
≥50% were detected, and 63 (46.7%) lesions were considered
                                                                                     The difference between vessel-based and lesion-based PCAT
ischemic stenosis according to FFR (FFR ≤ 0.80) (Table 2). The
                                                                                     CT attenuation in RCA was 4.821 (95% limits of agreement:
mean lesion length was 26.2 ± 12.3 mm.
                                                                                     −9.928 to 19.57) (Figure 3D), −0.2577 (−10.56 to 10.05) in LAD
                                                                                     (Figure 3E), and −1.026 (−11.25 to 9.195) in LCX (Figure 3F).
PCAT CT Attenuation                                                                  Furthermore, a good correlation and agreement of vessel-based
PCAT CT attenuation on lesion-based and vessel-based                                 and lesion-based PCAT CT attenuation was found regardless of
segmentation had excellent interobserver reproducibility with                        lesion locations (Supplementary Figure S2).
ICC of 0.921 and 0.984 in all vessels, 0.918 and 0.982 in vessels                        There was no significant difference in PCAT CT attenuation
with FFR >0.80, and 0.932 and 0.991 in vessels with FFR ≤0.80.                       between vessels with FFR >0.80 and FFR ≤0.80 regardless of
The mean PCAT CT attenuation was −75.7 ± 9.1 HU for                                  the segmentation method (vessel-based p = 0.453; lesion-based

Frontiers in Cardiovascular Medicine | www.frontiersin.org                       5                                            March 2022 | Volume 9 | Article 773524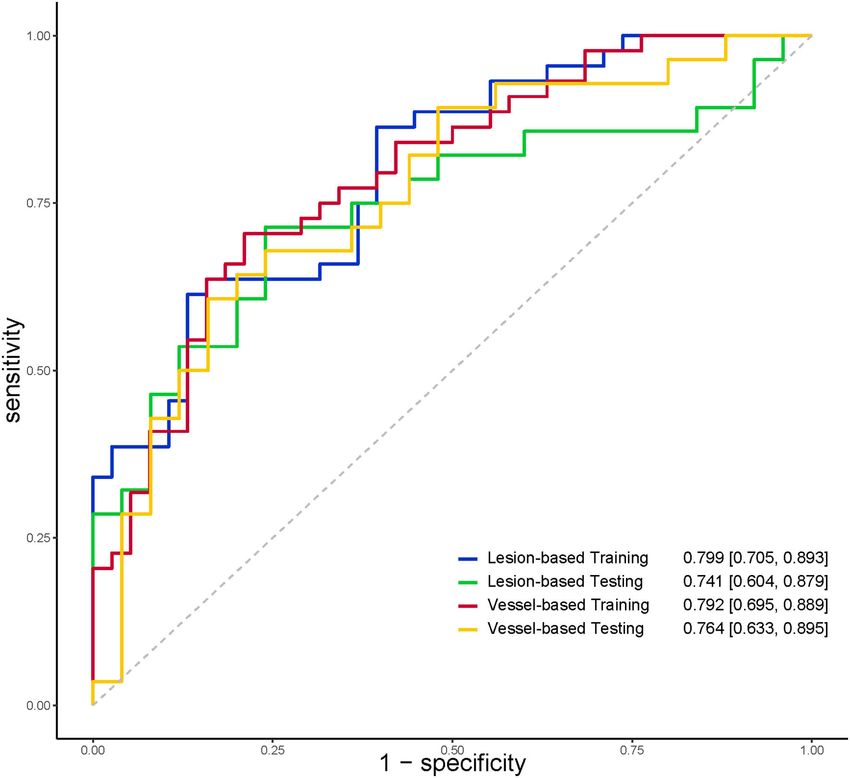
Wen et al. PCAT Assessment With Different Segmentations
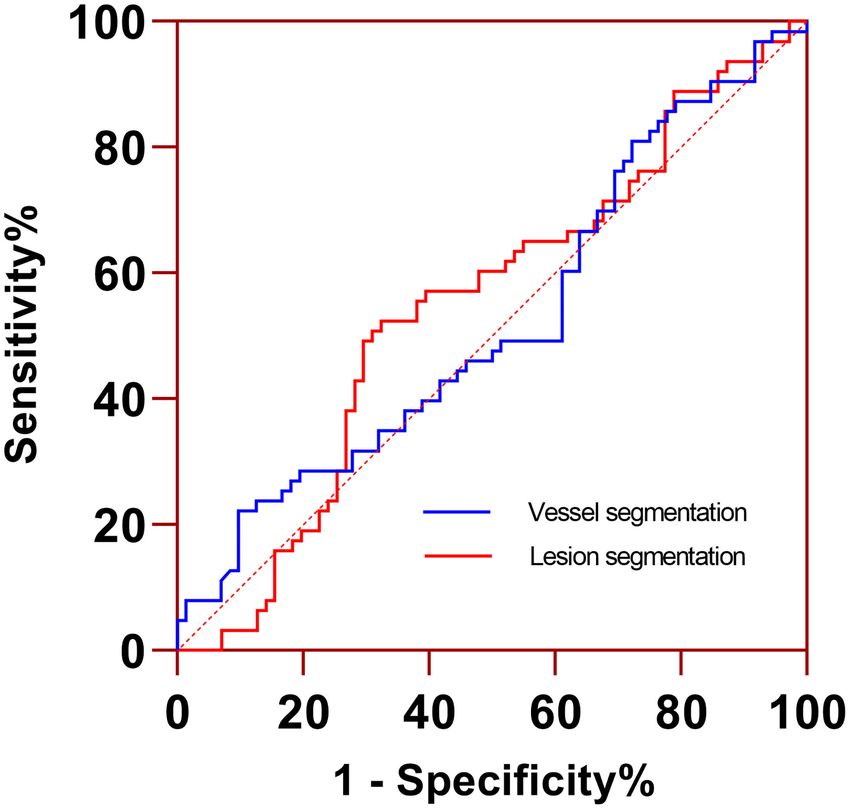
p = 0.463). According to ROC curve analysis, the AUC of (95% CI: 0.436–0.611), which had similar diagnostic performance
PCAT CT attenuation in vessel-based segmentation was 0.524 compared to lesion-based PCAT CT attenuation (0.547, 95% CI:
0.459–0.633, p = 0.814) (Figure 4).
Radiomics Features of PCAT
The dataset was randomly split into a training set (n =
82) and a testing set (n = 53). There was no difference
in stenosis diameter, lesion distribution, and PCAT CT
attenuation between the training and the testing set (all p
> 0.05) (Table 3). Univariable logistic regression selected 24
and 15 radiomics features from lesion-based and vessel-based
PCAT segmentations, respectively. Ten-fold cross validation
was performed to further refine the remaining features. Seven
features from lesion-based PCAT segmentation (Figure 5A),
and six from vessel-based PACT segmentation (Figure 5B)
were ultimately used to construct the radiomics models
using LASSO.
The discriminatory power of radiomics models was
shown in Table 4. The AUC, specificity, and sensitivity of
the radiomics model of lesion-based PCAT segmentation
in the training set were 0.799, 86.8%, and 61.4%, 0.741,
80.0%, and 53.6% in the testing set, respectively (Figure 6).
The vessel-based radiomics model produced comparable
performance: 0.792, 78.9, and 70.5% in the training
set, and 0.763, 64.0, and 67.9% in the testing set. No
FIGURE 4 | ROC curve analysis of PCAT CT attenuation measured from significant difference was detected between vessel-based
lesion- and vessel-based segmentations for identifying functionally significant and lesion-based PCAT segmentations for the prediction
coronary stenosis. Two segmentations had similar AUC (0.547 vs. 0.524, p = of ischemic coronary artery stenosis in both the training
0.814). AUC, area under the curve; ROC, receiver operating
set (AUC: 0.792 vs. 0.799, p = 0.900) and the testing set
characteristic curve.
(AUC: 0.764 vs. 0.741, p = 0.810).
TABLE 3 | Lesion characteristics in the training and testing cohorts.
Variables Overall (n = 135) Training set (n = 82) Testing set (n = 53) p
DS (%), mean (SD) 61.8% ± 18.6% 63.3% ± 18.5% 59.4% ± 18.5% 0.239
Lesion localization, n (%) 0.395
LAD 97 (71.9%) 62 (45.9%) 35 (25.9%)
LCX 17 (12.6%) 8 (5.9%) 9 (6.6%)
RCA 21 (15.6%) 12 (8.9%) 9 (6.7%)
Lesion territory 0.856
Proximal 76 (56.3%) 45 (33.3%) 31 (23.0%)
Middle 33 (24.4%) 20 (14.8%) 13 (9.6%)
Distal 26 (19.3%) 17 (12.6%) 9 (6.7%)
Lesion length, mean (SD), mm 26.1 ± 12.3 37.6 ± 12.6 24.0 ± 11.7 0.102
MLA, mean (SD), mm2 3.5 ± 2.4 3.5 ± 2.4 3.5 ± 2.3 0.913
Total plaque volume (mm3 ) 223.4 ± 191.1 238.5 ± 194.8 199.7 ± 184.4 0.254
Calcified plaque volume (mm3 ) 76.8 ± 111.8 82.1 ± 107.0 68.5 ± 119.7 0.496
Fibrotic plaque volume (mm3 ) 139.4 ± 94.4 148.9 ± 99.8 124.4 ± 84.0 0.144
Lipid plaque volume (mm3 ) 7.2 ± 12.4 7.5 ± 13.5 6.8 ± 10.5 0.759
PCAT CT attenuation, mean (SD), HU
Lesion-based segmentation −75.7 ± 9.1 −76.1 ± 9.5 −75.0 ± 8.6 0.518
Vessel-based segmentation −76.1 ± 8.1 −76.2 ± 8.6 −76.0 ± 7.5 0.881
FFR 0.809 ± 0.007 0.808 ± 0.079 0.811 ± 0.086 0.969
DS, diameter stenosis; FFR, fractional flow reserve; HRP, high risk plaque; LAD, left coronary artery; LCX, left circumflex; MLA, minimal lumen area; PCAT, pericoronary adipose tissue;
RCA, right coronary artery; SD, Standard deviation.
Frontiers in Cardiovascular Medicine | www.frontiersin.org 6 March 2022 | Volume 9 | Article 773524Wen et al. PCAT Assessment With Different Segmentations
FIGURE 5 | Manhattan plots demonstrated the strength of association [–log10 (P-value)] of univariate logistic regression] comparing PCAT radiomics features derived
from lesion-based (A) and vessel-based (B) PCAT segmentation against the hemodynamic significance of coronary stenosis. Solid points above the horizontal cutoff
line denote features qualified for univariate logistic regression and LASSO-logistic regression, and their corresponding feature names are displayed. LASSO, least
absolute shrinkage and selection operator; PCAT, pericoronary adipose tissue.
TABLE 4 | Discriminatory power of radiomics models.
Different segmentations AUC (95% CI) Sensitivity Specificity Accuracy
Training set (n = 82)
Vessel-based segmentation 0.792 (0.695–0.889) 0.705 0.789 0.744
Lesion-based segmentation 0.799 (0.705–0.893) 0.614 0.868 0.732
p 0.900
Testing set (n = 53)
Vessel-based segmentation 0.764 (0.633–0.895) 0.679 0.640 0.660
Lesion-based segmentation 0.741 (0.604–0.879) 0.536 0.800 0.660
p 0.810
DISCUSSION show comparable diagnostic performance in predicting
ischemic stenosis.
The current study compared PCAT CT attenuation and Most studies (3–5, 7, 10, 13, 21) have validated that higher
radiomics features derived from different PCAT segmentations. vessel-based PCAT CT attenuation was associated with an
Our study’s main finding is that vessel-based segmentation increased risk of cardiac mortality, poor prognosis, higher
shows good agreement with lesion-based segmentation, along plaque burden and impaired myocardial perfusion. However,
with a small bias for PCAT CT attenuation. In addition, the association between vessel-based PCAT CT attenuation and
vessel-based and lesion-based PCAT radiomics models the hemodynamic stenosis was not reported. A recent published
Frontiers in Cardiovascular Medicine | www.frontiersin.org 7 March 2022 | Volume 9 | Article 773524Wen et al. PCAT Assessment With Different Segmentations FIGURE 6 | ROC curves indicated comparable diagnostic performance between vessel-based and lesion-based PCAT radiomics models for identifying functionally significant coronary stenosis. PCAT, pericoronary adipose tissue; ROC, receiver operating characteristic. study (6) demonstrated that the increase of lesion-based PCAT studies, the PACT segmentation can be at the discretion of CT attenuation was associated with the hemodynamic significant the radiologists. of stenosis. Our study evaluated both lesion-based and vessel- However, it was unexpected that PCAT CT attenuation was based PCAT CT attenuation, as well as their respective diagnostic not significantly different between hemodynamically significant performance for the hemodynamic stenosis. The present results stenoses and non-significant ones, regardless of the PCAT showed PCAT CT attenuation derived from vessel-based and segmentation method. This finding is inconsistent with two lesion-based segmentations had a good agreement for all vessels previous studies (6, 16). The mean PCAT CT attenuation analysis as well as sub-group analysis. However, the good in coronary arteries with FFR >0.80 was similar to the correlation and agreement of PCAT CT attenuation between above-mentioned studies (6, 16). The discrepancy in PCAT lesion-based and vessel-based segmentation in our study may CT attenuation between this study and the previous studies be attributed to the location and length of the lesion. In this was predominantly in coronary arteries with FFR ≤0.80. The study, 80.7% (109/135) of lesions were located in the proximal to probable explanation may be attributed to the different diameter middle segments of coronary artery, with the mean lesion length stenosis. Similar to previous studies (5, 16), patients with high of 26.2 ± 12.3 mm. In view of good correlation between PCAT PCAT CT attenuation usually had high-grade stenosis according CT attenuation measurements from vessel segmentation and to previous studies. In our clinical practice, most patients referred lesion segmentation, therefore, quantitative evaluation of PCAT for FFR often had intermediate stenosis (30–70%). The mean can be reliable from both segmentations. As with real-world stenosis diameter (64.0 ± 17.3%) in coronary arteries with FFR Frontiers in Cardiovascular Medicine | www.frontiersin.org 8 March 2022 | Volume 9 | Article 773524
Wen et al.                                                                                            PCAT Assessment With Different Segmentations

≤0.80 was obviously less severe in our study than in the Yu                LIMITATIONS
et al. study (76.32 ± 8.52%) (6); thus, leading to a low mean
PCAT CT attenuation. Statistical differences in degree of stenosis         This study had some limitations. Firstly, this was a single-
between coronary arteries with FFR >0.80 and those with FFR                center, retrospective study with a relatively small sample size.
≤0.80 did differ between Yu et al. (6) and our study, however, the         An inclusion bias existed because the study population did not
diagnostic performance of PCAT CT attenuation in predicting                include patients with minimal or severe stenosis. Furthermore,
ischemic stenosis in Yu et al. was slightly superior than in our           due to its retrospective nature, the impact of the related clinical
study (AUC: 0.630 vs. 0.547 and 0.524). In the Hoshino et al.              factors on PCAT CT attenuation, such as serum highly sensitive
study, several patients with severe stenosis (FFR < 0.5) with              C-reactive protein level, left ventricular ejection fractions, left
elevated PCAT CT attenuation were enrolled, thus leading to a              ventricular hypertrophy, etc., could not be investigated in our
higher average PCAT CT attenuation. However, patients enrolled             study. Secondly, all patients underwent CCTA using the same CT
in the present study were hemodynamically less severe, which is            scanner and protocol. Hence, the generalizability of our findings
reflected in the minimal FFR value of 0.59. Thus, the mean PCAT            to other populations may be limited, as image acquisition and
CT attenuation in coronary arteries with FFR ≤0.80 was lower,              reconstruction settings can affect the reproducibility of PCAT
and not significantly different from those with FFR >0.80.                 CT attenuation and radiomics features. Thirdly, the software for
    PCAT analysis was also performed around either all three               PCAT quantification is limited to a single vendor and is not yet
major epicardial coronary vessels (5, 7, 9–11) or one of the               commercially available. Finally, we did not exclude the patients
coronary arteries (RCA or LAD) (2–4, 8, 12–16). The CRISP CT               treated by statins in this study, and potentially introduced
showed the statistical collinearity between PCAT CT attenuation            unnecessary bias to our results as statins may influence PCAT CT
measurements around RCA and LAD. Our study extended earlier                attenuation and PCAT radiomics.
findings and indicated that the high correlation between vessel-
based and lesion-based PCAT CT attenuation was also detected               CONCLUSIONS
in all three major epicardial coronary vessels.
    Radiomics analysis suggested that no significant differences           This study demonstrated that quantitative evaluation of PCAT
were found between lesion-based and vessel-based radiomics                 can be reliably measured both from lesion-based and vessel-based
models with comparable AUCs (0.799 vs. 0.792 in training                   segmentation. We also found that PCAT radiomics features
set, and 0.741 vs. 0.764 in testing set). Radiomics features               may potentially help predict hemodynamically significant
were mainly limited to intensity and texture, although the                 coronary stenoses.
detailed features were not identical in the two segmentation
methods. Among the significant radiomics features, texture
                                                                           DATA AVAILABILITY STATEMENT
homogeneity and wavelet-transformed intensity distribution
within PCAT were particularly important in predicting the                  The original contributions presented in the study are included
hemodynamic significance of coronary stenosis, regardless                  in the article/Supplementary Material, further inquiries can be
of different segmentation methods. A possible reason is that               directed to the corresponding author.
coronary stenoses are usually followed by an inflammatory
response, which stimulates neovascularization and fibrosis
while breaking down PCAT (8). As a result of lipolysis, local              ETHICS STATEMENT
inflammation leads to sporadic transformation of adipose
                                                                           The studies involving human participants were reviewed and
tissue to an aqueous component, hence increasing CT
                                                                           approved by Xijing Hospital of Fourth Military Medical
attenuation and tissue heterogeneity. Therefore, intensity
                                                                           University. The patients/participants provided their written
and texture radiomics features could be indications of
                                                                           informed consent to participate in this study.
such processes, which suggest the potential development of
coronary stenoses.
    Geometric characteristics such as flatness and elongation were         AUTHOR CONTRIBUTIONS
also highlighted in our study, although PCAT was segmented
with strictly defined rules. These metrics are defined as the              MZ: guarantor of integrity of the entire study. DW and MZ: study
square root of the ratio between the lesser and the largest                concepts and design. RA: literature research. WY and RA: clinical
principal components in a three-dimensional volume. In the                 studies. SL and YJ: experimental studies and data analysis. DW
vessel-based segmentations with constant length, elongation and            and SL: statistical analysis. DW and RA: manuscript preparation.
flatness depend mainly on the stiffness of vessels. Vessels with           RA and MZ: manuscript editing. All authors contributed to the
flow-limiting (FFR ≤ 0.80) lesions were associated with impaired           article and approved the submitted version.
vasodilator capacity, and were likely stiffer than vessels with non-
flow-limiting lesions (6). The visually indiscernible slight change        FUNDING
of geometric features of PCAT adjacent to vessel wall could be
captured by radiomics. Therefore, the two geometric radiomics              This study has received funding from the National Natural
features of elongation and flatness may be associated with FFR.            Science Foundation of China (Grant No. 82071917 to MZ), the

Frontiers in Cardiovascular Medicine | www.frontiersin.org             9                                     March 2022 | Volume 9 | Article 773524
Wen et al. PCAT Assessment With Different Segmentations
Key Research and Development Plan of Shaanxi Province (Grant SUPPLEMENTARY MATERIAL
No. 2020ZDLSF01-01 to MZ), the National Science Foundation
of Shaanxi Province (Grant No. 2020JQ-461 to DW), and the The Supplementary Material for this article can be found
Discipline Promotion Projects of Xijing Hospital (Grant No. online at: https://www.frontiersin.org/articles/10.3389/fcvm.
XJZT19Z13 to MZ). 2022.773524/full#supplementary-material
REFERENCES 14. Elnabawi YA, Oikonomou EK, Dey AK, Mancio J, Rodante JA, Aksentijevich
M, et al. Association of biologic therapy with coronary inflammation in
1. Libby P, Loscalzo J, Ridker PM, Farkouh ME, Hsue PY, Fuster V, patients with psoriasis as assessed by perivascular fat attenuation index. JAMA
et al. Inflammation, immunity, and infection in atherothrombosis: Cardiol. (2019) 4:885–91. doi: 10.1001/jamacardio.2019.2589
JACC review topic of the week. J Am Coll Cardiol. (2018) 15. Eisenberg E, McElhinney PA, Commandeur F, Chen X, Cadet S, Goeller
72:2071–81. doi: 10.1016/j.jacc.2018.08.1043 M, et al. Deep learning-based quantification of epicardial adipose
2. Lin A, Kolossváry M, Yuvaraj J, Cadet S, McElhinney PA, Jiang C, et al. tissue volume and attenuation predicts major adverse cardiovascular
Myocardial infarction associates with a distinct pericoronary adipose tissue events in asymptomatic subjects. Circ Cardiovasc Imaging. (2020)
radiomic phenotype: a prospective case-control study. JACC Cardiovasc 13:e009829. doi: 10.1161/CIRCIMAGING.119.009829
Imaging. (2020) 13:2371–83. doi: 10.1016/j.jcmg.2020.06.033 16. Hoshino M, Yang S, Sugiyama T, Zhang J, Kanaji Y, Yamaguchi M, et al. Peri-
3. Goeller M, Tamarappoo BK, Kwan AC, Cadet S, Commandeur F, Razipour coronary inflammation is associated with findings on coronary computed
A, et al. Relationship between changes in pericoronary adipose tissue tomography angiography and fractional flow reserve. J Cardiovasc Comput
attenuation and coronary plaque burden quantified from coronary computed Tomogr. (2020) 14:483–9. doi: 10.1016/j.jcct.2020.02.002
tomography angiography. Eur Heart J Cardiovasc Imaging. (2019) 20:636– 17. Dai X, Deng J, Yu M, Lu Z, Shen C, Zhang J. Perivascular fat attenuation
43. doi: 10.1093/ehjci/jez013 index and high-risk plaque features evaluated by coronary CT angiography:
4. Goeller M, Rahman Ihdayhid A, Cadet S, Lin A, Adams D, Thakur U, et relationship with serum inflammatory marker level. Int J Cardiovasc Imaging.
al. Pericoronary adipose tissue and quantitative global non-calcified plaque (2020) 36:723–30. doi: 10.1007/s10554-019-01758-8
characteristics from CT angiography do not differ in matched south asian, 18. Scanlon PJ, Faxon DP, Audet AM, Carabello B, Dehmer GJ, Eagle KA, et al.
east asian and european-origin caucasian patients with stable chest pain. Eur ACC/AHA guidelines for coronary angiography. A report of the American
J Radiol. (2020) 125:108874. doi: 10.1016/j.ejrad.2020.108874 College of Cardiology/American Heart Association task force on practice
5. Goeller M, Achenbach S, Cadet S, Kwan AC, Commandeur F, Slomka guidelines (committee on coronary angiography). Developed in collaboration
PJ, et al. Pericoronary adipose tissue computed tomography attenuation with the society for cardiac angiography and interventions. J Am Coll Cardiol.
and high-risk plaque characteristics in acute coronary syndrome (1999) 33:1756–824. doi: 10.1016/s0735-1097(99)00126-6
compared with stable coronary artery disease. JAMA Cardiol. (2018) 19. Cami E, Tagami T, Raff G, Gallagher MJ, Fan A, Hafeez A, et al.
3:858–63. doi: 10.1001/jamacardio.2018.1997 Importance of measurement site on assessment of lesion-specific ischemia and
6. Yu M, Dai X, Deng J, Lu Z, Shen C, Zhang J. Diagnostic diagnostic performance by coronary computed tomography angiography-
performance of perivascular fat attenuation index to predict derived fractional flow reserve. J Cardiovasc Comput Tomogr. (2021) 15:114–
hemodynamic significance of coronary stenosis: a preliminary 20. doi: 10.1016/j.jcct.2020.08.005
coronary computed tomography angiography study. Eur Radiol. (2020) 20. Yu M, Shen C, Dai X, Lu Z, Wang Y, Lu B, et al. Clinical outcomes
30:673–81. doi: 10.1007/s00330-019-06400-8 of dynamic computed tomography myocardial perfusion imaging
7. Oikonomou EK, Marwan M, Desai MY, Mancio J, Alashi A, Hutt Centeno combined with coronary computed tomography angiography versus
E, et al. Non-invasive detection of coronary inflammation using computed coronary computed tomography angiography-guided strategy. Circ
tomography and prediction of residual cardiovascular risk (the CRISP CT Cardiovasc Imaging. (2020) 13:e009775. doi: 10.1161/CIRCIMAGING.119.0
study): a post-hoc analysis of prospective outcome data. Lancet. (2018) 09775
392:929–39. doi: 10.1016/S0140-6736(18)31114-0 21. Mahabadi AA, Reinsch N, Lehmann N, Altenbernd J, Kälsch H, Seibel
8. Oikonomou EK, Williams MC, Kotanidis CP, Desai MY, Marwan RM, et al. Association of pericoronary fat volume with atherosclerotic
M, Antonopoulos AS, et al. A novel machine learning-derived plaque burden in the underlying coronary artery: a segment analysis.
radiotranscriptomic signature of perivascular fat improves cardiac Atherosclerosis. (2010) 211:195–9. doi: 10.1016/j.atherosclerosis.2010.
risk prediction using coronary CT angiography. Eur Heart J. (2019) 02.013
40:3529–43. doi: 10.1093/eurheartj/ehz592
9. Balcer B, Dykun I, Schlosser T, Forsting M, Rassaf T, Mahabadi AA. Conflict of Interest: SL was employed by the company Siemens Healthineers Ltd.
Pericoronary fat volume but not attenuation differentiates culprit lesions
in patients with myocardial infarction. Atherosclerosis. (2018) 276:182– The remaining authors declare that the research was conducted in the absence of
8. doi: 10.1016/j.atherosclerosis.2018.05.035 any commercial or financial relationships that could be construed as a potential
10. Nomura CH, Assuncao AN Jr, Guimarães PO, Liberato G, Morais TC, Fahel conflict of interest.
MG, et al. Association between perivascular inflammation and downstream
myocardial perfusion in patients with suspected coronary artery disease. Eur Publisher’s Note: All claims expressed in this article are solely those of the authors
Heart J Cardiovasc Imaging. (2020) 21:599–605. doi: 10.1093/ehjci/jeaa023 and do not necessarily represent those of their affiliated organizations, or those of
11. Tzolos E, McElhinney P, Williams MC, Cadet S, Dweck MR, Berman DS, et
the publisher, the editors and the reviewers. Any product that may be evaluated in
al. Repeatability of quantitative pericoronary adipose tissue attenuation and
this article, or claim that may be made by its manufacturer, is not guaranteed or
coronary plaque burden from coronary ct angiography. J Cardiovasc Comput
Tomogr. (2021) 15:81–4. doi: 10.1016/j.jcct.2020.03.007 endorsed by the publisher.
12. Almeida S, Pelter M, Shaikh K, Cherukuri L, Birudaraju D, Kim K, et al.
Feasibility of measuring pericoronary fat from precontrast scans: effect of Copyright © 2022 Wen, An, Lin, Yang, Jia and Zheng. This is an open-access article
iodinated contrast on pericoronary fat attenuation. J Cardiovasc Comput distributed under the terms of the Creative Commons Attribution License (CC BY).
Tomogr. (2020) 14:490–4. doi: 10.1016/j.jcct.2020.04.004 The use, distribution or reproduction in other forums is permitted, provided the
13. Kwiecinski J, Dey D, Cadet S, Lee SE, Otaki Y, Huynh PT, et al. Peri-coronary original author(s) and the copyright owner(s) are credited and that the original
adipose tissue density is associated with 18 F-sodium fluoride coronary uptake publication in this journal is cited, in accordance with accepted academic practice.
in stable patients with high-risk plaques. JACC Cardiovasc Imaging. (2019) No use, distribution or reproduction is permitted which does not comply with these
12:2000–10. doi: 10.1016/j.jcmg.2018.11.032 terms.
Frontiers in Cardiovascular Medicine | www.frontiersin.org 10 March 2022 | Volume 9 | Article 773524You can also read