Inter-comparison of wind measurements in the atmospheric boundary layer and the lower troposphere with Aeolus and a ground-based coherent Doppler ...
←
→
Page content transcription
If your browser does not render page correctly, please read the page content below
Atmos. Meas. Tech., 15, 131–148, 2022
https://doi.org/10.5194/amt-15-131-2022
© Author(s) 2022. This work is distributed under
the Creative Commons Attribution 4.0 License.

Inter-comparison of wind measurements in the atmospheric
boundary layer and the lower troposphere with Aeolus and a
ground-based coherent Doppler lidar network over China
Songhua Wu1,2,3 , Kangwen Sun1 , Guangyao Dai1 , Xiaoye Wang1 , Xiaoying Liu1 , Bingyi Liu1,2 , Xiaoquan Song1,3 ,
Oliver Reitebuch4 , Rongzhong Li5 , Jiaping Yin5 , and Xitao Wang5
1 College  of Marine Technology, Faculty of Information Science and Engineering, Ocean University of China,
Qingdao, 266100, China
2 Laboratory for Regional Oceanography and Numerical Modelling, Pilot National Laboratory for

Marine Science and Technology (Qingdao), Qingdao, 266200, China
3 Institute for Advanced Ocean Study, Ocean University of China, Qingdao, 266100, China
4 Institute of Atmospheric Physics, German Aerospace Center (Deutsches Zentrum für Luft- und Raumfahrt e.V., DLR),

82234 Oberpfaffenhofen, Germany
5 Qingdao Leice Transient Technology Co., Ltd., Qingdao, 266100, China

Correspondence: Songhua Wu (wush@ouc.edu.cn)

Received: 25 August 2021 – Discussion started: 27 August 2021
Revised: 30 October 2021 – Accepted: 24 November 2021 – Published: 5 January 2022

Abstract. After the successful launch of Aeolus, which is       wind, the correlation coefficient, the standard deviation, the
the first spaceborne wind lidar developed by the European       scaled MAD and the bias are 0.62, 7.07 m s−1 , 5.77 m s−1
Space Agency (ESA), on 22 August 2018, we deployed sev-         and −1.15 m s−1 , respectively, while the y = ax slope, the
eral ground-based coherent Doppler wind lidars (CDLs) to        y = ax + b slope and the y = ax + b intercept are 1.00, 0.96
verify the wind observations from Aeolus. By the simultane-     and −1.2 m s−1 . It is found that the standard deviation, the
ous wind measurements with CDLs at 17 stations over China,      scaled MAD and the bias on ascending tracks are lower than
the Rayleigh-clear and Mie-cloudy horizontal-line-of-sight      those on descending tracks. Moreover, to evaluate the accu-
(HLOS) wind velocities from Aeolus in the atmospheric           racy of Aeolus HLOS wind measurements under different
boundary layer and the lower troposphere are compared with      product baselines, the Aeolus L2B Mie-cloudy HLOS wind
those from CDLs. To ensure the quality of the measure-          data and L2B Rayleigh-clear HLOS wind data under Base-
ment data from CDLs and Aeolus, strict quality controls are     lines 07 and 08, Baselines 09 and 10, and Baseline 11 are
applied in this study. Overall, 52 simultaneous Mie-cloudy      compared against the CDL-retrieved HLOS wind data sepa-
comparison pairs and 387 Rayleigh-clear comparison pairs        rately. From the comparison results, marked misfits between
from this campaign are acquired. All of the Aeolus-produced     the wind data from Aeolus Baselines 07 and 08 and wind
Level 2B (L2B) Mie-cloudy HLOS wind and Rayleigh-clear          data from CDLs in the atmospheric boundary layer and the
HLOS wind and CDL-produced HLOS wind are compared               lower troposphere are found. With the continuous calibra-
individually. For the inter-comparison result of Mie-cloudy     tion and validation and product processor updates, the per-
HLOS wind and CDL-produced HLOS wind, the correla-              formances of Aeolus wind measurements under Baselines 09
tion coefficient, the standard deviation, the scaled mean ab-   and 10 and Baseline 11 are improved significantly. Consid-
solute deviation (MAD) and the bias are 0.83, 3.15 m s−1 ,      ering the influence of turbulence and convection in the atmo-
2.64 m s−1 and −0.25 m s−1 , respectively, while the y = ax     spheric boundary layers and the lower troposphere, higher
slope, the y = ax + b slope and the y = ax + b intercept are    values for the vertical velocity are common in this region.
0.93, 0.92 and −0.33 m s−1 . For the Rayleigh-clear HLOS

Published by Copernicus Publications on behalf of the European Geosciences Union.
132                                                   S. Wu et al.: Inter-comparison of Aeolus and CDL network over China

Hence, as a special note, the vertical velocity could impact        well-validated ALADIN Airborne Demonstrator (A2D) are
the HLOS wind velocity retrieval from Aeolus.                       compared (Lux et al., 2020a; Witschas et al., 2020). An ex-
                                                                    ample of early validation of Aeolus with a direct-detection
                                                                    Rayleigh–Mie Doppler lidar was performed at the Observa-
1   Introduction                                                    toire de Haute-Provence (OHP) in southern France (Khaykin
                                                                    et al., 2020). In November and December 2018, a unique val-
Reliable instantaneous vertical profiling of the global wind        idation of the wind products of Aeolus in the Atlantic Ocean
field, especially over the tropics and oceans, is crucial to        west of the African continent was conducted by using the ra-
many aspects of climate change, oceanography research,              diosondes carried on RV Polarstern cruise PS116 (Baars et
large-scale weather systems and weather prediction. It is           al., 2020). In China, the wind observations from Aeolus were
also needed to address some of the key concerns of atmo-            compared with the results from the ground-based radar wind
spheric dynamics and climate processes (Stoffelen et al.,           profiler network and radiosondes (Guo et al., 2021b). There
2005). The wind field measurements are important for stud-          were some significant validation campaigns as well using air-
ies of the large-scale monsoon systems and El Niño phe-             borne instruments and radiosondes (e.g. Bedka et al., 2021;
nomenon in tropics and the jet stream in extra-tropics. Wind        Martin et al., 2021).
profiles are available from the global radiosonde network              As a member of the Cal/Val teams, the Ocean Univer-
and aircraft ascents and descents and cruising altitudes for        sity of China (OUC) has performed one long-term obser-
numerical weather prediction (Zhang et al., 2020; Guo et            vation campaign with 1550 nm coherent Doppler wind li-
al., 2021a). However, due to the lack of wind profiles over         dars (CDLs) all over China. During the campaign, 439
ocean areas from the radiosonde network and wind obser-             simultaneous measurement cases were acquired with the
vations only at a specific flight altitude (around 10–12 km         CDLs of types Wind3D 6000 and WindMast PBL, which
about ground level) in aircraft measurements, a first-ever          are manufactured by Qingdao Leice Transient Technology
spaceborne direct-detection wind lidar, Aeolus, which is ca-        Co., Ltd (http://www.leice-lidar.com/en/index.html, last ac-
pable of providing the globally high spatial and temporal ver-      cess: 23 August 2021). During the data processing, it was
tical wind profiles, was developed by the European Space            found that the atmospheric vertical velocity could influence
Agency (ESA) under the framework of the Atmospheric Dy-             the horizontal-line-of-sight (HLOS) wind velocity measured
namics Mission (Stoffelen et al., 2005; ESA, 1999; Reite-           by Aeolus in the atmospheric boundary layer and the lower
buch, 2012). On 22 August 2018, Aeolus was successfully             troposphere. Hence, it should be specially noted that the
launched into its sun-synchronous orbit at a height of 320 km       HLOS wind velocities from CDLs and Aeolus are different
(Kanitz et al., 2018; Straume et al., 2018; Reitebuch et al.,       and should be corrected.
2020). A quasi-global coverage is achieved daily (∼ 16 orbits          This paper provides the inter-comparison of the HLOS
per day), and the orbit repeat cycle is 7 d (111 orbits). The or-   wind velocities measured by CDLs and Aeolus. The paper
bit is sun-synchronous, with a local equatorial crossing-time       is organized as follows: in Sect. 2 the simultaneous valida-
of 06:00 and 18:00 local time (LT). The Atmospheric Laser           tion campaigns and the instrument deployed for the mea-
Doppler Instrument (ALADIN) is a direct-detection high-             surements are described. Section 3 presents the details to the
spectral-resolution wind lidar operating at a laser wavelength      inter-comparison strategy, the quality control and vertical-
of 354.8 nm and provides vertical profiles of the line-of-sight     velocity-correction procedure. In Sect. 4 we provide the
(LOS) wind speed. In order to retrieve the LOS wind speeds,         HLOS wind velocity measurement examples and comparison
the Doppler shifts in light caused by the motion of molecules       results. Section 5 summarizes the recent comparison results
and aerosol particles need to be identified. Aiming at this, a      and compares those with ours.
Fizeau interferometer is applied in the Mie channel to extract
the frequency shift in the narrow-band particulate return sig-
nal by means of a fringe imaging technique (Mckay, 2002).           2     Validation campaigns in China and lidar
In the Rayleigh channel, two coupled Fabry–Pérot interfer-                introduction
ometers are used to analyse the frequency shift in the broad-
band molecular return signal by the double-edge technique           2.1    Overview of the validation campaigns
(Chanin et al., 1989; Flesia and Korb, 1999).
   After the successful launch of ALADIN, the data products         Shortly after the successful launch of the Aeolus, the pri-
were released to the Aeolus Cal/Val teams on 16 December            mary laser head FM-A (flight model laser A) was switched
2018. To recheck the quality of the data products, a valida-        on, and an initial laser pulse energy of 65 mJ was achieved
tion of Aeolus winds by means of ground-based, airborne and         (Lux et al., 2020b). During the period from 14 January to
shipborne reference instrument measurements is inevitable.          14 February 2019, Aeolus was in standby mode and switched
From the validation campaigns conducted by the German               on with FM-A. After a final test with laser FM-A of Aeolus
Aerospace Center (Deutsches Zentrum für Luft- und Raum-             on 17 June, the transition to laser FM-B took place. About
fahrt e.V., DLR), the wind observations from Aeolus and the         half a year later, beginning in January 2020, the validation

Atmos. Meas. Tech., 15, 131–148, 2022                                                 https://doi.org/10.5194/amt-15-131-2022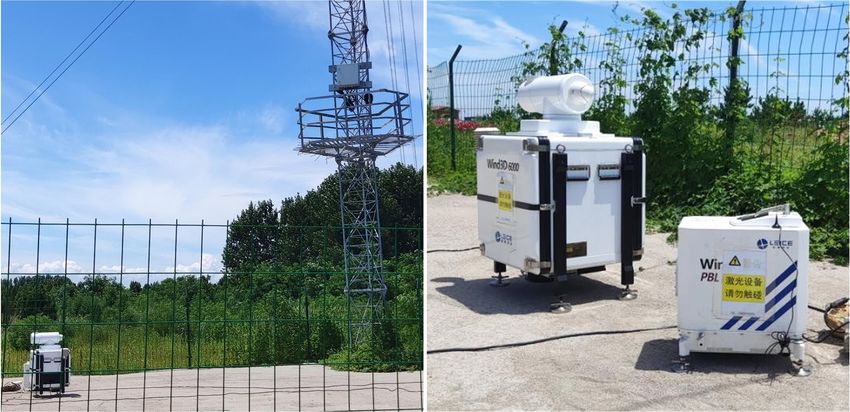
S. Wu et al.: Inter-comparison of Aeolus and CDL network over China 133
clouds at the same time. The horizontal resolution of the
wind observations is about 90 km for the Rayleigh channel
and about 10–15 km for the Mie channel. A detailed descrip-
tion of the instrument design and a demonstration of the mea-
surement concept are introduced in, for example, Reitebuch
et al. (2009), Reitebuch (2012), Straume et al. (2018), ESA
(2008) and Marksteiner (2013).
The data products of Aeolus are processed at different lev-
els mainly including Level 0 (instrument housekeeping data),
Level 1B (engineering-corrected HLOS winds), Level 2A
(aerosol and cloud layer optical properties), Level 2B (me-
teorologically representative HLOS winds) and Level 2C
(Aeolus-assisted wind vectors from the ECMWF model)
(Tan et al., 2008; Rennie and Isaksen, 2020). In this study,
the Level 2B HLOS wind velocities are used. Within the
Level 2B processor, the Rayleigh-clear and Mie-cloudy
winds are classified, and the temperature and pressure cor-
rection are applied for the Rayleigh wind retrieval.
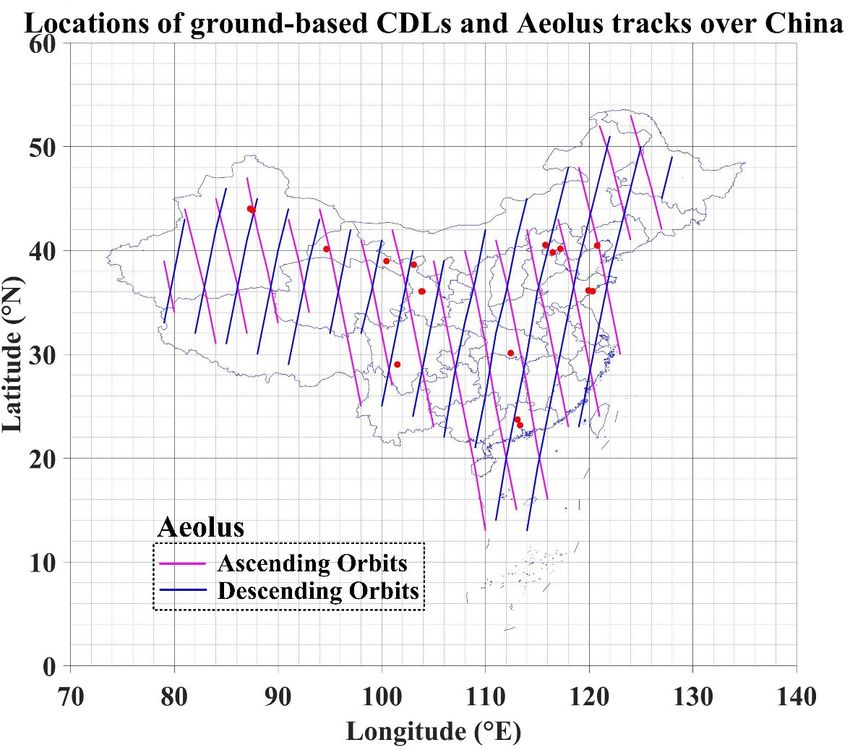
Figure 1. Ground-based CDL observation sites of the VAL-OUC 2.2.2 Coherent Doppler wind lidar instrument
campaign since January 2020. The pink and blue swaths indicate the
ascending and descending orbits of Aeolus. The red dots represent
Lidar is one of the most accurate optical remote sensing
the locations of the CDLs.
techniques for wind field measurements. The 1550 nm wave-
length all-fibre coherent Doppler wind lidar (CDL) with high
campaign (VAL-OUC) performed by the Ocean University resolution takes advantage of the fact that the frequency of
of China was carried out at 17 stations. The comparison re- the echo signal is shifted from the local-oscillator light be-
sults of HLOS wind velocities in the atmospheric boundary cause of the Doppler effect, which occurs from backscatter-
layer and the lower troposphere from CDLs and Aeolus are ing of aerosols. The Doppler frequency shift in the backscat-
presented in Sect. 4. The duration of the validation campaign tered signal is analysed to obtain the LOS velocity along the
(VAL-OUC) was from January to December 2020. The loca- lidar beam direction. The CDL is based on the heterodyne
tions of the CDLs and the ascending and descending orbits of technique, consisting of a single-frequency seed laser source,
Aeolus are shown in Fig. 1. An overview and detailed infor- an acousto-optic modulator, an erbium-doped fibre amplifier,
mation of the validation campaign are provided in Table 1. optical isolators, amplified spontaneous emission noise fil-
ters, an optical switch, a transceiver telescope, a balanced
2.2 The ALADIN and CDL descriptions detector, an analogue-to-digital converter and a fast Fourier
transform signal processor. Further information regarding the
In this subsection, the unique payload of Aeolus, the At- CDL is described in a separate paper (Wu et al., 2016).
mospheric Laser Doppler Instrument (ALADIN), and the The CDLs of types Wind3D 6000 and WindMast PBL
ground-based reference coherent Doppler wind lidar are are lidar systems for wind measurements in the lower atmo-
briefly described. sphere. The devices were developed by Qingdao Leice Tran-
sient Technology Co., Ltd. and designed with consideration
2.2.1 ALADIN of the needs of the meteorological application, wind energy
industry and aviation safety. The specifications of the CDLs
ALADIN is a direct-detection high-spectral-resolution wind are listed in Table 2.
lidar which operates at a wavelength of 354.8 nm, with a laser To evaluate the accuracy and precision of ground-based
pulse energy around 65 mJ and with a repetition of 50.5 Hz CDL measurements, the Wind3D 6000 and the Wind-
(Lux et al., 2020b). It is equipped with a 1.5 m diameter tele- Mast PBL were validated with mast-mounted cup anemome-
scope to collect the backscatter light from molecules and ters and wind vanes at Haiyang, Shandong Province, of
aerosol particles. The high-spectral-resolution design of AL- China from 23 to 30 July 2021. The photos of the CDLs and
ADIN allows for the simultaneous detection of the molec- the mast onto which the cup anemometers and the wind vines
ular (Rayleigh) and particle (Mie) backscattered signals in were mounted at the Haiyang site are shown in Fig. 2. The
two separate channels, each sampling the wind in 24 verti- horizontal distance between the Wind3D 6000, the Wind-
cal height bins with a vertical range resolution between 0.25 Mast PBL and the mast is around 6 m. The met mast configu-
and 2.0 km. This makes it possible to deliver winds in both ration is compliant with International Electrical Commission
clear and (partly) cloudy conditions down to optically thick (IEC) 61400-12-1 Edition 2 (IEC, 2011). All cup anemome-
https://doi.org/10.5194/amt-15-131-2022 Atmos. Meas. Tech., 15, 131–148, 2022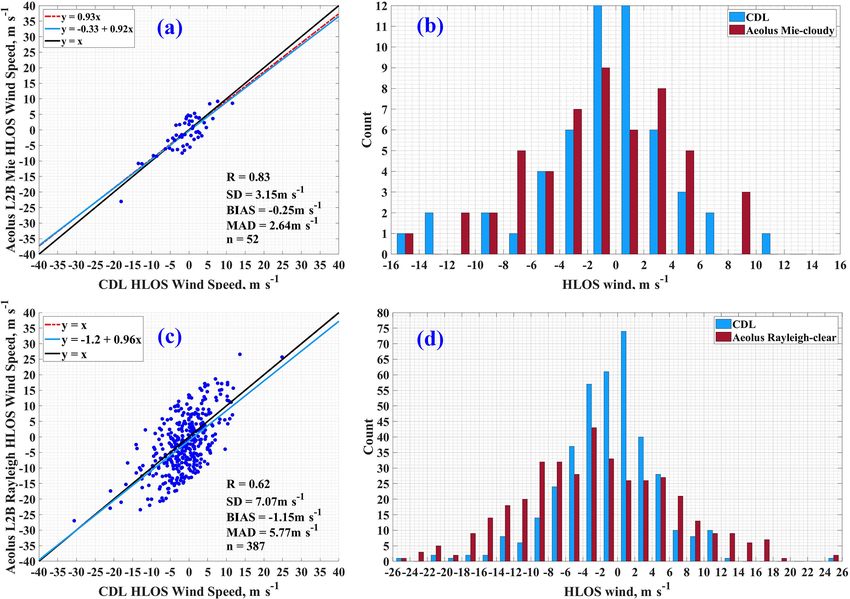
134 S. Wu et al.: Inter-comparison of Aeolus and CDL network over China
Table 1. Overview of Aeolus validation campaigns performed by the OUC.
Validation Instrument Measurement Location Latitude, longitude, Measurement
campaigns type mode altitude period
VAL-OUC WindMast PBL DBS∗ Dunhuang 40.12◦ N, 94.66◦ E; From 7 Jan to
1.15 km 29 Dec 2020
WindMast PBL DBS Lanzhou 36.05◦ N, 103.91◦ E; From 7 Jan to
1.51 km 29 Dec 2020
WindMast PBL DBS Zhangye 38.97◦ N, 100.45◦ E; From 5 Jan to
1.46 km 27 Dec 2020
Wind3D 6000 DBS Jingzhou 30.11◦ N, 112.44◦ E; From 24 Jun to
0.03 km 22 Jul 2020
Wind3D 6000 DBS Pinggu, Beijing 40.15◦ N, 117.22◦ E; From 21 Apr to
0.05 km 2 Jun 2020
Wind3D 6000 DBS Changji 44.01◦ N, 87.30◦ E; 3 Dec 2020
0.58 km
Wind3D 6000 DBS Jiulong, Sichuan 29.01◦ N, 101.50◦ E; From 24 Oct to
2.90 km 29 Nov 2020
Wind3D 6000 DBS Jiaozhou, Shandong 36.14◦ N, 119.93◦ E; 21 Dec 2020
0.02 km
Wind3D 6000 DBS Qingyuan, Guangdong 23.71◦ N, 113.09◦ E; From 12 May to
0.03 km 27 Aug 2020
Wind3D 6000 DBS Xidazhuangke, Beijing 40.52◦ N, 115.78◦ E; From 7 Jan to
0.91 km 31 Mar 2020
Wind3D 6000 DBS Yizhuang, Beijing 39.81◦ N, 116.48◦ E; From 7 Apr to
0.04 km 25 Aug 2020
Wind3D 6000 DBS Huludao 40.47◦ N, 120.78◦ E; From 1 Nov to
0.10 km 28 Dec 2020
Wind3D 6000 DBS Wuwei 38.62◦ N, 103.09◦ E; From 11 Apr to
1.37 km 26 Dec 2020
Wind3D 6000 DBS Lanzhou 36.05◦ N, 103.83◦ E; From 4 Jan to
1.53 km 26 Dec 2020
Wind3D 6000 DBS South China University 23.16◦ N, 113.34◦ E; From 13 Oct to
of Technology 0.03 km 29 Dec 2020
Wind3D 6000 DBS Ürümqi 43.85◦ N, 87.55◦ E; From 14 Oct to
0.84 km 24 Dec 2020
Wind3D 6000 DBS Qingdao 36.07◦ N, 120.34◦ E; From 2 Nov to
0.04 km 28 Dec 2020
∗ DBS: Doppler beam swinging.
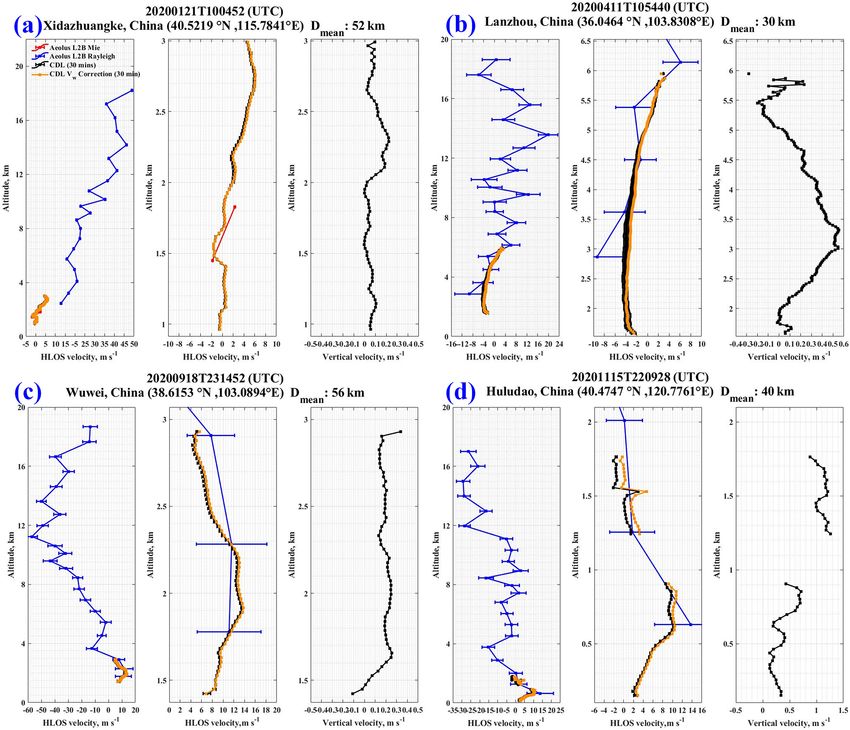
ters installed on the reference mast are class 0.9A instru- and 100 m. Figure 3 shows the comparison results at 50 m,
ments and have undergone individual rotor-specific MEAS- which are wind speed and wind direction for Wind3D 6000
NET calibration at a MEASNET-certified wind tunnel. Data and WindMast PBL, respectively. By performing ordinary-
acquisition systems sample all input ports and connected sen- least-squares linear regressions of the CDLs, cup anemome-
sors continuously with a sampling rate of 1 Hz and compress ters and wind vine wind measurements, the slopes, offsets,
the values to 10 min average values. The specifications of standard deviations and correlation coefficients are acquired,
the cup anemometers and wind vanes are listed in Table 3. and they are within the acceptable limits. The statistic results
The measurement heights selected for comparison are 50 of the validation are shown in Table 4. Hence, the CDLs of
Atmos. Meas. Tech., 15, 131–148, 2022 https://doi.org/10.5194/amt-15-131-2022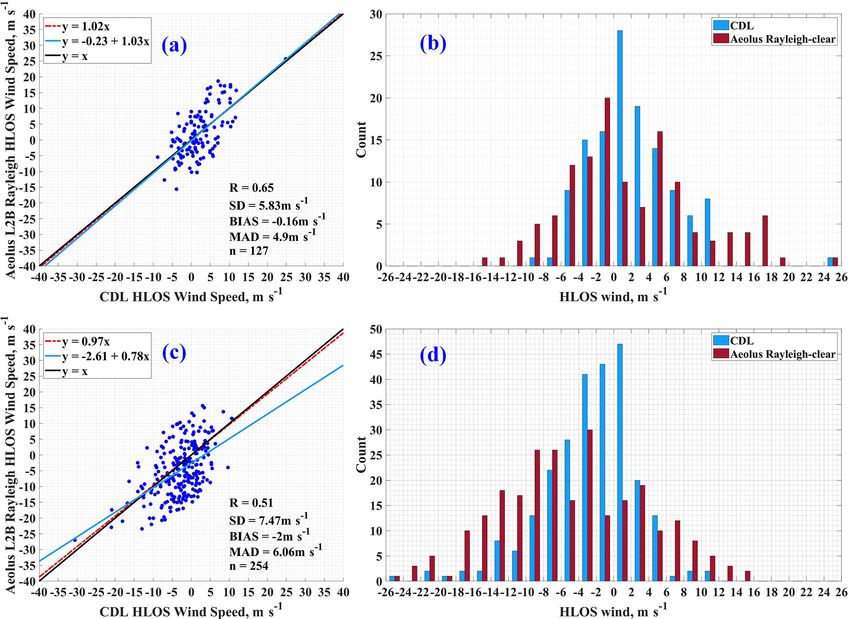
S. Wu et al.: Inter-comparison of Aeolus and CDL network over China                                                            135

Table 2. Overview of CDL specifications used for Aeolus valida-   is applied. The five-beam DBS scanning technique is mainly
tion.                                                             used to retrieve the wind profiles by measuring the LOS wind
                                                                  speeds in the vertical, the northern, the eastern, the south-
    Qualification                      Specifications             ern and the western directions. The original wind product of
                              Wind3D 6000     WindMast PBL        CDLs is 1 s average results (Level 2 product). By considering
                                                                  the low horizontal spatial resolution of Aeolus data (about
    Wavelength                1550 nm         1550 nm
                                                                  90 km for the Rayleigh-clear wind velocities and 10 km for
    Repetition rate           10 kHz          10 kHz
    Pulse energy              160 µJ          100 µJ
                                                                  the Mie-cloudy wind velocities), a 30 min (±15 min) av-
    Pulse width               100 to 400 ns   100 to 400 ns       erage of the CDL wind product is applied, and the near-
    Detection range           80 to 6000 m    30 to 4000 m        est observation profile provided by CDLs and Aeolus is se-
    Data update rate          4 Hz            4 Hz                lected by using the geolocation information in each measure-
    Range resolution          15 to 60 m      15 to 30 m          ment case. Since Aeolus can only deliver the HLOS wind
    Wind speed accuracy       ≤ 0.1 m s−1     ≤ 0.1 m s−1         data, the simultaneous wind measurements from CDLs have
    Wind speed range          ±75 m s−1       ±75 m s−1           to be projected onto the Aeolus HLOS wind direction us-
    Wind direction accuracy   0.1◦            0.1◦                ing the azimuth angle from Aeolus. The CDL-HLOS wind
                                                                  (HLOSCDL ) is calculated as

types Wind3D 6000 and WindMast PBL can act as reference           HLOSCDL = VCDL-EW · sin(AziAeolus )
instruments for the validation of Aeolus in the atmospheric                  + VCDL-SN · cos(AziAeolus ).                       (1)
boundary layer and the lower troposphere.
                                                                  VCDL-EW and VCDL-SN are the east–west wind speed and the
                                                                  south–north wind speed measured by CDLs, respectively,
3     Inter-comparison of Aeolus and CDL measurements             and AziAeolus is the azimuth angle of ALADIN provided with
                                                                  the Aeolus products.
During the validation campaigns of VAL-OUC, the wind
field measurements at the sites over China are continuously       3.2   Influence of vertical velocity in the atmospheric
performed, except during the period of the CDL mainte-                  boundary layer and the lower troposphere
nances.
                                                                  In the atmospheric boundary layer and the lower troposphere,
3.1    Inter-comparison strategy                                  the vertical velocity of air mass shows a pronounced im-
                                                                  pact on the HLOS wind velocity measured by Aeolus. The
In Fig. 4, we provide the flowchart of the comparison be-         schematic diagram of the vertical velocity impacts on the
tween Wind3D 6000 and WindMast PBL measurements                   HLOS wind velocity retrieval is presented in Fig. 5. Hence,
against Aeolus measurements. To ensure the quality of the         the difference between the HLOS wind velocities from CDLs
measurement data from Wind3D 6000 and WindMast PBL,               and Aeolus should be specially treated for the comparison.
we only used the CDL data with a signal-to-noise ratio (SNR)         As shown in Fig. 5, the off-nadir angle of ALADIN is 35◦ .
of > −10 dB. For Aeolus, only observations with the cor-          Because of the curvature of the earth’s surface, the viewing
responding “validity_flag” of TRUE, which is provided in          angle of the laser beam from ground becomes 37◦ , which is
the Aeolus Level 2B (L2B) product, are considered. For the        used in the vertical velocity correction. According to the pro-
comparison, only the Mie-cloudy and Rayleigh-clear wind           jection relationship, the LOS component of vertical velocity
velocities from the L2B product with estimated errors lower       is V1 = Vvertical ·cos 37◦ . Resulting from the definition of Ae-
than 4 and 8 m s−1 , respectively, are selected (Witschas et      olus HLOS wind (VHLOS = VLOS / sin 37◦ ), the influence of
al., 2020). Moreover, the Aeolus lowest-atmospheric-range         V1 on VHLOS is V2 = V1 / sin 37◦ . Consequently, the influ-
bins close to the ground are also removed from the compar-        ence of Vvertical on VHLOS is V2 = Vvertical · cos 37◦ / sin 37◦ ,
ison because the lowest-atmospheric-range bins from Aeo-          i.e. V2 = Vvertical · cot 37◦ .
lus could be contaminated by the ground. In this study, the          Thus, the relationship between HLOSCDL and HLOSAeolus
horizontal separations between the locations of CDLs and          should be expressed as
the Aeolus measurement ground track should be less than
80 km. Since the CDLs provide continuous atmospheric ob-          HLOSAeolus = HLOSCDL + Vvertical cot 37◦ .                    (2)
servations, there is no time difference between CDLs and si-
multaneous Aeolus measurements. Vertical averaging of the         HLOSAeolus is calculated from the LOS wind (V1 in Fig. 5)
CDL measurements over one Aeolus range bin is also per-           by the projection relationship. It not only includes the infor-
formed.                                                           mation of horizontal wind field but is also influenced by the
   To observe the three-dimensional wind speed and direc-         vertical speed. As introduced in Sect. 3.1, HLOSCDL is de-
tion, the Doppler beam swing (DBS) scanning mode of CDLs          cided only by the horizontal wind field measured by CDLs.

https://doi.org/10.5194/amt-15-131-2022                                                Atmos. Meas. Tech., 15, 131–148, 2022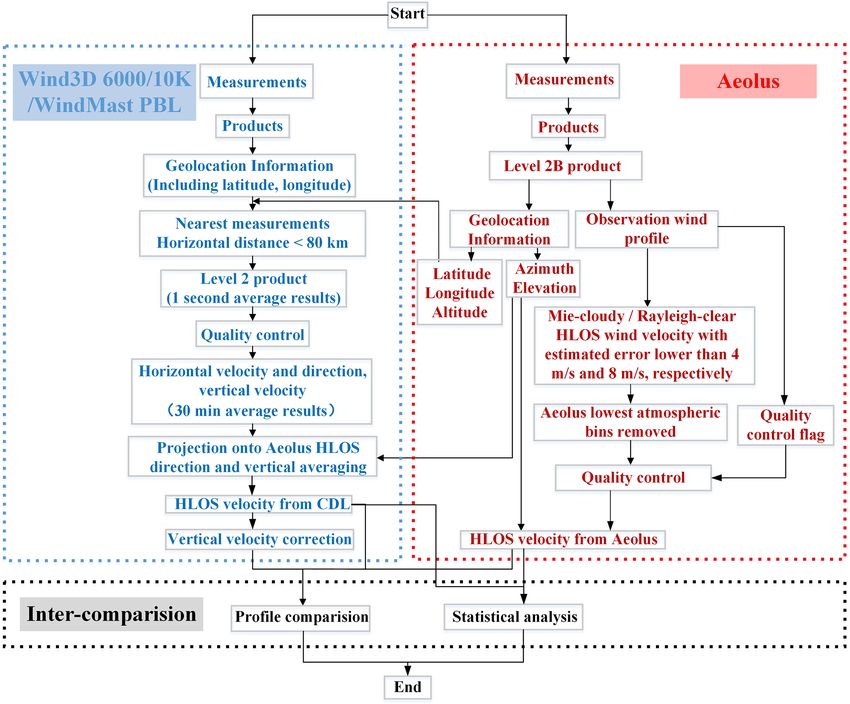
136                                                  S. Wu et al.: Inter-comparison of Aeolus and CDL network over China

Figure 2. Photos of the CDLs and the mast onto which the cup anemometers and the wind vines were mounted at the Haiyang site.

Figure 3. Evaluation tests of (a, b) Wind3D 6000 and (c, d) WindMast PBL performance by comparing their measurements against the
conventional wind measurements with mast-mounted cup anemometers and wind vanes.

Atmos. Meas. Tech., 15, 131–148, 2022                                                   https://doi.org/10.5194/amt-15-131-2022
S. Wu et al.: Inter-comparison of Aeolus and CDL network over China 137
Table 3. Overview of the specifications of cup anemometers and wind vanes used for CDL validation.
Name of Type Accuracy Sampling Height
instrument frequency
WS_50m_E First Class Advanced 4.3351.00.000 0.2 m s−1 1 Hz 50 m
WS_50m_F First Class Advanced 4.3351.00.000 0.2 m s−1 1 Hz 50 m
WD_48m First Class Vane 4.3151.00.173 1◦ 1 Hz 48 m
Table 4. Statistical results of the validation tests between Wind3D 6000, WindMast PBL and cup anemometers, and wind vines.
Specifications Wind speed from Wind direction from Wind speed from Wind direction from
Wind3D 6000 Wind3D 6000 WindMast PBL WindMast PBL
N points 1077 1077 571 571
Correlation 0.999 0.998 0.998 0.998
SD 0.14 (m s−1 ) 2.75 (◦ ) 0.14 (m s−1 ) 2.12 (◦ )
BIAS 0.07 (m s−1 ) −1.21 (◦ ) 0.07 (m s−1 ) −0.54 (◦ )
y = ax slope 1.007 0.99 1.009 0.996
y = ax + b slope 0.993 0.984 1.003 0.996
y = ax + b intercept 0.122 (m s−1 ) 0.875 (◦ ) 0.053 (m s−1 ) 0.049 (◦ )
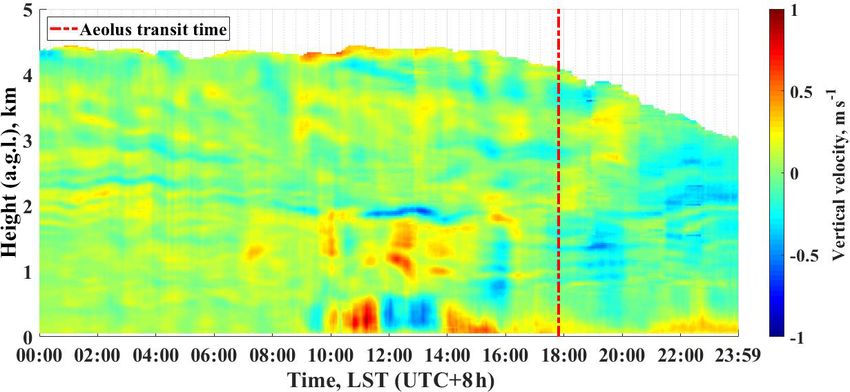
Vertical wind measurements in the atmospheric boundary 4.1 Profile comparison
layer and the lower troposphere during the validation cam-
paigns at each site are performed. In Fig. 6, one vertical- To compare the measurement results in Qingdao, the simulta-
wind-measurement case with a moving average of 30 min is neous profiles of HLOS wind velocities observed with Aeo-
provided. From this figure, it is found that the typical tempo- lus and Wind3D 6000 are provided in Fig. 7. Firstly, it should
ral average of vertical wind is ±0 to ±0.40 m s−1 . According be introduced that the Aeolus L2B data of this case were pro-
to the schematic diagram of the vertical velocity impact plot- duced by the processor Baseline 11. In this figure, the CDL-
ted in Fig. 5, the vertical wind with a speed of ±0.40 m s−1 retrieved HLOS wind velocities with and without vertical ve-
will introduce an error of up to ±0.53 m s−1 in retrieving locity correction are compared against the Aeolus Mie L2B
HLOS wind. The maximum and minimum vertical veloci- products and Rayleigh L2B products. The vertical velocity
ties are up to around 1 and −1 m s−1 , which could introduce profile is plotted as well. From this figure, it is found that
errors of ±1.33 m s−1 , respectively. Thus, the HLOS wind the Aeolus L2B Rayleigh-clear HLOS wind profile in the at-
from CDLs is corrected considering the vertical velocity ef- mospheric boundary layer and the lower troposphere is al-
fect. In Figs. 7 and 8, the CDL Vw correction (30 min) pro- most trustable, except for the lowest height bin of the Aeolus
files (yellow lines) are the corrected results by the vertical Rayleigh-clear HLOS wind profile, which has a large bias
velocity correction. It should be emphasized that, because of compared with the CDL-retrieved HLOS wind. In the aspect
the horizontal distances between the Aeolus scanning tracks of the Aeolus L2B Mie-cloudy HLOS wind profile, in the
and the ground-based CDL sites as well as the heterogeneous atmospheric boundary layer and the lower troposphere, the
atmospheric boundary layer, the vertical velocity correction synchronous CDL measurements are in the range of the esti-
is only used in the profile analysis for the method discussion, mated error provided in the Aeolus L2B product. Addition-
and the corrected CDL HLOS wind results are not used in ally, the 30 min averaged vertical velocity profile shows that
the statistical comparison. the vertical velocity is in the range of ±0.30 m s−1 , which
could introduce the error range of around ±0.40 m s−1 ac-
cording to the method provided in Sect. 3.2.
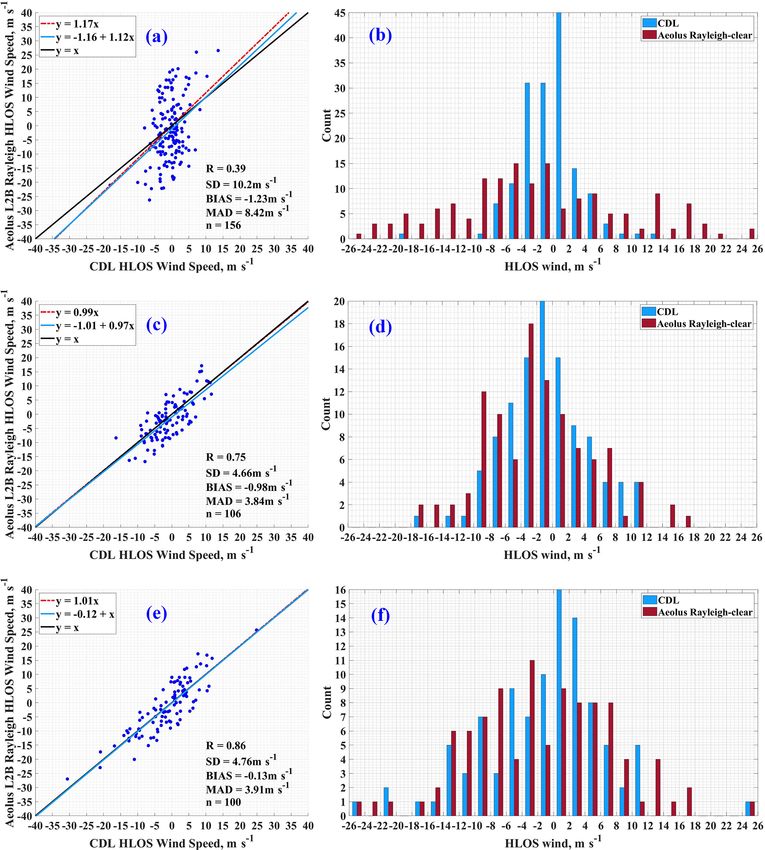
4 Results and analyses To compare the measurement results, four simultaneous
profiles of HLOS wind velocities observed with Aeolus and
In the validation campaign, the CDLs of types Wind3D 6000
CDLs on 21 January, 11 April, 18 September and 15 Novem-
and WindMast PBL are deployed at different observations
ber 2020 (UTC) at Xidazhuangke (Beijing), Lanzhou (Gansu
sites. According to the sketch illustrated in Fig. 4, the mea-
Province), Wuwei (Gansu Province) and Huludao (Liaon-
surement data from CDLs and Aeolus are processed. In this
ing Province) are shown in Fig. 8. In this figure, the CDL-
section, some examples of single profiles and a statistical
retrieved HLOS wind velocities with and without vertical
analysis are presented.
velocity correction are compared against the Aeolus L2B
Mie-cloudy products and Rayleigh-clear HLOS wind prod-
https://doi.org/10.5194/amt-15-131-2022 Atmos. Meas. Tech., 15, 131–148, 2022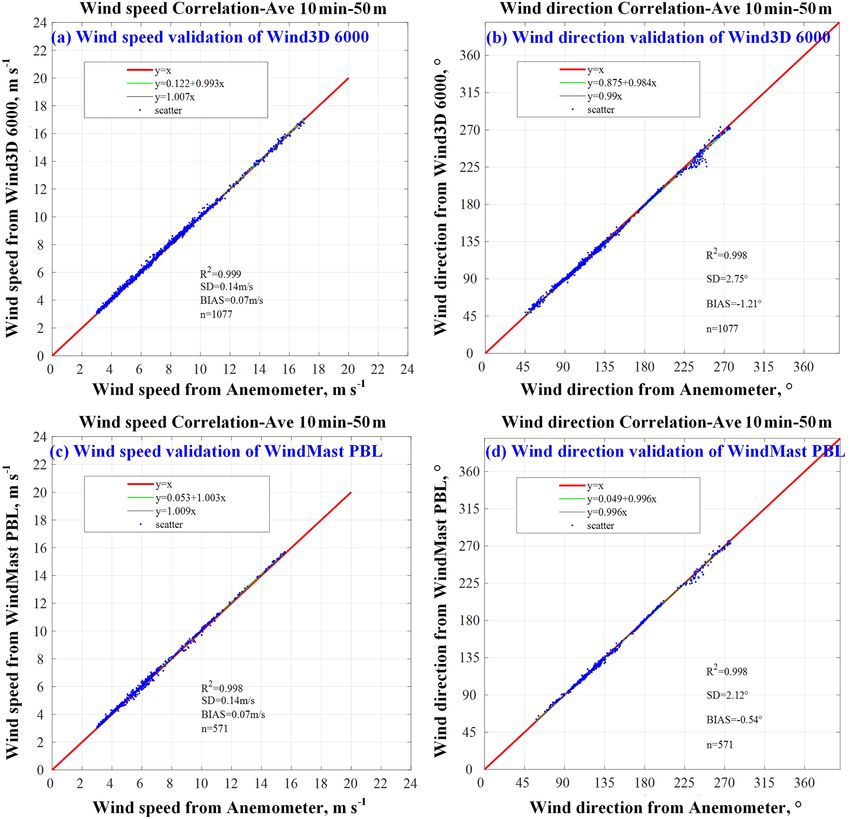
138                                                    S. Wu et al.: Inter-comparison of Aeolus and CDL network over China

Figure 4. Sketch of the comparison between CDLs and Aeolus in the atmospheric boundary layer and the lower troposphere.

Figure 5. The schematic diagram of the vertical velocity impact on the HLOS wind velocity retrieval of Aeolus.

ucts. The vertical velocity profiles are shown as well. From           files are all in the range of the estimated errors provided in
Fig. 8a, it is found that the Aeolus L2B Mie-cloudy prod-              the Aeolus L2B products. It should be emphasized that the
ucts in the atmospheric boundary layer and the lower tro-              Xidazhuangke (Beijing) case uses the Aeolus L2B HLOS
posphere fit well with the CDL-retrieved HLOS wind ve-                 wind data on 21 January, which are from Baseline 07, while
locities. In Fig. 8b, c and d, the CDL-retrieved HLOS wind             the processor of the Aeolus data in the Lanzhou (Gansu
velocities and the Aeolus L2B Rayleigh-clear HLOS wind                 Province) case on 11 April is Baseline 08, and the proces-
products agree well from the atmospheric boundary layer to             sors of the Aeolus data in the Wuwei (Gansu Province) case
the altitude of around 6 km, while the CDL-retrieved pro-              and Huludao (Liaoning Province) case on 18 September and

Atmos. Meas. Tech., 15, 131–148, 2022                                                     https://doi.org/10.5194/amt-15-131-2022
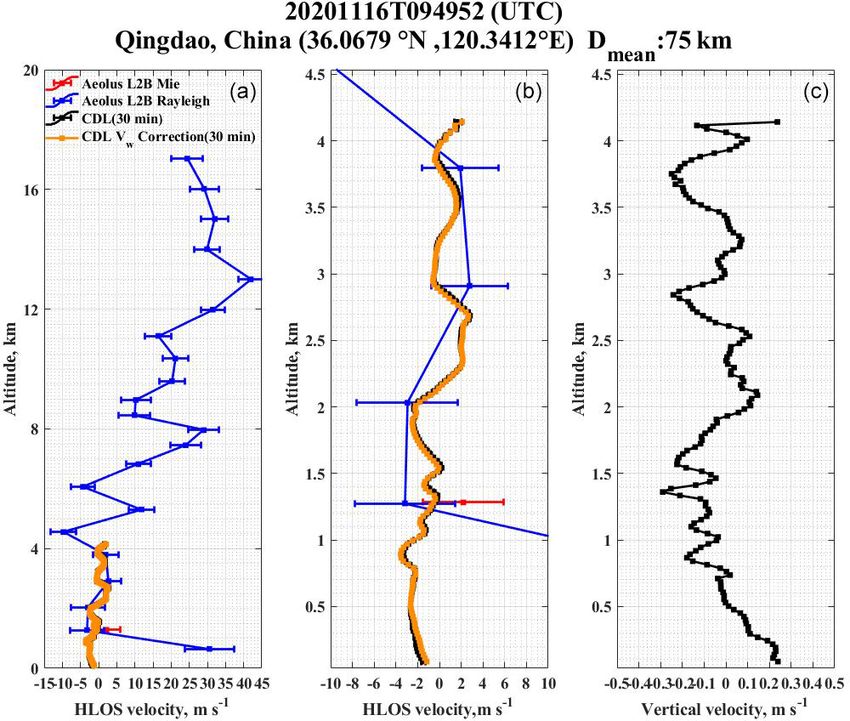
S. Wu et al.: Inter-comparison of Aeolus and CDL network over China                                                                139

Figure 6. Vertical velocity (moving average of 30 min) measured on 16 November 2020 in Qingdao (Shandong Province), China. The dashed
red line indicates the Aeolus transit time.

Figure 7. Inter-comparison of HLOS wind velocities measured with CDLs and Aeolus on 16 November 2020 at Qingdao (Shandong
Province), China. Panel (a) is the overall view of the inter-comparison result, where the red line represents the Aeolus L2B Mie-cloudy
HLOS wind profile, the blue line represents the Aeolus L2B Rayleigh-clear HLOS wind profile, the black line represents the CDL-retrieved
HLOS wind profile, and the yellow line represents the vertical-velocity-corrected CDL-retrieved HLOS wind profile. Panel (b) shows the
partial view of the inter-comparison result; the lines are the same as panel (a). Panel (c) is the vertical velocity profile.

https://doi.org/10.5194/amt-15-131-2022                                                    Atmos. Meas. Tech., 15, 131–148, 2022
140                                                  S. Wu et al.: Inter-comparison of Aeolus and CDL network over China

Figure 8. Inter-comparison of HLOS wind velocities measured with CDLs and Aeolus at (a) Xidazhuangke (Beijing), (b) Lanzhou (Gansu
Province), (c) Wuwei (Gansu Province) and (d) Huludao (Liaoning Province) on 21 January, 11 April, 18 September and 15 November 2020,
respectively. The lines are the same as those of Fig. 7.

15 November are Baseline 10 and Baseline 11, respectively.           Rayleigh-clear HLOS wind velocities than the original CDL-
It is because the adaptive bias correction based on ECMWF            retrieved HLOS wind velocities.
data and the M1 telescope temperatures, which was added
after Baseline 09 was not yet in place for Baseline 07, that         4.2   Statistical comparison
there is the noticeable bias for the Rayleigh channel winds in
the Xidazhuangke (Beijing) case (Rennie et al., 2020; Weiler         In this section, we compare the HLOS wind velocity results
et al., 2021). Besides, in the inter-comparison case of Hulu-        from Aeolus observations with the accompanying ground-
dao (Fig. 8d), in the altitude of around 1.2 to 1.7 km, the ver-     based CDL measurements. During the time period of January
tical velocity measured by CDLs is larger than 1.00 m s−1 ,          to December 2020 within the VAL-OUC campaign, 52 si-
which could introduce an error of about 1.33 m s−1 if it is          multaneous Mie-cloudy comparison pairs and 387 Rayleigh-
not considered. The vertical-velocity-corrected results (the         clear comparison pairs at 17 stations are acquired. Figure 9
yellow line) show the better agreement with the Aeolus L2B           shows the numbers of the comparison data pairs at differ-
                                                                     ent detection height ranges of the Mie-cloudy channel and
                                                                     Rayleigh-clear channel. It can be seen that the heights of the

Atmos. Meas. Tech., 15, 131–148, 2022                                                  https://doi.org/10.5194/amt-15-131-2022
S. Wu et al.: Inter-comparison of Aeolus and CDL network over China 141 Table 5. Statistical comparison of Aeolus HLOS winds and CDL- Table 6. Statistical comparison of Aeolus Rayleigh ascending and retrieved HLOS winds. descending HLOS winds and CDL-retrieved HLOS winds. Channel Mie-cloudy Rayleigh-clear Ascending and descending Ascending Descending N points 52 387 N points 127 254 Correlation 0.83 0.62 Correlation 0.65 0.51 SD (m s−1 ) 3.15 7.07 SD (m s−1 ) 5.83 7.47 Scaled MAD (m s−1 ) 2.64 5.77 Scaled MAD (m s−1 ) 4.90 6.06 BIAS (m s−1 ) −0.25 −1.15 BIAS (m s−1 ) −0.16 −2.00 y = ax slope 0.93 1.00 y = ax slope 1.02 0.97 y = ax + b slope 0.92 0.96 y = ax + b slope 1.03 0.78 y = ax + b intercept (m s−1 ) −0.33 −1.20 y = ax + b intercept (m s−1 ) −0.23 −2.61 comparison pairs are mainly in and close to the atmospheric boundary layer and the lower troposphere. 5.83 m s−1 , 4.90 m s−1 and −0.16 m s−1 , respectively, while In Fig. 10, the Mie-cloudy HLOS wind velocities and the y = ax slope, y = ax + b slope and y = ax + b inter- Rayleigh-clear HLOS wind velocities from Aeolus are com- cept are 1.02, 1.03 and −0.23 m s−1 . Figure 11c shows the pared with those from CDLs, respectively. Figure 10a comparison between the Aeolus descending measurements presents the scatter diagram of Aeolus L2B Mie-cloudy against those from CDLs. The correlation coefficient, the HLOS wind and CDL HLOS wind. A total of 52 mea- standard deviation, the scaled MAD and the bias are 0.51, surement cases for Mie-cloudy winds are available for the 7.47 m s−1 , 6.06 m s−1 and −2.00 m s−1 , respectively. Be- comparison. From this result, the correlation coefficient, sides, the y = ax slope, y = ax + b slope and y = ax + b the standard deviation, the scaled mean absolute devia- intercept are 0.97, 0.78 and −2.61 m s−1 . Consequently, the tion (MAD) and the bias are 0.83, 3.15 m s−1 , 2.64 m s−1 standard deviation, the scaled MAD and the bias on ascend- and −0.25 m s−1 , respectively, while the y = ax slope, y = ing tracks are lower than those on descending tracks. It can ax + b slope and y = ax + b intercept are 0.93, 0.92 and especially be found that the significantly negative bias ex- −0.33 m s−1 . In Fig. 10c, the scatter diagram of Aeolus L2B ists in the comparison result of descending HLOS wind and Rayleigh-clear HLOS wind and CDL HLOS wind data is CDL-retrieved HLOS wind. The statistic results are summa- plotted. There are 387 comparisons taken into consideration. rized in Table 6. The count comparison histograms of Aeo- Accordingly, the correlation coefficient, the standard devi- lus Rayleigh ascending and descending HLOS winds against ation, the scaled MAD and the bias are 0.62, 7.07 m s−1 , CDL-retrieved HLOS winds are presented in Fig. 11b and d 5.77 m s−1 and −1.15 m s−1 , respectively, while the y = ax individually. slope, y = ax + b slope and y = ax + b intercept are 1.00, Since the time period for the comparison of Aeolus and 0.96 and −1.20 m s−1 . Table 5 summarizes the statistical re- CDL synchronous measurements lasted during 2020, the sults of the comparison. It should be emphasized that before baselines of the Aeolus product changed accordingly dur- these comparisons are made, the outlier control is first con- ing this period (Rennie et al., 2020). From Baseline 07 to ducted. The data with HLOS wind differences larger than Baseline 08 of the L2B wind product processor, the associ- 1 standard deviation (5.89 m s−1 for the Mie-cloudy chan- ated new auxiliary file carrying the parameters needed for the nel and 14.08 m s−1 for the Rayleigh-clear channel) are re- M1 mirror temperature correction was provided but not used moved and are not considered. For Mie-cloudy HLOS wind in the L2B processing. After the deployment of Baseline 09, and Rayleigh-clear HLOS wind, 15 (22.39 %) comparison the new auxiliary file with the M1 mirror temperature correc- pairs and 94 (19.54 %) comparison pairs are removed, re- tion parameters was used, thus correcting for the associated spectively. Figure 10b and d show statistic histograms of the biases in the L2B wind product. The bias-corrected dataset count comparison between CDL-retrieved HLOS wind and consists of Baseline 09 data from 1 to 20 April 2020 and Aeolus Mie-cloudy HLOS wind and between CDL-retrieved Baseline 10 data from 20 April to 8 October 2020 and the HLOS wind and Aeolus Rayleigh-clear HLOS wind. FM-B low-bias reprocessed dataset of 28 June to 31 Decem- Additionally, the scatter plots and the statistics histograms ber 2019. With the Baseline 11 processor deployed, different of Aeolus Rayleigh-clear HLOS wind against the CDL- SNR thresholds for classification of Mie and Rayleigh and retrieved HLOS wind according to the measurements made an option to transfer Mie SNR results to the Rayleigh chan- on ascending and descending tracks are presented individ- nel were added, which allows SNR-based classification to be ually in Fig. 11. Figure 11a indicates the comparison be- done for the Rayleigh channel, resulting in a clear quality tween the Aeolus ascending measurements against those improvement. Therefore, to evaluate the impact of updating from CDLs. It is found that the correlation coefficient, the baseline products on the HLOS wind measurements, the Ae- standard deviation, the scaled MAD and the bias are 0.65, olus L2B Rayleigh-clear HLOS wind data from Baselines 07 https://doi.org/10.5194/amt-15-131-2022 Atmos. Meas. Tech., 15, 131–148, 2022
142                                                      S. Wu et al.: Inter-comparison of Aeolus and CDL network over China

Figure 9. Counts of data pairs at different height ranges of (a) Mie-cloudy vs. CDL and (b) Rayleigh-clear vs. CDL.

Figure 10. Comparisons of Aeolus L2B Rayleigh-clear HLOS wind velocities and Mie-cloudy HLOS wind velocities against those from
CDLs. In panels (a) and (c), the dotted red lines represent the y = ax fitting lines, the blue lines represent the y = ax + b fitting lines, and
the black lines represent the y = x reference line. Panels (b) and (d) show the histogram of HLOS wind velocities, where the blue columns
represent the count of CDL HLOS wind velocities, and the red columns represent the count of Aeolus HLOS wind velocities.

and 08, Baselines 09 and 10, and Baseline 11 are compared                 duced with the Baselines 07 and 08, the measurements be-
against the CDL-retrieved data individually in Fig. 12a, c and            tween May and September 2020 are with the Baselines 09
e.                                                                        and 10, and the rest of the measurements from October 2020
   During the comparison period, the Aeolus L2B HLOS                      are supported by Baseline 11. In Fig. 12a, the scatter plot for
wind measurements between January and April 2020 are pro-                 the Aeolus L2B Rayleigh-clear HLOS wind with the Base-

Atmos. Meas. Tech., 15, 131–148, 2022                                                          https://doi.org/10.5194/amt-15-131-2022
S. Wu et al.: Inter-comparison of Aeolus and CDL network over China                                                           143

Figure 11. Comparisons of Aeolus Rayleigh-clear HLOS wind against the CDL-retrieved HLOS wind according to the measurements made
on (a, b) ascending and (c, d) descending tracks. The lines and the histograms represent the same as those of Fig. 10.

lines of 07 and 08 is provided, from which it can be found        Table 7. Statistical comparison of Aeolus Rayleigh HLOS winds of
that the correlation coefficient is 0.39, and the standard de-    different baselines and CDL-retrieved HLOS winds.
viation, the scaled MAD and the bias are 10.20, 8.42 and
−1.23 m s−1 , respectively. Hence the Aeolus products with            Baselines                       07 and   09 and      11
Baselines 07 and 08 need to be calibrated further. From the                                               08       10
results shown in Fig. 12c and e, thanks to the M1 mirror              N points                          156      106      100
temperature correction from the Baseline 08 processor to the          Correlation                      0.39     0.75     0.86
Baseline 09 processor, the correlation coefficients, the stan-        SD (m s−1 )                     10.20     4.66     4.76
dard deviations, the scaled MAD and the biases are signif-            Scaled MAD (m s−1 )              8.42     3.84     3.91
icantly improved compared to those from Baselines 07 and              BIAS (m s−1 )                   −1.23    −0.98    −0.13
08. The correlation coefficient reaches 0.75 (0.86) for the           y = ax slope                     1.17     0.99     1.01
scatter plot with Baselines 09 and 10 (Baseline 11). The              y = ax + b slope                 1.12     0.97     1.00
corresponding standard deviation and scaled MAD decrease              y = ax + b intercept (m s−1 )   −1.16    −1.01    −0.12
to 4.66 m s−1 (4.76 m s−1 ) and 3.84 m s−1 (3.91 m s−1 ), and
the bias is suppressed to −0.98 m s−1 (−0.13 m s−1 ) during
the comparison with Baselines 09 and 10 (Baseline 11). The        5   Discussion
statistical comparison results are also presented in Table 7.
From Fig. 12b, d and f, the count histograms of comparison        The statistical results in Sect. 4.2 show the inter-comparison
also show the significant improvement of the comparison re-       consequence of the VAL-OUC campaign of Aeolus and
sults from Baselines 07 and 08 to Baselines 09 and 10 and         ground-based CDLs. Because of the limited measurement
Baseline 11.                                                      height of CDLs, the HLOS wind data involved in the vali-
                                                                  dation, which are produced by Aeolus and CDLs individu-

https://doi.org/10.5194/amt-15-131-2022                                                Atmos. Meas. Tech., 15, 131–148, 2022
144 S. Wu et al.: Inter-comparison of Aeolus and CDL network over China Figure 12. The comparison between the Aeolus L2B Rayleigh HLOS wind data from (a, b) Baselines 07 and 08, (c, d) Baselines 09 and 10, and (e, f) Baseline 11 against the CDL-retrieved HLOS wind data. The lines and the histograms represent the same as those of Fig. 10. ally, are mainly in the PBL. It is summarized that, for the standard deviation, the scaled MAD and the bias are 0.83, Rayleigh-clear winds, the correlation coefficient, the stan- 3.15 m s−1 , 2.64 m s−1 and −0.25 m s−1 , while the y = ax + dard deviation, the scaled MAD and the bias are 0.62, b slope and intercept are 0.92 and −0.33 m s−1 . 7.07 m s−1 , 5.77 m s−1 and −1.15 m s−1 , respectively, while Additionally, we summarized the recent comparison cam- the y = ax + b slope and intercept are 0.96 and −1.20 m s−1 . paigns from the Cal/Val teams all over the world. The corre- For the Mie-cloudy winds, the correlation coefficient, the sponding comparison results are also presented in Table 8a Atmos. Meas. Tech., 15, 131–148, 2022 https://doi.org/10.5194/amt-15-131-2022
S. Wu et al.: Inter-comparison of Aeolus and CDL network over China                                                                                145

Table 8. Summary of the recent comparison campaign validation results: (a) Rayleigh-clear, (b) Mie-cloudy.

  (a) Rayleigh-clear
  Campaigns and instruments                                     R             SD,    Scaled MAD,             Bias,          Slope         Intercept,
                                                                            m s−1           m s−1           m s−1                             m s−1
  VAL-OUC (this study)                                       0.62            7.07            5.77           −1.15            0.96            −1.20
  WindVal III/A2D (Lux et al., 2020a)                        0.80             3.6             3.6              2.6              –                 –
  WindVal III/2 µm DWL (Witschas et al., 2020)               0.95            4.75            3.97             2.11           0.99              2.23
  AVATARE (Witschas et al., 2020)                            0.76            5.27            4.36           −4.58            0.98            −4.39
  AboVE-OHP (Khaykin et al., 2020)                           0.96             3.2              –               1.5              –                 –
  RV Polarstern cruise PS116 (Baars et al., 2020)               –               –            4.84             1.52           0.97              1.57
  MARA                    In summer                          0.82             5.8              –              0.0             1.1              0.0
  (Belova et al., 2021)   In winter                          0.81             5.6              –             −1.3            0.87             −0.8
  ESRAD                   In summer                          0.92             4.5              –             −0.4             1.0             −0.5
  (Belova et al., 2021)   In winter                          0.88             5.2              –             −0.4             1.0             −0.6
  WPR over Japan          Baseline 2B02                      0.95            8.08            7.35            1.69            0.98             1.75
  (Iwai et al., 2021)     Baseline 2B10                      0.90            7.89            7.08           −0.82            0.94            −0.74
  CDWL in Kobe            Baseline 2B02                      0.98            6.17            4.92            0.46            1.05             0.61
  (Iwai et al., 2021)     Baseline 2B10                      0.96            5.69            5.21           −0.81            0.98            −0.88
  CDWL in Okinawa         Baseline 2B02                      0.93            6.57            5.68            1.08            0.99             1.07
  (Iwai et al., 2021)     Baseline 2B10                      0.79            6.53            5.58           −0.48            1.03            −0.52
  GPS-RS in Okinawa       Baseline 2B02                      0.99            4.55            4.77             1.00           0.99              1.00
  (Iwai et al., 2021)     Baseline 2B10                      0.99            4.43            3.97             0.45           1.01              0.38
  RWP network over China (Guo et al., 2021b)                 0.94             4.2              –            −0.28            1.01            −0.41
  (b) Mie-cloudy
  Campaigns and instruments                                     R             SD,    Scaled MAD,             Bias,          Slope         Intercept,
                                                                            m s−1           m s−1           m s−1                             m s−1
  VAL-OUC (this study)                                       0.83            3.15            2.64           −0.25            0.92            −0.33
  WindVal III/A2D (Lux et al., 2020a)                           –               –              –                –               –                 –
  WindVal III/2 µm DWL (Witschas et al., 2020)               0.92            2.95            2.24             2.26           0.96               2.7
  AVATARE (Witschas et al., 2020)                            0.91            3.02            2.22           −0.17            1.01            −0.21
  AboVE-OHP (Khaykin et al., 2020)                              –               –              –                –               –                 –
  RV Polarstern cruise PS116 (Baars et al., 2020)               –               –            1.58             0.95           0.95              1.13
  MARA                    In summer                 0.63 (ascend);   6.8 (ascend);             –     6.6 (ascend);   1.0 (ascend);    6.5 (ascend);
  (Belova et al., 2021)                             0.72 (descend)   6.5 (descend)                  −0.5 (descend)   1.3 (descend)   −2.4 (descend)
                          In winter                 0.73 (ascend);   5.7 (ascend);             –    −1.0 (ascend);   1.1 (ascend);    0.4 (ascend);
                                                    0.70 (descend)   5.6 (descend)                   0.9 (descend)   1.2 (descend)   −1.2 (descend)
  ESRAD                   In summer                 0.76 (ascend);   4.7 (ascend);             –     0.5 (ascend);   0.8 (ascend);    0.5 (ascend);
  (Belova et al., 2021)                             0.90 (descend)   5.5 (descend)                   0.7 (descend)   0.8 (descend)    0.2 (descend)
                          In winter                 0.91 (ascend);   3.9 (ascend);             –     2.4 (ascend);   1.0 (ascend);    2.3 (ascend);
                                                    0.85 (descend)   5.2 (descend)                   0.9 (descend)   0.9 (descend)    0.5 (descend)
  WPR over Japan          Baseline 2B02                      0.95            6.83            5.94            2.42            0.98             2.44
  (Iwai et al., 2021)     Baseline 2B10                      0.93            6.47            5.66           −0.51            0.96            −0.44
  CDWL in Kobe            Baseline 2B02                      0.98            4.80            3.55             1.63           1.05              1.76
  (Iwai et al., 2021)     Baseline 2B10                      0.97            5.15            3.92             0.16           1.02              0.22
  CDWL in Okinawa         Baseline 2B02                      0.97            3.64            3.76            2.38            1.01             2.37
  (Iwai et al., 2021)     Baseline 2B10                      0.86            4.74            3.86           −0.26            0.86            −0.04
  GPS-RS in Okinawa       Baseline 2B02                      0.97            4.52            4.14            2.15            0.97             2.07
  (Iwai et al., 2021)     Baseline 2B10                      0.95            5.81            3.99           −0.71            0.92            −0.22
  RWP network over China (Guo et al., 2021b)                 0.81            6.82              –            −0.64            0.99            −0.67

https://doi.org/10.5194/amt-15-131-2022                                                               Atmos. Meas. Tech., 15, 131–148, 2022
146 S. Wu et al.: Inter-comparison of Aeolus and CDL network over China
and b. From Table 8, the statistical parameters including and −1.15 m s−1 , respectively, while the y = ax slope, the
correlation coefficient, SD, MAD, bias, slope and intercept y = ax + b slope and the y = ax + b intercept are 1.00, 0.96
of recent calibration and validation campaigns show con- and −1.20 m s−1 . Besides, the scatter diagrams and the count
sistent tendency and similar comparison results. The devi- histogram of Aeolus Rayleigh-clear HLOS wind according
ations among all of these studies may result from the differ- to the measurements made on ascending and descending
ences in operation strategies, spatial distances and temporal tracks against the synchronous CDL-retrieved HLOS wind
gaps. In summary, considering that this study conducts the are plotted individually. It is found that the standard devi-
inter-comparison with the data pairs mainly in the hetero- ation and bias on ascending tracks are lower than those on
geneous atmospheric boundary layer, the statistical results descending tracks. The significantly negative bias especially
of this study are reasonable and significant due to the long exists in the Aeolus Rayleigh-clear descending HLOS wind
time period and large number of ground sites included for comparison results. Moreover, to evaluate the accuracy of
the comparison over China. Aeolus HLOS wind measurements with the baseline update,
the Aeolus L2B Mie-cloudy and Rayleigh-clear HLOS wind
data under Baselines 07 and 08, Baselines 09 and 10, and
6 Summary and conclusion Baseline 11 are compared against the CDL-retrieved HLOS
wind data, respectively. From the comparison results, marked
To evaluate the accuracy and precision of the Aeolus- misfits between the wind data from Aeolus Baselines 07 and
retrieved wind results, ground-based coherent Doppler wind 08 and wind data from CDLs in the atmospheric bound-
lidars were deployed at 17 observation stations over China ary layers and the lower troposphere are found. After that,
for simultaneous measurements under the framework of the the M1 mirror temperature bias correction processor was de-
VAL-OUC campaign from January to December 2020. To ployed, and new Rayleigh channel thresholds were added, re-
ensure the quality of the measurement data from CDLs, only sulting in the significant improvement in the performances of
wind observations with SNR > −10 dB are utilized. Mie- Aeolus wind measurements under Baselines 09, 10 and 11. It
cloudy and Rayleigh-clear wind velocities from the Aeolus has to be emphasized that the misfit may result from the con-
L2B are selected with the corresponding “validity_flag” of tamination of the Mie backscatter signal from the Rayleigh
TRUE with estimated errors lower than 4 and 8 m s−1 , re- backscatter signal, which introduces errors to the retrieval of
spectively. Moreover, the Aeolus lowest-atmospheric-range Rayleigh-clear HLOS wind velocity. Additionally, the dis-
bins close to the ground are removed from the comparison. tance between the CDL sites and the footprint of Aeolus and
In this study, the horizontal distance between the locations the strong small-scale dynamics field may cause differences.
of CDLs and the Aeolus footprints must be less than 80 km. Finally, the statistical results of recent Aeolus wind product
Since the CDLs provide continuous atmospheric observa- calibration and validation campaigns that have been reported
tions with a temporal resolution of 1 min, there is no time so far are summarized and compared. It is figured out that
difference between CDL and simultaneous Aeolus measure- this study acquired similar results compared with other recent
ments. Vertical averaging of the CDL-produced wind mea- inter-comparison campaigns, and all the comparison results
surements over Aeolus range bins is performed. Overall, af- show a consistent tendency.
ter the strict quality control introduced above, 52 simulta- In the atmospheric boundary layer and the lower tropo-
neous Mie-cloudy comparison pairs and 387 Rayleigh-clear sphere, the vertical velocity from convection and turbulence
comparison pairs from this campaign are acquired. could influence the comparison due to the impact of verti-
Using the simultaneous wind measurements with CDLs cal velocity on the HLOS wind velocity retrieval from Aeo-
and Aeolus, the Rayleigh-clear HLOS wind velocities and lus. Hence, a method is described to use the vertical velocity
Mie-cloudy HLOS wind velocities from Aeolus are com- measured with the CDLs to project onto the Aeolus LOS di-
pared with those from CDLs, respectively. All of the rection and consider it for the comparison.
Aeolus-produced L2B Mie-cloudy HLOS wind, Rayleigh-
clear HLOS wind and CDL-produced HLOS wind are com-
pared individually. A total of 52 measurement cases for Data availability. The Aeolus data are downloaded via the web-
Mie-cloudy winds could be identified for the comparison. site https://aeolus-ds.eo.esa.int/oads/access/collection (last access:
From this statistical result, the correlation coefficient, the 23 August 2021) (ESA, 2021). The presented work includes pre-
standard deviation, the scaled MAD and the bias are 0.83, liminary data (not fully calibrated or validated and not yet pub-
licly released) of the Aeolus mission, which is part of the European
3.15 m s−1 , 2.64 m s−1 and −0.25 m s−1 , respectively, while
Space Agency (ESA) Earth Explorer programme. This includes
the y = ax slope, the y = ax + b slope and the y = ax + b
wind products from before the public data release in May 2020
intercept are 0.93, 0.92 and −0.33 m s−1 . For Aeolus L2B and/or aerosol and cloud products, which have not yet been pub-
Rayleigh-clear HLOS wind and CDL HLOS wind data, 387 licly released. The preliminary Aeolus wind products will be repro-
valid observations could be used for the comparison. Accord- cessed during 2020 and 2021 and will include in particular a signifi-
ingly, the correlation coefficient, the standard deviation, the cant L2B product wind bias reduction and improved L2A radiomet-
scaled MAD and the bias are 0.62, 7.07 m s−1 , 5.77 m s−1 ric calibration. Aerosol and cloud products became publicly avail-
Atmos. Meas. Tech., 15, 131–148, 2022 https://doi.org/10.5194/amt-15-131-2022S. Wu et al.: Inter-comparison of Aeolus and CDL network over China 147
able on 12 July 2021. The processor development, improvement References
and product reprocessing preparation are performed by the Aeo-
lus DISC (Data, Innovation and Science Cluster), which involves
DLR, DoRIT, ECMWF, KNMI, CNRS, S&T, ABB and Serco, in Baars, H., Herzog, A., Heese, B., Ohneiser, K., Hanbuch, K.,
close cooperation with the Aeolus PDGS (Payload Data Ground Hofer, J., Yin, Z., Engelmann, R., and Wandinger, U.: Valida-
Segment). The analysis has been performed in the framework of tion of Aeolus wind products above the Atlantic Ocean, At-
the Aeolus Scientific Calibration and Validation Team (ACVT). To mos. Meas. Tech., 13, 6007–6024, https://doi.org/10.5194/amt-
get the CDL data please contact Songhua Wu (wush@ouc.edu.cn) 13-6007-2020, 2020.
at the Ocean University of China. Bedka, K. M., Nehrir, A. R., Kavaya, M., Barton-Grimley, R.,
Beaubien, M., Carroll, B., Collins, J., Cooney, J., Emmitt, G. D.,
Greco, S., Kooi, S., Lee, T., Liu, Z., Rodier, S., and Skofronick-
Author contributions. SW contributed to the study design for inter- Jackson, G.: Airborne lidar observations of wind, water vapor,
comparison of wind measurement with Aeolus and ground-based and aerosol profiles during the NASA Aeolus calibration and val-
coherent Doppler lidar in the PBL over China. KS, GD, SW and OR idation (Cal/Val) test flight campaign, Atmos. Meas. Tech., 14,
contributed to the data analyses. GD and KS wrote the manuscript. 4305–4334, https://doi.org/10.5194/amt-14-4305-2021, 2021.
XiaW, XL, BL and XS helped in programming. KS downloaded the Belova, E., Kirkwood, S., Voelger, P., Chatterjee, S., Satheesan,
Aeolus data. RL, JY and XitW prepared and operated the CDLs. All K., Hagelin, S., Lindskog, M., and Körnich, H.: Validation
the co-authors discussed the results and reviewed the manuscript. of Aeolus winds using ground-based radars in Antarctica and
in northern Sweden, Atmos. Meas. Tech., 14, 5415–5428,
https://doi.org/10.5194/amt-14-5415-2021, 2021.
Chanin, M., Garnier, A., Hauchecorne, A., and Porteneuve, J.: A
Competing interests. The contact author has declared that neither
Doppler lidar for measuring winds in the middle atmosphere,
they nor their co-authors have any competing interests.
Geophys. Res. Lett., 16, 1273–1276, 1989.
ESA: The four candidate Earth Explorer core missions – Atmo-
spheric Dynamics Mission, ESA Report for Mission Selection
Disclaimer. Publisher’s note: Copernicus Publications remains ESA SP-1233, Noordwijk, the Netherlands, 145 pp., 1999.
neutral with regard to jurisdictional claims in published maps and ESA: ADM-Aeolus Science Report, ESA SP-1311, Noordwijk, the
institutional affiliations. Netherlands, 121 pp., 2008.
ESA: ESA Aeolus Online Dissemination System, ESA [data set],
available at: https://aeolus-ds.eo.esa.int/oads/access/collection,
Special issue statement. This article is part of the special issue “Ae- last access: 23 August 2021.
olus data and their application (AMT/ACP/WCD inter-journal SI)”. Flesia, C. and Korb, C. L.: Theory of the double-edge molecular
It is not associated with a conference. technique for Doppler lidar wind measurement, Appl. Optics, 38,
432–440, 1999.
Guo, J., Zhang, J., Yang, K., Liao, H., Zhang, S., Huang, K., Lv,
Acknowledgements. We thank our colleagues including Xi- Y., Shao, J., Yu, T., Tong, B., Li, J., Su, T., Yim, S. H. L., Stof-
aomin Chen, Qichao Wang and Xiangying E from Ocean Univer- felen, A., Zhai, P., and Xu, X.: Investigation of near-global day-
sity of China (OUC) for the discussion and the suggestion during time boundary layer height using high-resolution radiosondes:
the data analyses; Dahai Wang from Qingdao Leice Transient Tech- first results and comparison with ERA5, MERRA-2, JRA-55,
nology Co., Ltd. for preparing and operating the CDLs. We also and NCEP-2 reanalyses, Atmos. Chem. Phys., 21, 17079–17097,
thank the Aeolus Cal/Val teams who gave advice on this work dur- https://doi.org/10.5194/acp-21-17079-2021, 2021a.
ing the workshop of Aeolus. This work was also supported by the Guo, J., Liu, B., Gong, W., Shi, L., Zhang, Y., Ma, Y., Zhang,
Dragon 4 and Dragon 5 programmes, which were conducted by the J., Chen, T., Bai, K., Stoffelen, A., de Leeuw, G., and Xu,
European Space Agency (ESA) and the National Remote Sensing X.: Technical note: First comparison of wind observations from
Center of China (NRSCC) under grants 32296 and 59089. ESA’s satellite mission Aeolus and ground-based radar wind pro-
filer network of China, Atmos. Chem. Phys., 21, 2945–2958,
https://doi.org/10.5194/acp-21-2945-2021, 2021b.
Financial support. This research has been supported by the Na- IEC: Wind turbines – Part 12-1: Power performance measurements
tional Key Research and Development Program of China (grant of electricity producing wind turbines, IEC 61400-12-1, Edition
no. 2019YFC1408001), the Key Technology Research and Devel- 2 Committee Draft, Geneva, Switzerland, 2011.
opment Program of Shandong (grant no. 2019GHZ023), and the Iwai, H., Aoki, M., Oshiro, M., and Ishii, S.: Validation of Ae-
National Natural Science Foundation of China (grant nos. 61975191 olus Level 2B wind products using wind profilers, ground-
and 41905022). based Doppler wind lidars, and radiosondes in Japan, Atmos.
Meas. Tech., 14, 7255–7275, https://doi.org/10.5194/amt-14-
7255-2021, 2021.
Review statement. This paper was edited by Ad Stoffelen and re- Kanitz, T., Lochard, J., Marshall, J., McGoldrick, P., Lecrenier, O.,
viewed by two anonymous referees. Bravetti, P., Reitebuch, O., Rennie, M., Wernham, D., and Elfv-
ing, A.: Aeolus first light: first glimpse, International Confer-
ence on Space Optics – ICSO 2018, Crete, Greece, 9–12 October
2018, 111801R, 2018.
https://doi.org/10.5194/amt-15-131-2022 Atmos. Meas. Tech., 15, 131–148, 2022You can also read