Seismic signature of the COVID-19 lockdown at the city scale: a case study with low-cost seismometers in the city of Querétaro, Mexico - Solid Earth
←
→
Page content transcription
If your browser does not render page correctly, please read the page content below
Solid Earth, 12, 713–724, 2021
https://doi.org/10.5194/se-12-713-2021
© Author(s) 2021. This work is distributed under
the Creative Commons Attribution 4.0 License.

Seismic signature of the COVID-19 lockdown at the city scale:
a case study with low-cost seismometers in the city
of Querétaro, Mexico
Raphael S. M. De Plaen1 , Víctor Hugo Márquez-Ramírez1 , Xyoli Pérez-Campos2 , F. Ramón Zuñiga1 ,
Quetzalcoatl Rodríguez-Pérez1 , Juan Martín Gómez González1 , and Lucia Capra1
1 Centro   de Geociencias, Universidad Nacional Autónoma de México, Juriquilla, Querétaro, Mexico
2 Instituto de Geofísica, Universidad Nacional Autónoma de México, Mexico City, Mexico

Correspondence: Raphael S. M. De Plaen (raphael.deplaen@geociencias.unam.mx)

Received: 19 November 2020 – Discussion started: 4 December 2020
Revised: 26 January 2021 – Accepted: 29 January 2021 – Published: 25 March 2021

Abstract. Seismometers have detected the social response to      14 March and progressively evolved to a full suspension
lockdown measures implemented following the onset of the         of non-essential activities on 24 March with the “quédate
COVID-19 pandemic in cities around the world. This long-         en casa” (“stay at home”) campaign (Secretaría de Salud,
lasting pandemic has been a particular challenge in coun-        2020a). Lockdown measures came to a slow, progressive
tries such as Mexico, where the informal economy consti-         relaxation from 1 June after authorities declared the inten-
tutes most of the working population. This context motivated     tion to gradually reopen the economy (Secretaría de Salud,
the monitoring of the mobility of populations throughout the     2020b).
various phases of lockdown measures independently of peo-           The response to lockdown measures in Mexico is of partic-
ple’s access to the internet and mobile technology.              ular interest as it is challenged by the high level of informal
   Here we use the variation of anthropogenic seismic noise      economic activity in the country (∼ 60 %; OECD Economic
in the city of Querétaro (central Mexico) recorded by a net-     Surveys; Economic and Development Review Committee,
work of low-cost Raspberry Shake seismic stations to study       2019). Activities of the informal economy, excluding illicit
the spatial and temporal variation of human activity in the      ones, are not taxed, regulated, or monitored by any form of
city throughout the pandemic and during sporting events. The     government and as a result are not subject to social protection
results emphasize the importance of densifying urban seis-       or other types of employment benefits (OECD/ILO, 2019).
mic networks and of tracking human activities without the        Workers and economic units participating in this economy
privacy concerns associated with mobile technology.              do not have access to secure work, benefits, welfare protec-
                                                                 tion, or representation, already generating significant risks
                                                                 and vulnerabilities in regular times that are dramatically ex-
                                                                 acerbated during the COVID-19 pandemic. The uncertainty
1   Introduction                                                 that arises from this reality is further motivation to monitor
                                                                 and characterize how the lockdown measures were followed
In early 2020, the COVID-19 pandemic took the world by           in the country to better understand the impact of the pan-
surprise, and, given the absence of a treatment or vaccine, it   demic on the different portions of the population and help in-
forced the implementation of lockdown measures to prevent        form the response of public health agencies and government
its spread. Like other countries in the world, Mexico progres-   officials.
sively implemented confinement measures after the World             Since the beginning of the crisis, community mobility data
Health Organization declared it a pandemic on 11 March           published by tech and social media companies have signifi-
(WHO, 2020). The first confinement measures, focused on          cantly contributed to the analysis of social behavior changes
closing schools and university campuses, were declared on        following lockdown measures. However, these data result

Published by Copernicus Publications on behalf of the European Geosciences Union.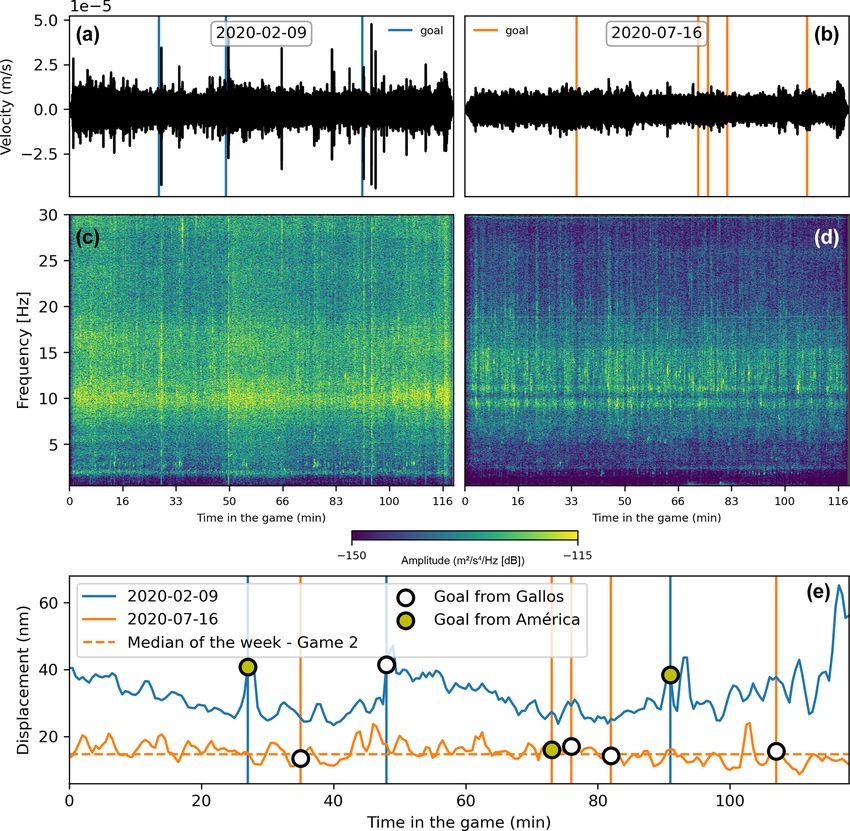
714                                   R. S. M. De Plaen et al.: Seismic signature of the COVID-19 lockdown at the city scale

from aggregates of the personal history of user time spent at
different categories of activities, which is likely to trigger pri-
vacy concerns, although it has undergone anonymization pro-
cedures (Aktay et al., 2020). Such tools are also confronted
with the limitations of access to the internet, especially cre-
ating a digital connectivity divide in rural areas, combined
with the potentially limited utilization of smartphones. For
instance, internet adoption in rural areas of Mexico is esti-
mated at 39.2 % in rural areas with 53.8 % of the popula-
tion owning smartphones. In contrast, 71.2 % of urban resi-
dents have access to the internet and 77.7 % use smartphones
(Martínez-Domínguez and Mora-Rivera, 2020).
   Recently, anthropogenic seismic noise has also proven to
be a good proxy for the reduction of human activities that
followed the 2020 lockdown measures worldwide, especially
near urban areas (e.g., Cannata et al., 2021; Dias et al., 2020;
Lecocq et al., 2020; Poli et al., 2020; Xiao et al., 2020). This
phenomenon, although well documented at a global scale,
has yet to be analyzed in Mexico, which typically benefits
from high seismic station coverage as a result of its signifi-
cant seismicity. Anthropogenic seismic signals are generated
by a wide range of sources from traffic to sporting and cul-
                                                                      Figure 1. The seismic network of the metropolitan zone of Queré-
tural events (e.g., Diaz et al., 2020; Green and Bowers, 2008;        taro. The inverted triangles are the locations of the stations used in
Riahi and Gerstoft, 2015). When applied to the observation            this study. The square in the inset shows the location of the city of
of the impact of confinement and social distancing measures,          Querétaro (map tiles by Stamen Design under CC BY 3.0, data by
anthropogenic noise offers a perspective on the scale of the          © OpenStreetMap contributors, 2020; distributed under a Creative
unprecedented measures authorities had to take to mitigate            Commons BY-SA License).
the spread of the pandemic. In most cases in the literature,
anthropogenic seismic noise amplitude correlates with com-
munity mobility data (e.g., Cannata et al., 2021; Dias et al.,        assumption that most people respected those regulations, the
2020; Lecocq et al., 2020). Therefore, analysis of seismic            anthropogenic noise is expected to vary accordingly.
noise may offer the ability to attain mobility information
without the privacy-related concerns and limitations of using
mobile technology.                                                    2     Materials and methods
   Here, we focus on the city of Querétaro, 200 km north-
west of Mexico City. Even though the area has lower seismic-          2.1    Data
ity rates than other parts of Mexico, it is currently equipped
with a network of seven Raspberry Shake 4D seismic sta-               The Querétaro metropolitan zone (QMZ) is monitored by
tions spread throughout the city. The relative density of the         a seismic network operated by the Center of Geosciences
network combined with the low local seismicity makes this             (UNAM Campus Juriquilla). As of 2020, the network, de-
city an ideal laboratory to explore the impact of the lock-           signed for studies of local and regional events, was composed
down measures on seismic noise and the general signature of           of seven Raspberry Shake 4D stations that each incorporate
human activities observed by seismic instruments.                     a vertical component geophone and a three-component ac-
   The lockdown in Mexico was structured in three phases              celerometer (Fig. 1).
with growing constraints as the number of cases increased                These low-cost sensors were demonstrated to perform
in the country from mid-March until June (Table 1). From              suitably well for monitoring a large range of local and re-
June on, the authorities implemented a plan towards la nueva          gional earthquake magnitudes (Anthony et al., 2019). Al-
normalidad (the “new normality”, NN) with a monitoring                though the accelerometers are capable of recording larger,
system regulating the use of public spaces according to the           more powerful earthquakes, they have high self-noise levels
risk of COVID-19 contagion. This system assigns a stoplight           and are not able to resolve most cultural activity. Our analysis
color to each state ranging from red to green as a function           in this study is therefore restricted to the vertical component
of the ongoing epidemiological risk (Secretaría de Salud,             geophone data. All stations record continuous data at a sam-
2020b, Semáforo COVID-19; Table 2). The different phases              pling rate of 100 Hz except for station R2013 recording at
of lockdown and stoplight colors are associated with critical         50 Hz. Of the three stations installed near the historic center,
additional constraints on non-essential activities. Under the         RF6B5 and R6BB7 are both installed in cultural centers that

Solid Earth, 12, 713–724, 2021                                                               https://doi.org/10.5194/se-12-713-2021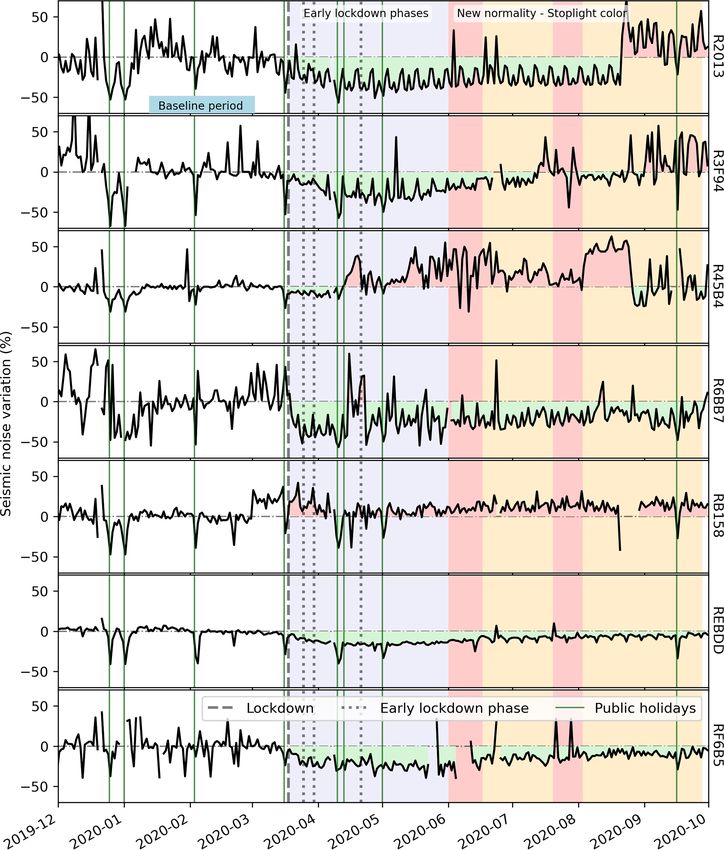
R. S. M. De Plaen et al.: Seismic signature of the COVID-19 lockdown at the city scale                                                           715

Table 1. Descriptions of the early phases of the federal lockdown in Mexico (Secretaría de Salud, 2020a).

      Phases            Announcement/              Description
                        implementation dates
      Phase 1           14 March 2020/             Importation of the virus with dozens of identified infected travelers entering the coun-
                        21 March 2020              try;
                                                   closing of schools and universities with early recess
      Phase 2           24 March 2020              Community propagation of the virus, with hundreds of infected people, and the origin
                                                   of the infections is no longer well identified;
                                                   suspension of classes, events, and meetings of more than 100 people; suspension of
                                                   work activities that involve the mobilization of people in all sectors of society and in-
                                                   tensification of basic sanitary prevention measures;
                                                   start of the “quédate en casa” campaign
      State of          30 March 2020              Immediate suspension of non-essential activities in the public, private, and social sectors
      sanitary
      emergency
      Phase 3           21 April 2020              National epidemiological stage with thousands of confirmed infectious cases throughout
                                                   the country; the measures to stay in homes are reinforced with the limitation of non-
                                                   essential activities

Table 2. Categories of the epidemiological risk stoplight during the “new normality” in Mexico (Secretaría de Salud, 2020b).

      Color       Description
      Red         Only essential businesses are allowed, and people are encouraged to shelter at home.
      Orange      Essential businesses are allowed, non-essential businesses are allowed to operate with up to 30 % of the personnel, and
                  open public spaces are opened with a limited capacity.
      Yellow      All businesses are allowed to operate. Open public spaces are open at regular capacity, and closed public spaces operate
                  at reduced capacity. All activities must be carried out with basic preventive measures.
      Green       All activities are allowed at regular capacity, including school.

had suspended their activities since the beginning of the con-               spectrum of potential sources typically recorded between 2
finement, and REBDD is installed in the Corregidora soccer                   and 20 Hz, such as traffic, public transportation, pedestrians,
arena, which has a capacity of ∼ 34 000.                                     and industries (e.g., Diaz et al., 2020; Poli et al., 2020).
   The stations located further from the center of the city                     Human-generated noise is also characterized by strong di-
are installed on university campuses (R2013 – UNAM Cam-                      urnal variability and higher amplitudes during business days
pus Juriquilla, R45B4 – Universidad Tecnológica de Queré-                    than weekends and public holidays. As a result, we measured
taro, and R3F94 – Universidad Politécnica de Querétaro) and                  the anthropogenic noise by using the signal between 07:00
in the Benito Juárez industrial park (RB158). All the net-                   and 19:00 local time. Using the same method as Lecocq et
work stations are within 5 km of four-lane highways with                     al. (2020), we computed the power spectral density (PSD)
90–100 km h−1 speed limits and significant traffic. The pe-                  using Welch’s method (Welch, 1967) from 30 min windows
riod analyzed here extends from 1 November 2019 to 1 Oc-                     with a 50 % overlap.
tober 2020.                                                                     The time series were extracted from the root mean square
                                                                             (seismic rms) of the time-domain displacement. The seismic
2.2    Anthropogenic noise analysis                                          rms was first implemented using a narrow band of 1 Hz for
                                                                             multiple frequencies ranging from 1 to 20 Hz to better iden-
The QMZ network was designed to study natural processes,                     tify the stable frequency range most affected by the lockdown
specifically local and regional tectonic earthquakes, rather                 measures (Fig. 2). The resulting time series were then used
than human-generated signals. Nevertheless, the recorded                     to identify the Spearman correlation coefficient between each
signal is subjected to a significant amount of noise, whether                narrowband seismic rms and each community mobility cate-
systematic (instrumental noise), natural (microseisms, atmo-                 gory (Fig. 3).
spheric, etc.), or human-made. The latter includes a broad

https://doi.org/10.5194/se-12-713-2021                                                                       Solid Earth, 12, 713–724, 2021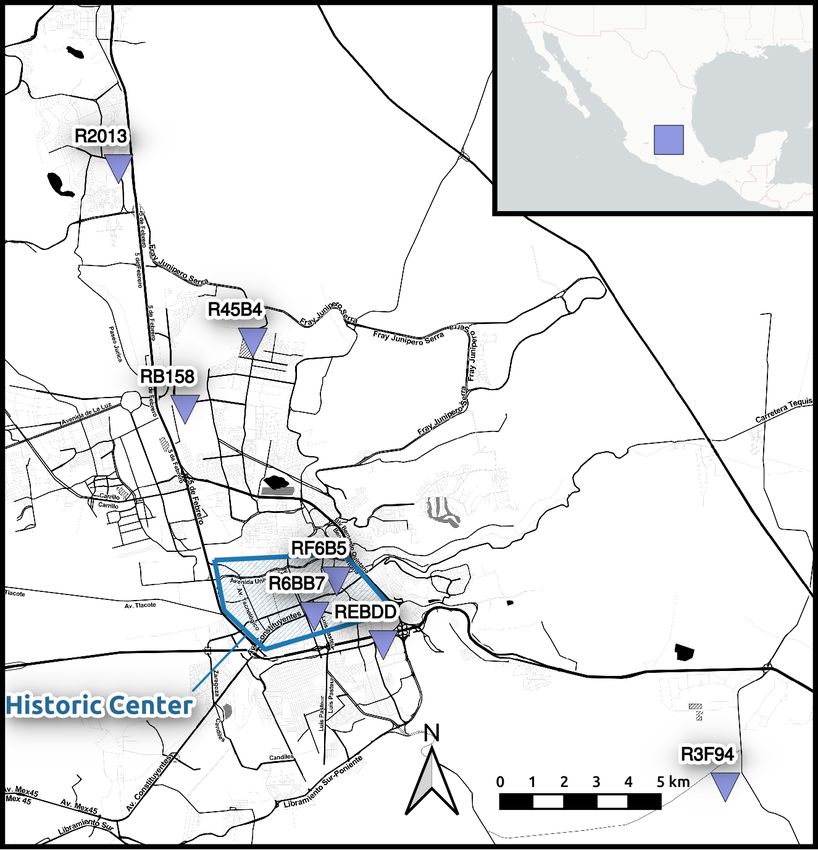
716                                   R. S. M. De Plaen et al.: Seismic signature of the COVID-19 lockdown at the city scale

Figure 2. Normalized variation of rms displacement in 1 Hz frequency bins from 1 to 20 Hz at all stations. The typical succession of business
days and weekends can clearly be observed, but the largest reductions in seismic noise levels are identified during the Christmas holiday
(green dashed lines are Christmas and New Year, respectively) and following the implementation of lockdown measures in mid-March 2020
(white dashed line). Note that station R2013 was moved in late August 2020 (red dashed line).

2.3   Mobility data                                                      of movement trends over time by geography across differ-
                                                                         ent high categories of places defined as retail and recreation,
From the beginning of the pandemic, Google, along with                   groceries and pharmacies, parks, transit stations, workplaces,
other tech and social media companies (e.g., WAZE, Apple,                and residential. The data reflect the time visitors spent in the
Facebook), started sharing community mobility data created               different categories of places compared to baseline days, cal-
with aggregated, anonymized sets of data from user location              culated as the median value from the arbitrary 5-week period
histories (Google, 2020). Here we focus on data provided                 from 3 January to 6 February 2020. Each value in the report
by Google as they are likely to sample a larger portion of               is therefore a measurement relative to seven individual val-
the population and more heterogeneous social backgrounds                 ues of the corresponding day of the week during the baseline
(Borbón González et al., 2018). These reports offer analyses             period.

Solid Earth, 12, 713–724, 2021                                                                 https://doi.org/10.5194/se-12-713-2021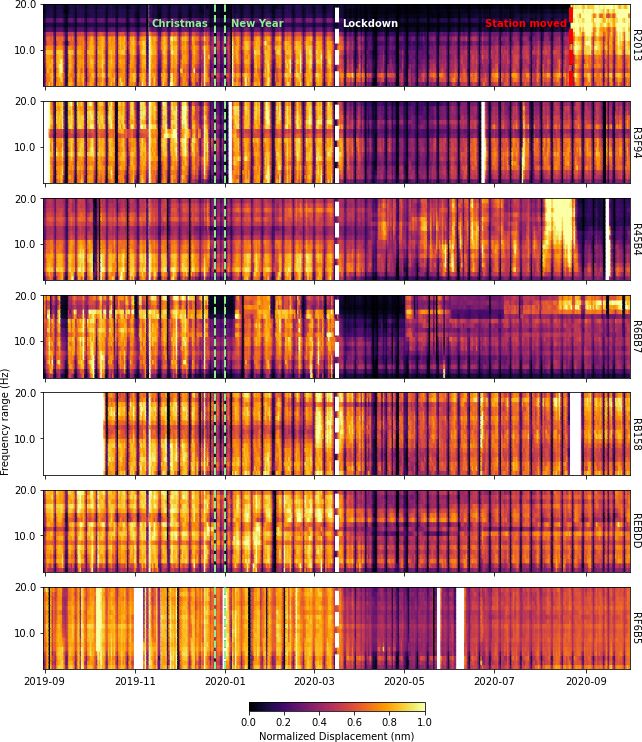
R. S. M. De Plaen et al.: Seismic signature of the COVID-19 lockdown at the city scale                                                  717

Figure 3. Correlation coefficient between the seismic rms in a narrow 1 Hz frequency band from 1 to 20 Hz at station R6BB7 and the
Google community mobility in the high categories of retail and recreation, groceries and pharmacies, parks, transit stations, workplaces, and
residential premises. The period considered extends from 15 February to 1 October 2020, and the highest correlation and anticorrelation are
identified between 4 and 14 Hz.

   The index in the residential category is calculated using                In this work, we used data for the state of Querétaro, the
the average amount of time in hours spent at places of resi-             smallest spatial granularity level available for the region.
dence by individual users in a given day and geographic area.            Since the QMZ contains ∼ 64 % of the population and the
The workplace index is calculated as a count of users spend-             largest portion of the urban population likely to use such mo-
ing more than 1 h at their places of work each day and is                bile technology in the state (INEGI, 2016), we consider this
aggregated by their place of residence. The index for all the            approximation acceptable for our purposes.
remaining categories counts the number of unique users who                  With those limitations, in the absence of a better op-
visited a public place in the given category on a given day,             tion, these community mobility data offer the best solution
with individual users contributing at most once to each cate-            to specifically track the social response of the population
gory and up to four pairs of category–location per day (Aktay            to lockdown measures and compare them to ambient noise
et al., 2020).                                                           monitoring.
   These data are imperfect on many levels, especially when
applied to a city in Mexico. The raw data only sample the
portion of the population with stable access to the internet ac-         3   Results and discussion
tively using Google services. Evidence shows that the urban
population is far better connected than the rural, and Android           Significant reductions of the seismic rms following the im-
is by far the leading operative system, with over 80 % of the            plementation of lockdown measures are observed at all nar-
Mexican market (Borbón González et al., 2018; Martínez-                  row frequency bands between 1 and 20 Hz. Higher correla-
Domínguez and Mora-Rivera, 2020).                                        tion coefficients between community mobility and the seis-
   The data are anonymized using libraries of differentially             mic rms were obtained between 4 and 14 Hz, leading us to
private algorithms, which add Laplace noise to protect each              concentrate on that frequency range, which is consistent with
metric with differential privacy (Aktay et al., 2020). Further-          Lecocq et al. (2020).
more, metrics for which the geographic region is smaller than               To better interpret the variation of seismic rms relative to
3 km2 , or for which the differentially private count of con-            community mobility, we converted those values to percent-
tributing users after noise addition is smaller than 100, are            age of change according to the corresponding day of the
discarded. The original data are by design far from transpar-            week during a baseline period. The baseline is calculated as
ent, leading to significant uncertainties in features such as the        the median value for the corresponding day of the week from
number of people and the delimitation of the locations sam-              13 January to 2 March, excluding 3 February, which was a
pled (e.g., Lecocq et al., 2020).                                        holiday. This baseline period is different from the one used
                                                                         for Google community mobility; it is a larger period, starting
                                                                         later to avoid any influence from the end of the Christmas

https://doi.org/10.5194/se-12-713-2021                                                                  Solid Earth, 12, 713–724, 2021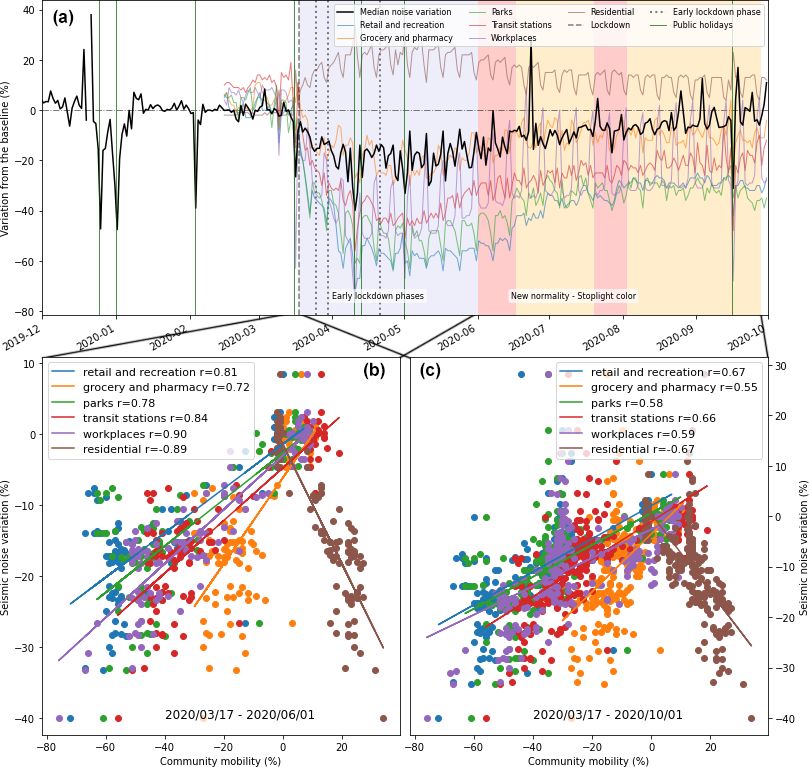
718                                   R. S. M. De Plaen et al.: Seismic signature of the COVID-19 lockdown at the city scale

Figure 4. Variation of seismic rms between 4 and 14 Hz in percent at all seven stations of the network relative to the median of the corre-
sponding day of the week during the baseline period of 13 January to 2 March. The public holidays are indicated with green vertical lines,
and the implementation of lockdown measures is indicated as the black dashed line. The purple span corresponds to the early lockdown
phases, and the red and orange spans after 1 June are the corresponding stoplight color for the “new normality”.

and New Year school holidays. The baseline period finishes              displayed a slow progressive increase until 1 June, and then
before the announcement by the World Health Organization                it remained significantly above baseline. This suggests a sus-
that COVID-19 had officially become a pandemic.                         tained higher-than-normal level of activity in the close vicin-
   The resulting time series show less impact from weekends,            ity of the industrial park even as the Mexican government
but they are characterized by lower noise levels (Fig. 4). In-          suspended non-essential activities in the public, private, and
stead, days such as public holidays with anthropogenic noise            social sectors. This high level of activity could be the result
levels that are out of the ordinary are specifically empha-             of essential activity such as the delivery of food and supplies
sized, with reductions from −20 % to −50 % registered at                and would explain why this higher level of activity was later
all stations. With the implementation of the first lockdown             sustained.
measures, the relative noise level started to progressively de-             All the other stations displayed significant noise reduction
crease at all stations except for RB158, located in the Benito          until at least the end of the Easter holidays (12 April 2020).
Juárez industrial park, where the noise level remained 20 %             During this period, station R45B4, located at the Univer-
to 50 % higher than the baseline from early March. Noise                sidad Tecnológica de Querétaro (UTQ) campus, displayed
levels at this station decreased after the declaration of a san-        the smallest change, with noise levels dropping by less than
itary emergency and on the Good Friday holiday but then                 10 %, followed by sustained increased levels up to 30 %

Solid Earth, 12, 713–724, 2021                                                                https://doi.org/10.5194/se-12-713-2021
R. S. M. De Plaen et al.: Seismic signature of the COVID-19 lockdown at the city scale                                                 719

Figure 5. (a) Median of the variation of the seismic rms at all stations relative to the median of the corresponding day of the week during
the baseline period of 13 January to 2 March and variation of the Google community mobility in six high-level categories. The public
holidays are indicated with blue dashed lines, and the implementation of lockdown measures is indicated as the black dashed line. The purple
span corresponds to the early lockdown phases, and the red and orange spans after 1 June are the corresponding stoplight color for the
“new normality”. Cross-plot between the median seismic rms of the network and the Google community mobility in six high-level categories
during the early lockdown phases (b) and including the new normality (c). The Spearman correlation coefficients between the median seismic
rms and each category of community mobility are provided in the legend.

above the baseline as a result of roadwork on a neighboring             baseline (Fig. 5a). The median then slightly increased, fol-
avenue. This high level of seismic rms at this station holds            lowed by a decrease after phase 3 of the lockdown until
until the end of August. It can safely be attributed to the road-       1 May (Labor Day holiday). The noise then progressively in-
work in the near-field rather than a specifically lockdown-             creased again until the implementation of the stoplight sys-
related human activity change.                                          tem of the NN on 1 June. From the end of the Easter hol-
   The median of all the stations better illustrates this change,       idays to 1 June, stations REBDD, RF6B5, R3F94, R2013,
with a progressive decrease through lockdown phases 1 and               and R6BB7 maintained an average noise level of −19.31 %,
2 and the state of sanitary emergency until the Good Fri-               −27.93 %, −31.99 %, −32.70 %, and −35.68 %, respec-
day holiday (10 April 2020) that reached ∼ 40 % under the               tively (Fig. 4).

https://doi.org/10.5194/se-12-713-2021                                                                  Solid Earth, 12, 713–724, 2021
720 R. S. M. De Plaen et al.: Seismic signature of the COVID-19 lockdown at the city scale
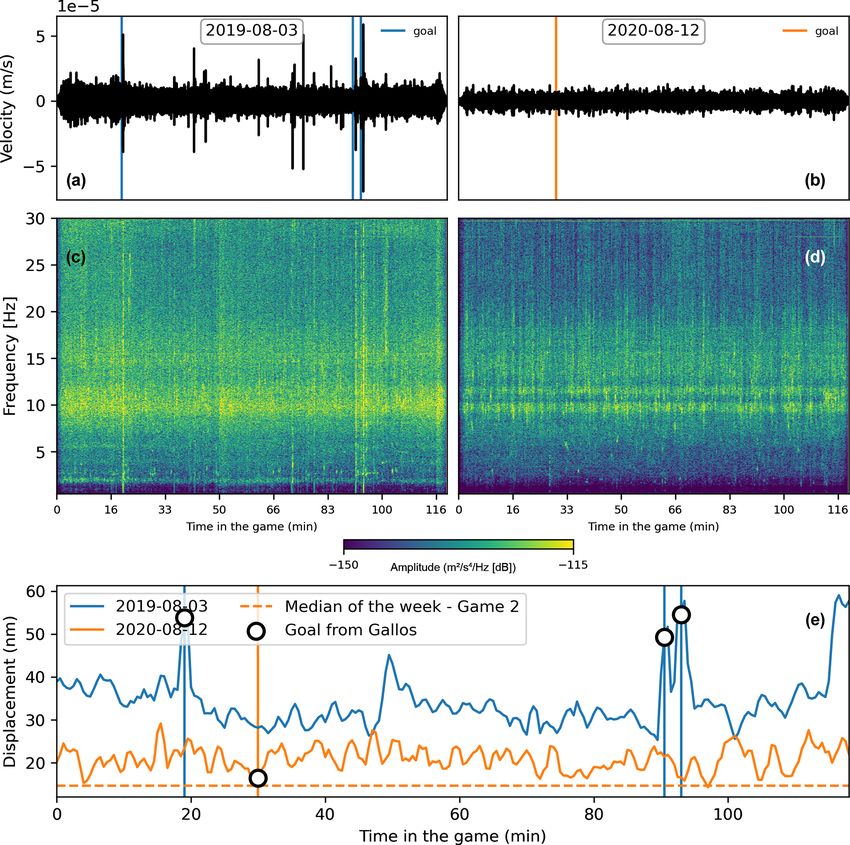
Figure 6. Seismic signal recorded by station REBDD during the football games between the Gallos Blancos of Querétaro and the Cruz Azul
of Mexico City in the Corregidora soccer arena on 3 August 2019 and 12 August 2020, respectively. Panels (a) and (b) are the waveforms,
and panels (c) and (d) are the spectrograms for each respective game. Panel (e) compares the seismic rms between the two games in the
4–14 Hz frequency range.
During the NN, the stoplight changed from red to orange, entertaining tool to teach basic scientific research methodolo-
with a subsequent relaxation of restrictions accompanied by gies and seismology to undergraduate students (e.g., Melgar
a consistent progressive increase in the level of noise. As the and Pérez-Campos, 2011), which echoes similar initiatives
infection risk increased, the stoplight was turned red again at sporting events worldwide (e.g., Vidale, 2011; Díaz et al.,
on 20 July for 2 weeks, during which the seismic rms slightly 2017). In Querétaro, all games had been canceled with the
decreased again. The stoplight was then turned orange again implementation of the early lockdown measures until mid-
until 1 October, when it changed to yellow, and the seismic July, when authorities allowed games without public atten-
rms increased back to baseline levels. dance. This situation makes for a good opportunity to com-
From mid-August, station R2013 at the UNAM campus pare observations during games played before and after the
displayed a significant increase in the seismic rms, which beginning of the confinement. In what follows, we look at
was on average 30 % above the baseline. This sharp increase data from two games played by the first-division Gallos Blan-
when some restrictions were still in place resulted from the cos of Querétaro soccer club against the Cruz Azul soccer
relocation of the instrument from an office to a noisier site. club of Mexico City (3 August 2019 and 12 August 2020,
Fig. 6) as well as one against the Águilas del América soc-
3.1 Sporting events cer club of Mexico City (9 February and 16 August 2020,
Fig. 7). The seismic rms is calculated with the method de-
The station REBDD located in the Corregidora soccer arena scribed above but with a window reduced to 100 s.
also offers an interesting perspective on the contribution of Both games played against the Cruz Azul team were won
public attendance to the recorded seismic noise. Seismome- by Gallos Blancos with scores of 3–0 and 1–0, respectively.
ters in soccer stadiums are regularly used in Mexico as an During the first game, which occurred with an audience of
Solid Earth, 12, 713–724, 2021 https://doi.org/10.5194/se-12-713-2021R. S. M. De Plaen et al.: Seismic signature of the COVID-19 lockdown at the city scale 721
Figure 7. Seismic signal recorded by station REBDD during the football games between the Gallos Blancos of Querétaro and the Club
América of Mexico City in the Corregidora soccer arena on 9 February and 16 July 2020, respectively. Panels (a) and (b) are the waveforms,
and panels (c) and (d) the spectrograms for each respective game. Panel (e) compares the seismic rms between the two games in the 4–14 Hz
frequency range.
29 339 supporters, a clear signature can be identified at the which is further emphasized in contrast to the 16 July 2020
moments Gallos Blancos scored goals, with a significant in- game during which goals scored do not significantly emerge
crease (Fig. 6) in noise. The half-time and especially the end from the background signal.
of the game are also characterized by a relatively higher noise
level than the rest of the game, which could potentially be at- 3.2 Correlation with mobility
tributed to the enthusiasm of the supporters at the final score.
This development contrasts with the 16 August 2020 game The different categories of community mobility were com-
played without an audience. The entire game remained at a pared to the variations of noise levels to identify the one most
relatively low level of noise very close to the median of the affected by lockdown measures. The different correlation co-
week for that time of the day (Fig. 6). The only goal, at the efficient obtained for each category of community mobility
29th minute of the game, does not emerge from the back- sheds light on the impact of lockdown measures (Fig. 5).
ground noise as only the players were present to celebrate The metrics of community mobility are based on data from
it. Google users in the state of Querétaro who use location his-
A similar pattern is observed during the matches against tory, the majority of which are assumed to live in the QMZ.
the Águilas del América team. The first game on 9 Febru- The median of network stations rather than individual sta-
ary 2020, with 34 050 supporters, was won 1–2 by América tions was therefore compared to the community mobility to
with noise levels consistently higher than the baseline for that better correspond to the sampled population.
time of the day on a Sunday and with clear spikes every time The median seismic rms has a high correlation with all the
a goal was scored by either team. This pattern again shows categories except the residential one, but the retail and recre-
the impact of the supporters on the recorded seismic noise, ation (0.67), transit station (0.66), and workplace (0.59) cat-
egories are the highest. With non-essential workers invited to
https://doi.org/10.5194/se-12-713-2021 Solid Earth, 12, 713–724, 2021722 R. S. M. De Plaen et al.: Seismic signature of the COVID-19 lockdown at the city scale
shelter at home, this is an expected outcome reinforced by the fectively single out localized zones of increased noise level
strongly anticorrelated (−0.67) residential category (Fig. 5c). caused by more activity, such as in the Benito Juárez indus-
All correlation coefficients are highly significant with p val- trial park, or construction work, such as at the campus of the
ues smaller than ×10−15 . The relationship between seismic Universidad Tecnológica de Querétaro.
rms and the different categories of community mobility is no- The privacy concerns associated with mobile-technology-
ticeably higher during the early phases of lockdown (Fig. 5b). based community mobility data require a low resolution to
This could reflect the more complex mobility pattern peo- anonymize original user data. Along with a higher resolu-
ple adopted during the new normality, as the authorities pro- tion, anthropogenic seismic noise has the advantage of being
gressively encouraged the reopening of the economy with the anonymized by definition and does not require the population
help of sanitary measures. to share their personal data.
Anthropogenic seismic noise recorded in cities is typically While we observed the contribution to anthropogenic
generated by various processes such as cultural and sport- noise in the near-field of sources such as construction work
ing events, individual and public commuter traffic, and the and sporting events, the observed correlation between seis-
production and transportation of different kinds of goods mic noise and mobility at the city scale is consistent with
(e.g., Groos and Ritter, 2009). Traffic in particular heavily the traffic-dominated nature of anthropogenic seismic noise
influences the frequency range from ∼ 1 Hz to more than in urban areas. Although observing variations of traffic vol-
45 Hz, with variation with respect to urban location due to umes in the seismic signal is not monitoring the lockdown
the influence of subsurface conditions. As a result, geophys- per se, it proves to be a reliable proxy for human activity,
ical sensing such as fiber-optic distributed acoustic sensing especially at the city scale with such a network.
(DAS) has recently proven to be capable of providing re-
markably resolved statistics about public infrastructure uti-
lization across many large sectors of a city (Lindsey et al., Data availability. Data for stations R3F94, RB158, and R3F94
2020). Surface waves generated by vehicles in stratified soil are openly accessible as part of the citizen scientist earth-
have been shown to be mainly restricted to the 2–20 Hz fre- quake monitoring network (AM) through FDSN Web Services
quency band. Vehicle-induced ground vibrations are gener- (https://doi.org/10.7914/SN/AM; Raspberry Shake Community et
al., 2016). The remaining data used in this study are available upon
ated by the pitch and axle hop modes of the vehicle cou-
request to the corresponding author.
pling to the road. Although far-field vibration levels depend
on vehicle speed, road unevenness, the vehicle itself, and soil
characteristics, vibration frequencies attributed to axle hop Author contributions. RSMDP, VHMR, and XPC designed the
modes depend on vehicle distance and velocity (Lombaert et study. All the authors analyzed the seismic data. RSMDP, VHMR,
al., 2000; Lombaert and Degrande, 2001). and XPC wrote the paper. All the authors interpreted the results and
The seismic noise recorded by stations, which are all revised the article.
within 5 km of the main roads in the state in a busy urban
environment, is relatively similar across all stations in our
frequency band of interest and has a specific temporal pat- Competing interests. The authors declare that they have no conflict
tern that suggests a ubiquitous source. This has been charac- of interest.
terized as traffic-dominated anthropogenic noise (e.g., Boese
et al., 2015; Green et al., 2017) and indicates that the method
likely provides a good proxy for the temporal variation of Special issue statement. This article is part of the special issue “So-
traffic volume. With a lot of people working from home or cial seismology – the effect of COVID-19 lockdown measures on
losing their jobs during the lockdown, our results could in seismology”. It is not associated with a conference.
large part indirectly show the decrease in commuter traffic.
Acknowledgements. This work is supported by grant CONACYT-
299766 and CONCYTEQ. Raphael S. M. De Plaen acknowledges
4 Conclusions support from a UNAM-DGAPA postdoctoral scholarship. We also
thank the following institutions: CCU-UNAM, UTEQ, UPQ, CE-
Like in a lot of populated places around the world, the effect CEQ, Estadio Corregidora, and Parque Industrial Benito Juárez for
of lockdown measures was observed as a decrease in high- allowing us to install equipment in their facilities.
frequency seismic noise in the city of Querétaro. Our results
specifically show the benefit of using a network of low-cost
Raspberry Shake stations to investigate the temporal and spa- Review statement. This paper was edited by Paula Koelemeijer and
tial variation of anthropogenic noise at a city scale. reviewed by two anonymous referees.
While the tracked variation of human-generated noise has
high similarity to community mobility as obtained from mo-
bile technology, it yields a finer resolution that could ef-
Solid Earth, 12, 713–724, 2021 https://doi.org/10.5194/se-12-713-2021R. S. M. De Plaen et al.: Seismic signature of the COVID-19 lockdown at the city scale 723
References y Geografía, México, available at: https://www.inegi.org.mx/
programas/intercensal/2015/ (last access: 12 March 2021), 2016.
Aktay, A., Bavadekar, S., Cossoul, G., Davis, J., Desfontaines, Lecocq, T., Hicks, S. P., Van Noten, K., van Wijk, K., Koelemei-
D., Fabrikant, A., Gabrilovich, E., Gadepalli, K., Gipson, B., jer, P., De Plaen, R. S. M., Massin, F., Hillers, G., Anthony,
Guevara, M., Kamath, C., Kansal, M., Lange, A., Mandayam, R. E., Apoloner, M.-T., Arroyo-Solórzano, M., Assink, J. D.,
C., Oplinger, A., Pluntke, C., Roessler, T., Schlosberg, A., Büyükakpınar, P., Cannata, A., Cannavo, F., Carrasco, S., Cau-
Shekel, T., Vispute, S., Vu, M., Wellenius, G., Williams, B., dron, C., Chaves, E. J., Cornwell, D. G., Craig, D., den Ouden, O.
and Wilson, R. J.: Google COVID-19 Community Mobility Re- F. C., Diaz, J., Donner, S., Evangelidis, C. P., Evers, L., Fauville,
ports: Anonymization Process Description (version 1.0), ArXiv B., Fernandez, G. A., Giannopoulos, D., Gibbons, S. J., Girona,
[preprint], arXiv:2004.04145, 8 April 2020. T., Grecu, B., Grunberg, M., Hetényi, G., Horleston, A., Inza,
Anthony, R. E., Ringler, A. T., Wilson, D. C., and Wolin, E.: Do A., Irving, J. C. E., Jamalreyhani, M., Kafka, A., Koymans, M.
low-cost seismographs perform well enough for your network? R., Labedz, C. R., Larose, E., Lindsey, N. J., McKinnon, M.,
An overview of laboratory tests and field observations of the Megies, T., Miller, M. S., Minarik, W., Moresi, L., Márquez-
OSOP raspberry shake 4D, Seismol. Res. Lett., 90, 219–228, Ramírez, V. H., Möllhoff, M., Nesbitt, I. M., Niyogi, S., Ojeda,
https://doi.org/10.1785/0220180251, 2019. J., Oth, A., Proud, S., Pulli, J., Retailleau, L., Rintamäki, A. E.,
Boese, C. M., Wotherspoon, L., Alvarez, M., and Malin, P.: Satriano, C., Savage, M. K., Shani-Kadmiel, S., Sleeman, R.,
Analysis of anthropogenic and natural noise from multi- Sokos, E., Stammler, K., Stott, A. E., Subedi, S., Sørensen, M.
level borehole seismometers in an urban environment, Auck- B., Taira, T., Tapia, M., Turhan, F., van der Pluijm, B., Vanstone,
land, New Zealand, Bull. Seismol. Soc. Am., 105, 285–299, M., Vergne, J., Vuorinen, T. A. T., Warren, T., Wassermann, J.,
https://doi.org/10.1785/0120130288, 2015. and Xiao, H.: Global quieting of high-frequency seismic noise
Borbón González, A. D., Cristina, T. B., and Romero Dessens, L. due to COVID-19 pandemic lockdown measures, Science, 369,
F.: Caracterización del mercado mexicano de teléfonos celulares 1338–1343, https://doi.org/10.1126/science.abd2438, 2020.
inteligentes o smartphones, INVURNUS, 13, 21–31, 2018. Lindsey, N. J., Yuan, S., Lellouch, A., Gualtieri, L., Lecocq,
Cannata, A., Cannavò, F., Di Grazia, G., Aliotta, M., Cassisi, C., De T., and Biondi, B.: City-Scale Dark Fiber DAS Mea-
Plaen, R. S. M., Gresta, S., Lecocq, T., Montalto, P., and Sciotto, surements of Infrastructure Use During the COVID-19
M.: Seismic evidence of the COVID-19 lockdown measures: a Pandemic, Geophys. Res. Lett., 47, e2020GL089931,
case study from eastern Sicily (Italy), Solid Earth, 12, 299–317, https://doi.org/10.1029/2020GL089931, 2020.
https://doi.org/10.5194/se-12-299-2021, 2021. Lombaert, G. and Degrande, G.: Experimental validation of a nu-
Dias, F. L., Assumpção, M., Peixoto, P. S., Bianchi, M. B., merical prediction model for free field traffic induced vibrations
Collaço, B., and Calhau, J.: Using Seismic Noise Lev- by in situ experiments, Soil Dyn. Earthq. Eng., 21, 485–497,
els to Monitor Social Isolation: An Example From Rio de https://doi.org/10.1016/S0267-7261(01)00017-3, 2001.
Janeiro, Brazil, Geophys. Res. Lett., 47, e2020GL088748, Lombaert, G., Degrande, G., and Clouteau, D.: Numerical
https://doi.org/10.1029/2020GL088748, 2020. modelling of free field traffic-induced vibrations, Soil Dyn.
Díaz, J., Ruiz, M., Sánchez-Pastor, P. S., and Romero, P.: Urban Earthq. Eng., 19, 473–488, https://doi.org/10.1016/S0267-
Seismology: On the origin of earth vibrations within a city, 7261(00)00024-5, 2000.
Sci. Rep., 7, 1–11, https://doi.org/10.1038/s41598-017-15499-y, Martínez-Domínguez, M. and Mora-Rivera, J.: Internet adoption
2017. and usage patterns in rural Mexico, Technol. Soc., 60, 101226,
Diaz, J., Schimmel, M., Ruiz, M., and Carbonell, R.: https://doi.org/10.1016/j.techsoc.2019.101226, 2020.
Seismometers Within Cities: A Tool to Connect Melgar, D. and Pérez-Campos, X.: How a Soccer Stadium Helps
Earth Sciences and Society, Front. Earth Sci., 8, 1–7, with an Education in Science and Seismology, Seismol. Res.
https://doi.org/10.3389/feart.2020.00009, 2020. Lett., 82, 115–119, https://doi.org/10.1785/gssrl.82.1.115, 2011.
Economic and Development Review Committee: OECD/ILO: Tackling Vulnerability in the Informal Economy,
OECD Economic Surveys: Mexico 2019, OECD, OECD Publishing, Paris, https://doi.org/10.1787/939b7bcd-en,
https://doi.org/10.1787/19990723, 2019. 2019.
Google: COVID-19 Community Mobility Report, COVID-19 Com- Poli, P., Boaga, J., Molinari, I., Cascone, V., and Boschi, L.:
munity Mobility Report, available at: https://www.google.com/ The 2020 coronavirus lockdown and seismic monitoring of
covid19/mobility?hl=en, last access: 24 September 2020. anthropic activities in Northern Italy, Sci. Rep., 10, 9404,
Green, D. N. and Bowers, D.: Seismic Raves: Tremor Observations https://doi.org/10.1038/s41598-020-66368-0, 2020.
from an Electronic Dance Music Festival, Seismol. Res. Lett., Raspberry Shake Community, OSOP, S.A., and Gempa GmbH: AM
79, 546–553, https://doi.org/10.1785/gssrl.79.4.546, 2008. Raspberry Shake, FDSN, https://doi.org/10.7914/SN/AM, 2016.
Green, D. N., Bastow, I. D., Dashwood, B., and Nip- Riahi, N. and Gerstoft, P.: The seismic traffic footprint: Tracking
press, S. E. J.: Characterizing broadband seismic noise trains, aircraft, and cars seismically, Geophys. Res. Lett., 42,
in Central London, Seismol. Res. Lett., 88, 113–124, 2674–2681, https://doi.org/10.1002/2015GL063558, 2015.
https://doi.org/10.1785/0220160128, 2017. Secretaría de Salud: Consejo de Salubridad General declara emer-
Groos, J. C. and Ritter, J. R. R.: Time domain classification and gencia sanitaria nacional a epidemia por coronavirus COVID-19,
quantification of seismic noise in an urban environment, Geo- available at: http://www.gob.mx/salud/prensa/consejo-de-
phys. J. Int., 179, 1213–1231, https://doi.org/10.1111/j.1365- salubridad-general-declara-emergencia-sanitaria-nacional-a-
246X.2009.04343.x, 2009. epidemia-por-coronavirus-covid-19-239301, last access: 30
INEGI: Panorama sociodemográfico de Queretaro 2015, En- October 2020a.
cuesta Intercensal 2015, Instituto Nacional de Estadística
https://doi.org/10.5194/se-12-713-2021 Solid Earth, 12, 713–724, 2021724 R. S. M. De Plaen et al.: Seismic signature of the COVID-19 lockdown at the city scale Secretaría de Salud: Secretarías de Salud y de Turismo presentan World Health Organisation: Coronavirus Disease (COVID-19) Sit- Lineamiento Nacional para la Reapertura del Sector Turístico, uation Reports, available at: https://www.who.int/emergencies/ available at: http://www.gob.mx/salud/prensa/secretarias-de- diseases/novel-coronavirus-2019/situation-reports, last access: salud-y-de-turismo-presentan-lineamiento-nacional-para-la- 19 October 2020. reapertura-del-sector-turistico-243436, last access: 30 October Xiao, H., Eilon, Z. C., Ji, C., and Tanimoto, T.: COVID- 2020b. 19 Societal Response Captured by Seismic Noise in Vidale, J. E.: Seattle “12th Man Earthquake” Goes Viral, Seismol. China and Italy, Seismol. Res. Lett., 91, 2757–2768, Res. Lett., 82, 449–450, https://doi.org/10.1785/gssrl.82.3.449, https://doi.org/10.1785/0220200147, 2020. 2011. Welch, P.: The use of fast Fourier transform for the estimation of power spectra: A method based on time averaging over short, modified periodograms, IEEE T. Audio Electroacoustic., 15, 70– 73, https://doi.org/10.1109/TAU.1967.1161901, 1967. Solid Earth, 12, 713–724, 2021 https://doi.org/10.5194/se-12-713-2021
You can also read