INTERACTIVE VISUALIZATION FOR DEBUGGING RL
←
→
Page content transcription
If your browser does not render page correctly, please read the page content below
Under review as a conference paper at ICLR 2021

I NTERACTIVE V ISUALIZATION FOR D EBUGGING RL
 Anonymous authors
 Paper under double-blind review

                                             A BSTRACT
         Visualization tools for supervised learning (SL) allow users to interpret, intro-
         spect, and gain an intuition for the successes and failures of their models. While
         reinforcement learning (RL) practitioners ask many of the same questions while
         debugging agent policies, existing tools aren’t a great fit for the RL setting as these
         tools address challenges typically found in the SL regime. Whereas SL involves
         a static dataset, RL often entails collecting new data in challenging environments
         with partial observability, stochasticity, and non-stationary data distributions. This
         necessitates the creation of alternate visual interfaces to help us better understand
         agent policies trained using RL. In this work, we design and implement an interac-
         tive visualization tool for debugging and interpreting RL. Our system1 identifies
         and addresses important aspects missing from existing tools such as (1) visual-
         izing alternate state representations (different from those seen by the agent) that
         researchers could use while debugging RL policies; (2) interactive interfaces tai-
         lored to metadata stored while training RL agents (3) a conducive workflow de-
         signed around RL policy debugging. We provide an example workflow of how
         this system could be used, along with ideas for future extensions.

1   I NTRODUCTION
Machine learning systems have made impressive advances due to their ability to learn high dimen-
sional models from large amounts of data (LeCun et al., 2015). However, high dimensional models
are hard to understand and trust (Doshi-Velez & Kim, 2017). Many tools exist for addressing this
challenge in the supervised learning setting, which find usage in tracking metrics (Abadi et al., 2015;
Satyanarayan et al., 2017), generating graphs of model internals (Wongsuphasawat et al., 2018), and
visualizing embeddings (van der Maaten & Hinton, 2008). However, there is no corresponding set
of tools for the reinforcement learning setting. At first glance, it appears we may repurpose exist-
ing tools for this task. However, we quickly run into limitations, that arise due to the intent with
which these tools were designed. Reinforcement learning (RL) is a more interactive science (Neftci
& Averbeck, 2019) compared to supervised learning, due to a stronger feedback loop between the
researcher and the agent. Whereas supervised learning involves a static dataset, RL often entails col-
lecting new data. To fully understand an RL algorithm, we must understand the effect it has on the
data collected. Note that in supervised learning, the learned model has no effect on a fixed dataset.
Visualization systems are important for overcoming these challenges. At their core visualization
systems, consist of two components: representation and interaction. Representation is concerned
with how data is mapped to a representation and then rendered. Interaction is concerned with the
dialog between the user and the system as the user explores the data to uncover insights (Yi et al.,
2007). Though appearing to be disparate, these two processes have a symbiotic influence on each
other. The tools we use for representation affect how we interact with the system, and our interaction
affects the representations that we create. Thus, while designing visualization systems, it is impor-
tant to think about the application domain from which the data originates, in this case, reinforcement
learning.
Using existing tools we can plot descriptive metrics such as cumulative reward, TD-error, and action
values, to name a few. However, it is harder to pose and easily answer questions such as:
- How does the agent state-visitation distribution change as training progresses?
- What effect do noteworthy, influential states have on the policy?
  1
    An interactive (anonymized) demo of the system can be found at https://vizarel-demo.
herokuapp.com

                                                   1
Under review as a conference paper at ICLR 2021

            (a) Representative Tool (Tensorboard)                              (b) Vizarel

Figure 1: Tool Comparison Contrasting between a representative tool for debugging RL in the existing
ecosystem (L), and Vizarel (R), highlights the difference in design intent between both systems. The former
was designed for the supervised learning setting, and has shown promise for use in reinforcement learning.
However, we argue that there exists a large space of unexplored interfaces that could help aid the process of
debugging RL algorithms and trained policies. We explore one such solution that is designed around the spatial
and temporal aspects of training RL agents. This approach might help increase understanding, interpretability,
and thereby serve as a complement to tools in the existing ecosystem.

- Are there repetitive patterns across space and time that result in the observed agent behavior?
These are far from an exhaustive list of questions that a researcher may pose while training agent
policies, but are chosen to illustrate the limitations created by our current set of tools that prevent us
from being able to easily answer such questions.
This paper describes our attempt at constructing Vizarel 2 , an interactive visualization system to help
interpret RL algorithms, debug RL policies, and help RL researchers pose and answer questions of
this nature. Towards these goals, we identify features that an interactive system for interpretable
reinforcement learning should encapsulate and build a prototype of these ideas. We complement this
by providing a walkthrough example of how this system could fit into the RL debugging workflow
and be used in a real scenario to debug a policy.

2       R ELATED W ORK
As we have argued in the introduction, existing visualization tools for machine learning primarily
focus on the supervised learning setting. However, the process of designing and debugging RL
algorithms requires a different set of tools, that can complement the strengths and overcome the
weaknesses of offerings in the current ecosystem. In the rest of this section, we highlight aspects
of prior work upon which our system builds. To the best of our knowledge, there do not exist visu-
alization systems built for interpretable reinforcement learning that effectively address the broader
goals we have identified. There exists prior work, aspects of which are relevant to features which
the current system encapsulates, that we now detail.
Visual Interpretability Related work for increasing understanding in machine learning models us-
ing visual explanations includes: feature visualization in neural networks (Olah et al., 2017; Si-
monyan et al., 2014; Zeiler & Fergus, 2013), visual analysis tools for variants of machine learning
models (Strobelt et al., 2017; Kahng et al., 2017; Kapoor et al., 2010; Krause et al., 2016; Yosin-
ski et al.), treating existing methods as composable building blocks for user interfaces (Olah et al.,
2018), and visualization techniques for increasing explainability in reinforcement learning (Rup-
precht et al., 2020; Atrey et al., 2020; McGregor et al., 2015)
Explaining agent behavior There exists related work that tries to explain agent behavior. Amir &
Amir summarize agent behavior by displaying important trajectories. van der Waa et al. (2018) intro-
duce a method to provide contrastive explanations between user derived and agent learned policies.
Huang et al. (2017) show maximally informative examples to guide the user towards understanding
    2
        Vizarel is a portmanteau of visualization + reinforcement learning.

                                                          2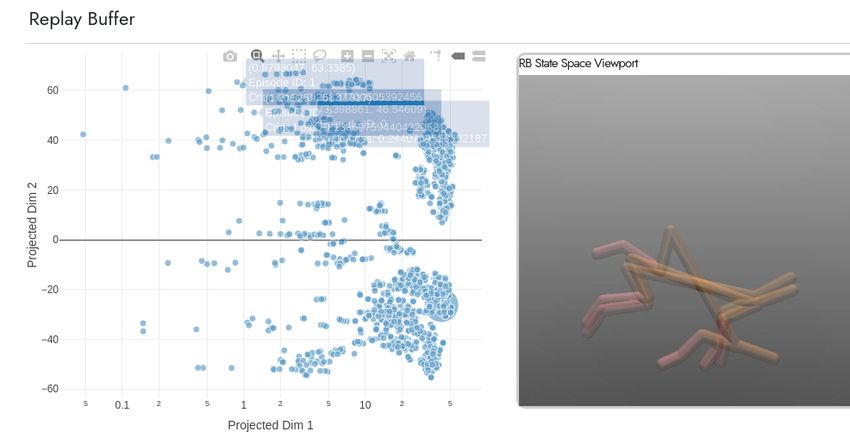
Under review as a conference paper at ICLR 2021

Figure 2: State + Action Viewports (T) Visualizing the state viewport for the inverted pendulum task. This
representation overlayed with another state viewport similar to (b), provides the user with better intuition about
the correspondence between states and actions for non image state spaces. (B) Visualizing the action viewport
for the Pong environment (Bellemare et al., 2013). Hovering over instantaneous timesteps dynamically updates
the state viewport (4.1.1) and shows the corresponding rendered image for the selected state. This representation
provides the user with intuition about the agent policy, and could help subsequent debugging.

the agent objective function. Hayes & Shah (2017) present algorithms and a system for robots to
synthesize policy descriptions and respond to human queries.
Explainable reinforcement learning Puiutta & Veith (2020) provide a survey of techniques for
explainable reinforcement learning. Related work in this theme includes Puri et al. (2020); Reddy
et al. (2019); Calvaresi et al. (2019); Juozapaitis et al. (2019); Sequeira & Gervasio (2020); Fukuchi
et al. (2017); Madumal et al. (2020)
Similar to Amir & Amir; van der Waa et al. (2018); Huang et al. (2017), this work is motivated by
the aim to provide the researcher relevant information to explore a possible space of solutions while
debugging the policy. Similar to Hayes & Shah (2017), we present a functioning system that can
respond to human queries to provide explanations. However, in contrast, the interactive system we
present is built around the RL training workflow, and designed to evolve beyond the explanatory use
case to complement the existing ecosystem of tools (Abadi et al., 2015; Satyanarayan et al., 2017).
In contrast to the techniques surveyed in Puiutta & Veith (2020), the contribution here is not on any
single technique to increase interpretability, but a whole suite of visualizations built on an extensible
platform to help researchers better design and debug RL agent policies for their task.

3    P RELIMINARIES
We use the standard reinforcement learning setup (Sutton & Barto, 2018). An agent interacting
with an environment at discrete timesteps t, receiving a scalar reward r(st , at ) ∈ R. The agent’s
behavior is defined by a policy π, which maps states s ∈ S, to a probability distribution over actions,
π : S → P (A). The environment can be stochastic, which is modeled by a Markov decision process
with a state space S, action space A ∈ Rn , an initial state distribution p(s0 ), a transition function
p(st+1 | st , a), and a reward function r(st , at ). The future discounted return from a state st and
                              PT
action at is defined as Rt = i=t γ i−t r(st , at ), with a discount factor γ ∈ [0, 1]. We use a replay
buffer (Mnih et al., 2013; Lin) to store the agent’s experiences et = (st , at , rt , st+1 ) in a buffer
B = {e0 , e1 , ..., eT }.

4    V IZAREL : A T OOL FOR I NTERACTIVE V ISUALIZATION OF RL
This section describes how our interactive visualization system (Vizarel), is currently designed. The
system offers different views that allow the user to analyze agent policies along spatial and temporal
dimensions (described later in further detail). The tool consists of a set of viewports, that provide the
user with different representations of the data, contingent on the underlying data stream. Viewports
are generated by chaining together different visualization elements, such as:
      1. image buffers: visualize observation spaces (image and non-image based)

                                                        3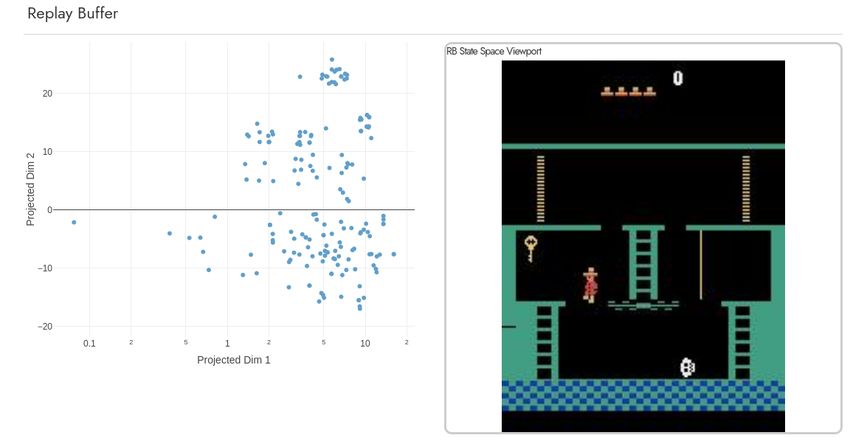
Under review as a conference paper at ICLR 2021

Figure 3: Replay Buffer Viewport Projecting the contents of the replay buffer into a 2D space for easier
navigation, and clustering states based on similarity. This viewport provides a visual representation for replay
buffer diversity and can help in subsequent debugging. Hovering over points in the replay buffer dynami-
cally updates the generated state viewport (4.1.1), and shows the rendered image for the corresponding state
(animation depicted using overlay).

         2. line plots: visualize sequentially ordered data, such as action values or rewards across time
         3. scatter plots: to visualize embedding spaces or compare tensors along specified dimensions
         4. histograms: visualize frequency counts of specified tensors or probability distributions
The current implementation provides core viewports (detailed further), but can easily be extended
by the user to generate additional viewports to explore different visualization ideas. This design
naturally leads to the idea of an ecosystem of plugins that could be integrated into the core system,
and distributed for use among a community of users to support different visualization schemes and
algorithms. For example, the user could combine image buffers and line plots in novel ways to create
a viewport to visualize the the state-action value function Sutton & Barto (2018). In the rest of this
section, we provide details and distinguish between two types viewports currently implemented in
Vizarel: temporal viewports and spatial viewports. Discussion on viewports beyond these has been
deferred to the appendix. Comprehensive information on adding new viewports is beyond the scope
of the paper, but has been described at length in the system documentation3 .

4.1      T EMPORAL V IEWS

Temporal views are oriented around visualizing the data stream (e.g. images, actions, rewards) as a
sequence of events ordered along the time dimension. We have implemented three types of temporal
viewports: state viewports, action viewports, and reward viewports, which we now detail.

4.1.1      S TATE V IEWPORT

For visualization, we can classify states as either image-based or non-image based. The type of
observation space influences the corresponding viewport used for visualization. We provide two
examples that illustrate how these differing observation spaces can result in different viewports.
Consider a non-image based observation space, such as that for the inverted pendulum task. Here,
the state vector ~s = {sin(θ), cos(θ), θ̇}, where θ is the angle which the pendulum makes with the
vertical.
We can visualize the state vector components individually, which provides insight into how states
vary across episode timesteps (Figure 2). Since images are easier for humans to interpret, we can
generate an additional viewport using image buffers, that tracks changes in state space to the cor-
responding changes in image space. Having this simultaneous visualization is useful since it now
enables us to jump back and forth between the state representation which the agent receives, and
the corresponding image representation, by simply hovering over the desired timestep in the state
viewport.

   3
       Vizarel is planned to be released as an open source tool

                                                         4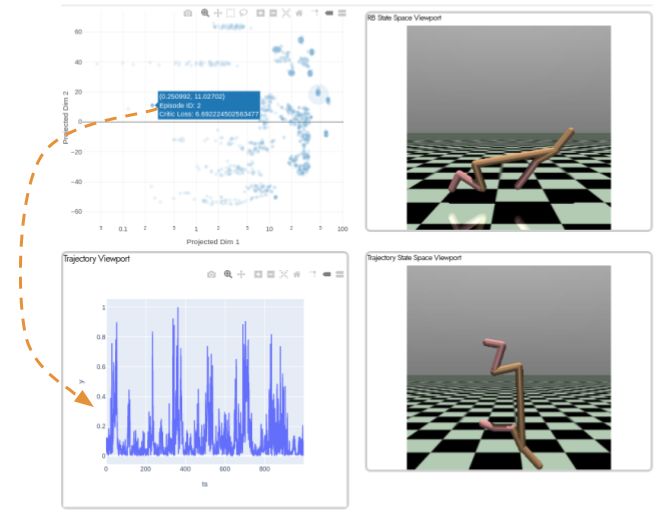
Under review as a conference paper at ICLR 2021

Figure 4: Distribution Viewport Using the lasso tool to select a group of points (dashed gray line) in
the replay buffer viewport (4.2.1), dynamically updates (dashed red line) the distribution viewport (4.2.2) by
computing and plotting the distribution of values for the specified tensor (e.g. actions or rewards).

For environments that have higher dimensional state spaces, such as that of a robotic arm with
multiple degrees of freedom, we can visualize individual state components. However, since this
may not be intuitive, we can also generate an additional viewport to display an image rendering of
the environment to help increase interpretability.

4.1.2    ACTION V IEWPORT

The action viewport is used to visualize how the actions chosen by the agent vary across the episode
(Figure 2). Consider the Pong environment (Bellemare et al., 2013), where the action a at timestep t,
corresponds to the direction in which the paddle should move. A visualization such as the one shown
in Figure 2 can be generated to show the correspondence between actions and states. This allows
the user to easily identify states marked by sudden action transitions, and thus aid debugging. This
idea can easily be extended to agents with stochastic actions, where we could generate a viewport
using histograms to visualize the change in action distribution over time.
For higher dimensional action spaces we can use a technique similar to the one used for state view-
ports, to generate multiple viewports that track individual action dimensions, for example joint
torques for a multilink robot.

4.1.3    R EWARD V IEWPORT

The reward viewport is used to visualize how the rewards received by an agent vary across the
episode. A user can look at the reward viewport together with the state viewport to understand and
find patterns across state transitions that result in high reward. For many environments, the reward
function consists of components weighted by different coefficients. These individual components
are often easier to interpret since they are usually correspond to a physically motivated quantity
tied to agent behaviors that we wish to either reward or penalize. For example, in autonomous
driving environments the reward can be formulated as a function of speed, collision penalties, and
the distance from an optimal trajectory (Agarwal et al.).
In situations where we have access to these reward components, we can generate multiple viewports
each of which visualize different components of the reward function. The viewports discussed so
far can be combined to provide the user more insight into the correspondence between states (state
viewport), actions (action viewport), and the components of the reward function (reward viewport)
that the agent is attempting to maximize. Such a visualization could help alert researchers to reward
hacking (Amodei et al., 2016).

4.2     S PATIAL V IEWS

Spatial views are oriented around visualizing the data stream as a spatial distribution of events. We
have implemented three types of spatial viewports: replay buffer viewports, distribution viewports,
and trajectory viewports, that we now describe.

                                                      5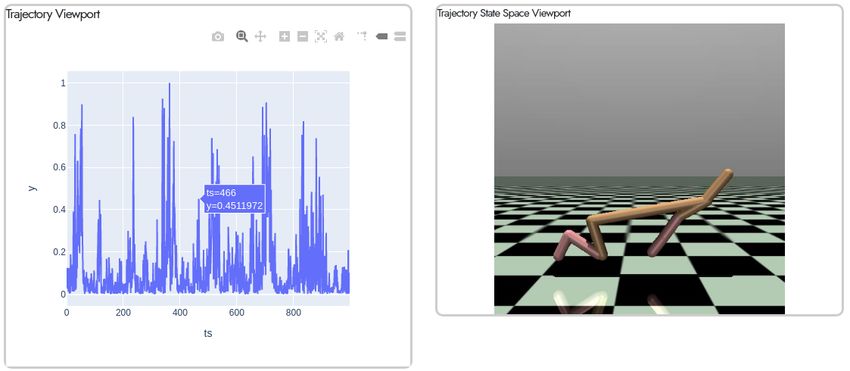
Under review as a conference paper at ICLR 2021

Figure 5: Trajectory Viewport Selecting points in the replay buffer viewport (4.2.1), causes the trajectory
viewport (4.2.3) to dynamically update and plot the absolute normalized TD error values over the length of
the trajectory. Hovering over points in the trajectory viewport, allows the user to view a rendering of the state
corresponding to that timestep in the generated state viewport (4.1.1).

4.2.1      R EPLAY B UFFER V IEWPORT
As formulated in §3, the replay buffer stores the agent’s experiences et = (st , at , rt , st+1 ) in a
buffer B = {e0 , e1 , ..., eT }∀i ∈ [0, T ]. For off-policy algorithms, the replay buffer is of crucial
importance, since it effectively serves as an online dataset for agent policy updates (Fu et al., 2020).
In the supervised learning setting, there exist tools4 to visualize datasets, that provide the user with
an intuition for the underlying data distribution. The replay buffer viewport aims to provide similar
intuitions for the reinforcement learning setting by visualizing the distribution of data samples in the
replay buffer.
Since the individual elements of the replay buffer are at least a four-dimensional vector et , this rules
out the possibility of generating viewports to visualize data in the original space. We can instead
visualize the data samples by transforming the points (van der Maaten & Hinton, 2008) to a lower-
dimensional representation. This technique helps visualize the distribution of samples in the replay
buffer, which is a visual representation of the replay buffer diversity (de Bruin et al.).
The size of the replay buffer can be quite large (Zhang & Sutton, 2018), which can lead to difficulties
while navigating the space of points visualized in the replay buffer viewport. To nudge (Thaler &
Sunstein, 2009) the user towards investigating samples of higher potential interest, we scale the size
of points in proportion to the absolute normalized TD error (Sutton & Barto, 2018), which has been
used in past work (Schaul et al., 2016) as a measure of sample priority during experience replay.
Moreover, the replay buffer viewport can be combined with the state viewport to simultaneously
visualize an image rendering of the state, by tracking changes as the user hovers over points in the
replay buffer viewport (Figure 3).

4.2.2      D ISTRIBUTION V IEWPORT
The distribution viewport (Figure 4) complements the replay buffer viewport by allowing the user to
select clusters of data samples and ask questions regarding the distribution of action, rewards, and
other relevant tensors for the selected group of points.
Users might ask questions like:
- What is the distribution of actions the agent took for these groups of similar states?
- What is the distribution of rewards for the state action transitions?
- What is the overall diversity of states which the agent has visited?
If the updates to the agent policy result in better task performance, the entropy of the action distribu-
tion should reduce over time (discounting any external annealing caused due to exploration), which
can be easily verified through this viewport. In the limit, the distribution of actions for a group of
similar points should converge to a Dirac distribution, since the optimal policy for an infinite horizon
discounted MDP is a stationary distribution (Puterman, 2005). In practice, observing the distribution
converging around the mean value could indicate a promising policy training experiment.
   4
       https://github.com/PAIR-code/facets

                                                       6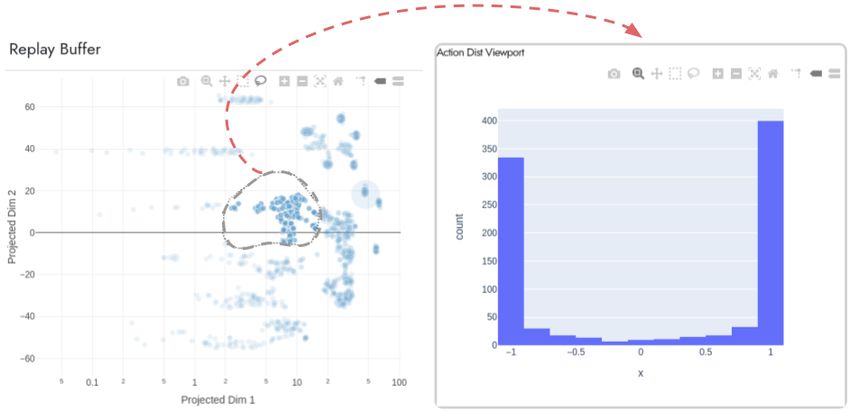
Under review as a conference paper at ICLR 2021
Figure 6: Vizarel Workflow Diagram Typical steps during policy debugging, and how the designed system
fits into this workflow. The system takes as input a policy saved during a checkpoint and evaluates the policy
through a specified number of rollouts. This data is then visualized through viewports specified by the user,
that are used for debugging the policy through making guided changes.
For multi-dimensional action spaces, the viewport could be repurposed to display the variance of
the action distribution, plot different projections of the action distribution, or use more sophisticated
techniques such as projection pursuit (Huber, 1985).
4.2.3 T RAJECTORY V IEWPORT
A fusion of the components from the spatial and temporal views leads to a spatio-temporal view, an
example of which is the trajectory viewport (Figure 5). The replay buffer viewport alone visualizes
the spatial nature of the points in the replay buffer but does not display the temporal nature of
trajectories. Being able to switch between spatial and temporal views is crucial when understanding
and debugging policies. This is supported by selecting points in the replay buffer viewport, which
then retrieves the corresponding trajectory.
The X coordinate in the trajectory viewport represents the timestep, and the Y coordinate is the
absolute TD error, normalized to lie within [0, 1]. Hovering over points in the trajectory viewport
retrieves an image rendering of the corresponding state in the state viewport. This correspondence
enables the user to easily navigate through and visualize action sequences in the trajectory that
consistently have a high TD error, thus speeding up debugging of policies.
5 WALKTHROUGH
We now detail an example workflow of how the
system can be used in a real scenario. Figure
6, illustrates how Vizarel fits into an RL re-
searcher’s policy debugging workflow. Train-
ing a successful agent policy often requires
multiple iterations of changing algorithm hy-
perparameters.
To speed up and increase the intuitiveness of
this process, the researcher can load a stored
checkpoint of the policy into the system, and
evaluate a specified number of policy rollouts.
Empirically, we’ve found that there should be
enough rollouts to ensure sufficient coverage of
the state space, since this influences the scope
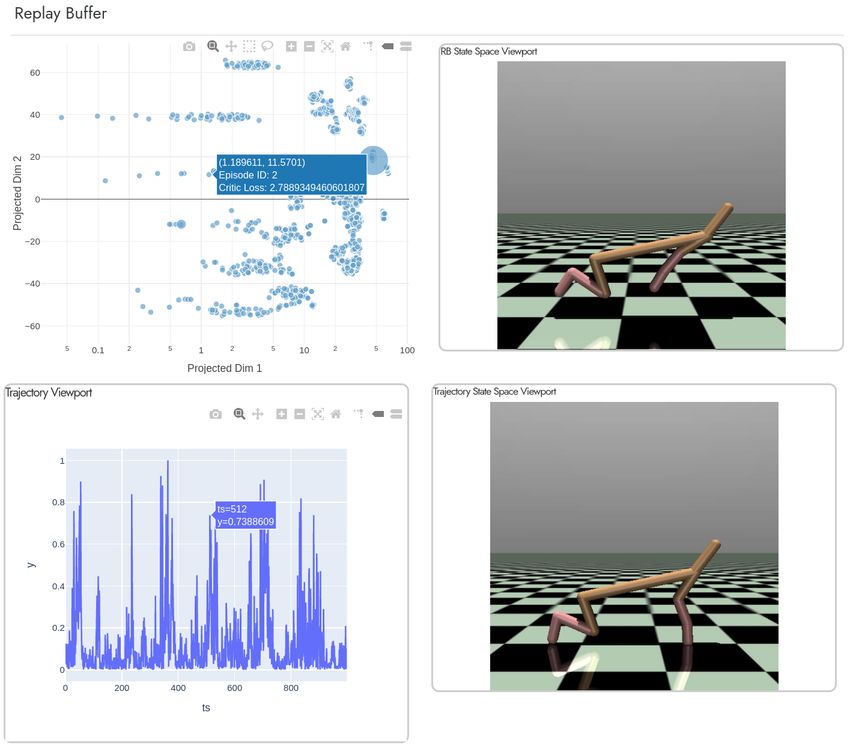
of questions which can be posed during debug- Figure 7: Spatio-Temporal Interaction Visual-
ging (e.g. through the replay buffer viewport). izing the replay buffer viewport (4.2.1) (spatial view),
These rollouts can then be visualized and inter- and trajectory viewport (4.2.3) (temporal view), along
acted with through specifying the required data with overlays to independently track image renderings
of states in both as a state space viewport (4.1.1). Nav-
streams and generating different viewports. igating between these viewports allows the user to ob-
Figure 7, shows an example of replay buffer, serve both agent spatial and temporal behavior, which
state, and trajectory viewports generated for a could facilitate better insights during debugging.
7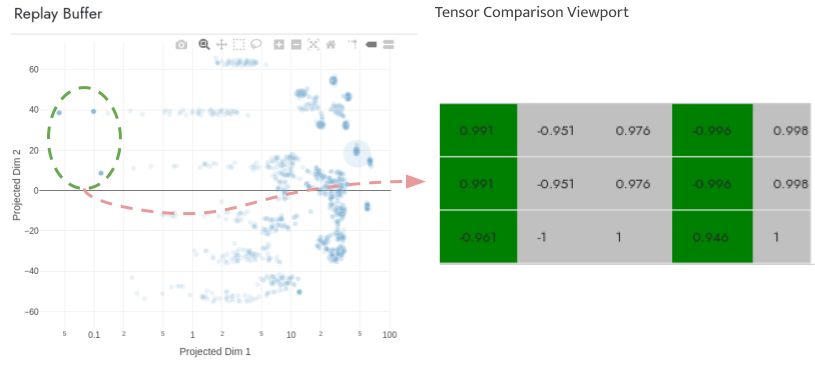
Under review as a conference paper at ICLR 2021

Figure 8: Comparing TD error along an agent trajectory Visualizing the trajectory viewport (4.2.3),
allows the user to compare the TD error at different timesteps along the trajectory, along with the associated
state viewport (4.1.1). An example interaction is visualized here by hovering over regions of potential interest
in the trajectory viewport. This simultaneous view allows the user to easily compare and draw similarities
between action sequences which cause large changes in TD error.

policy trained using DDPG on the HalfCheetah
task. The high variance in the TD error suggests the presence of critic overestimation bias (Thrun &
Schwartz), which could be remedied by using algorithms known to reduce the impact of this issue
(Fujimoto et al., 2018; Hasselt, 2010). Figure 8 shows how the user can compare the TD error along
the agent trajectory. Hovering over regions of potential interest in the trajectory viewport allows the
user to find action sequences that cause high variance in the TD error. A similar technique could
be used to visualize clusters of states in the replay buffer space with high TD error (Figure 3). This
approach could enable the user to identify patterns in states across space or time that persistently
have high TD error, and design methods to mitigate this (Amodei et al., 2016).
Another approach the user could take is to generate a distribution viewport (Figure 4), and identify
the distribution of actions in the vicinity of states with a high TD error. If similar states persistently
have a higher action and/or reward variance, this suggests that the usage of variance reduction tech-
niques could help learning (Schulman et al., 2018; Romoff et al., 2018). Once promising avenues
for modification have been identified, the user can make guided changes, and retrain the policy.

6    C ONCLUSION
In this paper, we have introduced a visualization tool, Vizarel, that helps interpret and debug RL
algorithms. Existing tools which we use to gain insights into our agent policies and RL algorithms
are constrained by design choices that were made for the supervised learning framework. To that
end, we identified features that an interactive system for debugging and interpreting RL algorithms
should encapsulate, built an instantiation of this system which we plan to release as an open source
tool, and provided a walkthrough of an example workflow of how the system could be used.
There are multiple features under development that contribute towards both the core system. One
feature is the integration of additional data streams such as saliency maps (Greydanus et al., 2018)
to complement the state viewport. Another is designing the capability to use the system in domains
that lack a visual component, for example in healthcare (Yu et al., 2020) or education (Reddy et al.).
An extension is to add search capabilities that allow the user to easily traverse, query, and identify
regions of interest in the replay buffer viewport.
Vizarel suggests a number of avenues for future research. First, we hypothesize that it could help
design metrics that better capture priority during experience replay (Schaul et al., 2016). Second, it
could help the researchers create safety mechanisms early on in the training process through identi-
fying patterns in agent failure conditions (Amodei et al., 2016). Another possible research direction
this tool catalyzes is the construction of reproducible visualizations through plugins integrated into
the core system.
We anticipate that the best features yet to be built will emerge through iterative feedback, deploy-
ment, and usage in the broader reinforcement learning and interpretability research communities.

                                                       8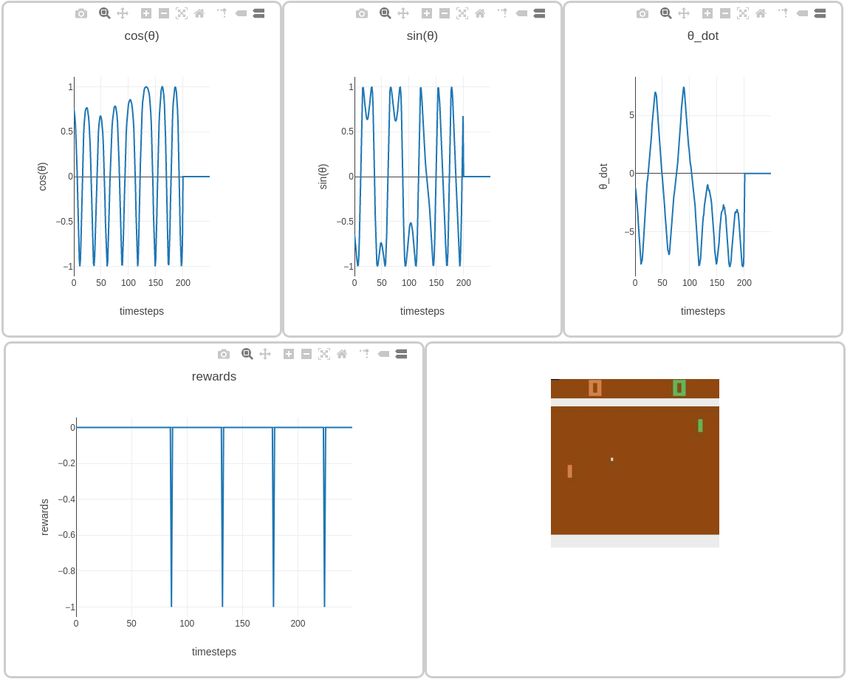
Under review as a conference paper at ICLR 2021

ACKNOWLEDGMENTS
SVD is supported by the CMU Argo AI Center for Autonomous Vehicle Research. BE is supported
by the Fannie and John Hertz Foundation and the National Science Foundation (DGE1745016).
Any opinions, findings, recommendations, and conclusions expressed in this material are those of
the author(s) and do not reflect the views of funding agencies.

R EFERENCES
Martı́n Abadi, Ashish Agarwal, Paul Barham, Eugene Brevdo, Zhifeng Chen, Craig Citro, Greg S.
 Corrado, Andy Davis, Jeffrey Dean, Matthieu Devin, Sanjay Ghemawat, Ian Goodfellow, Andrew
 Harp, Geoffrey Irving, Michael Isard, Yangqing Jia, Rafal Jozefowicz, Lukasz Kaiser, Manjunath
 Kudlur, Josh Levenberg, Dandelion Mané, Rajat Monga, Sherry Moore, Derek Murray, Chris
 Olah, Mike Schuster, Jonathon Shlens, Benoit Steiner, Ilya Sutskever, Kunal Talwar, Paul Tucker,
 Vincent Vanhoucke, Vijay Vasudevan, Fernanda Viégas, Oriol Vinyals, Pete Warden, Martin Wat-
 tenberg, Martin Wicke, Yuan Yu, and Xiaoqiang Zheng. TensorFlow: Large-scale machine learn-
 ing on heterogeneous systems, 2015. URL https://www.tensorflow.org/. Software
 available from tensorflow.org.
Tanmay Agarwal, Hitesh Arora, Tanvir Parhar, Shubhankar Deshpande, and Jeff Schneider. Learn-
  ing to Drive using Waypoints. pp. 7.
Dan Amir and Ofra Amir. HIGHLIGHTS: Summarizing Agent Behavior to People. pp. 9.
Dario Amodei, Chris Olah, Jacob Steinhardt, Paul Christiano, John Schulman, and Dan Mané. Con-
  crete Problems in AI Safety. arXiv:1606.06565 [cs], July 2016. arXiv: 1606.06565.
Akanksha Atrey, Kaleigh Clary, and David Jensen. Exploratory not explanatory: Counterfactual
  analysis of saliency maps for deep reinforcement learning. In International Conference on Learn-
  ing Representations, 2020. URL https://openreview.net/forum?id=rkl3m1BFDB.
Marc G. Bellemare, Yavar Naddaf, Joel Veness, and Michael Bowling. The Arcade Learning Envi-
 ronment: An Evaluation Platform for General Agents. Journal of Artificial Intelligence Research,
 47:253–279, June 2013. ISSN 1076-9757. doi: 10.1613/jair.3912. arXiv: 1207.4708.
Davide Calvaresi, Amro Najjar, Michael Schumacher, and Kary Främling. Explainable, Transparent
  Autonomous Agents and Multi-Agent Systems: First International Workshop, EXTRAAMAS 2019,
  Montreal, QC, Canada, May 13–14, 2019, Revised Selected Papers, volume 11763. Springer
  Nature, 2019.
Tim de Bruin, Jens Kober, Karl Tuyls, and Robert Babuska. Experience Selection in Deep Rein-
  forcement Learning for Control. pp. 56.
Finale Doshi-Velez and Been Kim. Towards A Rigorous Science of Interpretable Machine Learning.
  arXiv:1702.08608 [cs, stat], March 2017. arXiv: 1702.08608.
Justin Fu, Aviral Kumar, Ofir Nachum, George Tucker, and Sergey Levine. D4RL: Datasets for
  Deep Data-Driven Reinforcement Learning. arXiv:2004.07219 [cs, stat], June 2020. arXiv:
  2004.07219.
Scott Fujimoto, Herke van Hoof, and David Meger. Addressing Function Approximation Error in
  Actor-Critic Methods. arXiv:1802.09477 [cs, stat], October 2018. arXiv: 1802.09477.
Yosuke Fukuchi, Masahiko Osawa, Hiroshi Yamakawa, and Michita Imai. Autonomous self-
  explanation of behavior for interactive reinforcement learning agents. Proceedings of the 5th In-
  ternational Conference on Human Agent Interaction, Oct 2017. doi: 10.1145/3125739.3125746.
  URL http://dx.doi.org/10.1145/3125739.3125746.
Sam Greydanus, Anurag Koul, Jonathan Dodge, and Alan Fern. Visualizing and Understanding
  Atari Agents. arXiv:1711.00138 [cs], September 2018. arXiv: 1711.00138.
Hado V. Hasselt. Double Q-learning. In J. D. Lafferty, C. K. I. Williams, J. Shawe-Taylor, R. S.
  Zemel, and A. Culotta (eds.), Advances in Neural Information Processing Systems 23, pp. 2613–
  2621. Curran Associates, Inc., 2010.

                                                9
Under review as a conference paper at ICLR 2021
Bradley Hayes and Julie A. Shah. Improving Robot Controller Transparency Through Autonomous
Policy Explanation. In Proceedings of the 2017 ACM/IEEE International Conference on Human-
Robot Interaction, pp. 303–312, Vienna Austria, March 2017. ACM. ISBN 978-1-4503-4336-7.
doi: 10.1145/2909824.3020233.
Sandy H. Huang, David Held, Pieter Abbeel, and Anca D. Dragan. Enabling Robots to Communi-
cate their Objectives. Robotics: Science and Systems XIII, July 2017. doi: 10.15607/RSS.2017.
XIII.059. arXiv: 1702.03465.
Peter J. Huber. Projection Pursuit. The Annals of Statistics, 13(2):435–475, June 1985. ISSN
0090-5364. doi: 10.1214/aos/1176349519.
Zoe Juozapaitis, Anurag Koul, Alan Fern, Martin Erwig, and Finale Doshi-Velez. Explainable rein-
forcement learning via reward decomposition. In IJCAI/ECAI Workshop on Explainable Artificial
Intelligence, 2019.
Minsuk Kahng, Pierre Y. Andrews, Aditya Kalro, and Duen Horng Chau. ActiVis: Visual Ex-
ploration of Industry-Scale Deep Neural Network Models. arXiv:1704.01942 [cs, stat], August
2017. arXiv: 1704.01942.
Ashish Kapoor, Bongshin Lee, Desney Tan, and Eric Horvitz. Interactive optimization for steering
machine classification. In Proceedings of the SIGCHI Conference on Human Factors in Com-
puting Systems, CHI ’10, pp. 1343–1352, Atlanta, Georgia, USA, April 2010. Association for
Computing Machinery. ISBN 978-1-60558-929-9. doi: 10.1145/1753326.1753529.
Josua Krause, Adam Perer, and Kenney Ng. Interacting with Predictions: Visual Inspection of
Black-box Machine Learning Models. In Proceedings of the 2016 CHI Conference on Hu-
man Factors in Computing Systems, CHI ’16, pp. 5686–5697, San Jose, California, USA, May
2016. Association for Computing Machinery. ISBN 978-1-4503-3362-7. doi: 10.1145/2858036.
2858529.
Yann LeCun, Yoshua Bengio, and Geoffrey Hinton. Deep learning. Nature, 521(7553):436–444,
May 2015. ISSN 0028-0836, 1476-4687. doi: 10.1038/nature14539.
Long-Ji Lin. Self-improving reactive agents based on reinforcement learning, planning and teaching.
pp. 29.
Prashan Madumal, Tim Miller, Liz Sonenberg, and Frank Vetere. Distal explanations for model-free
explainable reinforcement learning, 2020.
Sean McGregor, Hailey Buckingham, Thomas G Dietterich, Rachel Houtman, Claire Montgomery,
and Ronald Metoyer. Facilitating testing and debugging of markov decision processes with inter-
active visualization. In 2015 IEEE Symposium on Visual Languages and Human-Centric Com-
puting (VL/HCC), pp. 53–61. IEEE, 2015.
Volodymyr Mnih, Koray Kavukcuoglu, David Silver, Alex Graves, Ioannis Antonoglou, Daan Wier-
stra, and Martin Riedmiller. Playing Atari with Deep Reinforcement Learning. arXiv:1312.5602
[cs], December 2013. arXiv: 1312.5602.
Emre O. Neftci and Bruno B. Averbeck. Reinforcement learning in artificial and biological
systems. Nature Machine Intelligence, 1(3):133–143, March 2019. ISSN 2522-5839. doi:
10.1038/s42256-019-0025-4.
Chris Olah, Alexander Mordvintsev, and Ludwig Schubert. Feature Visualization. Distill, 2(11):e7,
November 2017. ISSN 2476-0757. doi: 10.23915/distill.00007.
Chris Olah, Arvind Satyanarayan, Ian Johnson, Shan Carter, Ludwig Schubert, Katherine Ye, and
Alexander Mordvintsev. The Building Blocks of Interpretability. Distill, 3(3):e10, March 2018.
ISSN 2476-0757. doi: 10.23915/distill.00010.
Erika Puiutta and Eric Veith. Explainable reinforcement learning: A survey. arXiv preprint
arXiv:2005.06247, 2020.
10Under review as a conference paper at ICLR 2021
Nikaash Puri, Sukriti Verma, Piyush Gupta, Dhruv Kayastha, Shripad Deshmukh, Balaji Krishna-
murthy, and Sameer Singh. Explain your move: Understanding agent actions using specific and
relevant feature attribution. In International Conference on Learning Representations, 2020. URL
https://openreview.net/forum?id=SJgzLkBKPB.
Martin L. Puterman. Markov decision processes: discrete stochastic dynamic programming. Wiley
series in probability and statistics. Wiley-Interscience, Hoboken, NJ, 2005. ISBN 978-0-471-
72782-8. OCLC: 254152847.
Siddharth Reddy, Sergey Levine, and Anca Dragan. Accelerating Human Learning with Deep Re-
inforcement Learning. pp. 9.
Siddharth Reddy, Anca D Dragan, Sergey Levine, Shane Legg, and Jan Leike. Learning human
objectives by evaluating hypothetical behavior. arXiv preprint arXiv:1912.05652, 2019.
Joshua Romoff, Peter Henderson, Alexandre Piché, Vincent Francois-Lavet, and Joelle Pineau. Re-
ward Estimation for Variance Reduction in Deep Reinforcement Learning. arXiv:1805.03359 [cs,
stat], November 2018. arXiv: 1805.03359.
Christian Rupprecht, Cyril Ibrahim, and Christopher J. Pal. Finding and visualizing weaknesses of
deep reinforcement learning agents. In International Conference on Learning Representations,
2020. URL https://openreview.net/forum?id=rylvYaNYDH.
Arvind Satyanarayan, Dominik Moritz, Kanit Wongsuphasawat, and Jeffrey Heer. Vega-Lite: A
Grammar of Interactive Graphics. IEEE Transactions on Visualization and Computer Graphics,
23(1):341–350, January 2017. ISSN 1077-2626. doi: 10.1109/TVCG.2016.2599030.
Tom Schaul, John Quan, Ioannis Antonoglou, and David Silver. Prioritized Experience Replay.
arXiv:1511.05952 [cs], February 2016. arXiv: 1511.05952.
John Schulman, Philipp Moritz, Sergey Levine, Michael Jordan, and Pieter Abbeel. High-
Dimensional Continuous Control Using Generalized Advantage Estimation. arXiv:1506.02438
[cs], October 2018. arXiv: 1506.02438.
Pedro Sequeira and Melinda Gervasio. Interestingness elements for explainable reinforcement learn-
ing: Understanding agents’ capabilities and limitations. Artificial Intelligence, 288:103367, Nov
2020. ISSN 0004-3702. doi: 10.1016/j.artint.2020.103367. URL http://dx.doi.org/10.
1016/j.artint.2020.103367.
Karen Simonyan, Andrea Vedaldi, and Andrew Zisserman. Deep Inside Convolutional Networks:
Visualising Image Classification Models and Saliency Maps. arXiv:1312.6034 [cs], April 2014.
arXiv: 1312.6034.
Hendrik Strobelt, Sebastian Gehrmann, Hanspeter Pfister, and Alexander M. Rush. LST-
MVis: A Tool for Visual Analysis of Hidden State Dynamics in Recurrent Neural Networks.
arXiv:1606.07461 [cs], October 2017. arXiv: 1606.07461.
Richard S. Sutton and Andrew G. Barto. Reinforcement learning: an introduction. Adaptive com-
putation and machine learning series. The MIT Press, Cambridge, Massachusetts, second edition
edition, 2018. ISBN 978-0-262-03924-6.
Richard H. Thaler and Cass R. Sunstein. Nudge: improving decisions about health, wealth, and
happiness. Penguin Books, New York, rev. and expanded ed edition, 2009. ISBN 978-0-14-
311526-7.
Sebastian Thrun and Anton Schwartz. Issues in Using Function Approximation for Reinforcement
Learning. pp. 9.
Laurens van der Maaten and Geoffrey Hinton. Visualizing Data using t-SNE. 9:2579–2605, 2008.
Jasper van der Waa, Jurriaan van Diggelen, Karel van den Bosch, and Mark Neerincx. Contrastive
Explanations for Reinforcement Learning in terms of Expected Consequences. arXiv:1807.08706
[cs, stat], July 2018. arXiv: 1807.08706.
11Under review as a conference paper at ICLR 2021
Kanit Wongsuphasawat, Daniel Smilkov, James Wexler, Jimbo Wilson, Dandelion Mane, Doug
Fritz, Dilip Krishnan, Fernanda B. Viegas, and Martin Wattenberg. Visualizing Dataflow Graphs
of Deep Learning Models in TensorFlow. IEEE Transactions on Visualization and Computer
Graphics, 24(1):1–12, January 2018. ISSN 1077-2626. doi: 10.1109/TVCG.2017.2744878.
Ji Soo Yi, Youn ah Kang, John Stasko, and J.A. Jacko. Toward a Deeper Understanding of the Role
of Interaction in Information Visualization. IEEE Transactions on Visualization and Computer
Graphics, 13(6):1224–1231, November 2007. ISSN 1077-2626, 1941-0506, 2160-9306. doi:
10.1109/TVCG.2007.70515.
Jason Yosinski, Jeff Clune, Anh Nguyen, Thomas Fuchs, and Hod Lipson. Understanding Neural
Networks Through Deep Visualization. pp. 12.
Chao Yu, Jiming Liu, and Shamim Nemati. Reinforcement Learning in Healthcare: A Survey.
arXiv:1908.08796 [cs], April 2020. arXiv: 1908.08796.
Matthew D. Zeiler and Rob Fergus. Visualizing and Understanding Convolutional Networks.
arXiv:1311.2901 [cs], November 2013. arXiv: 1311.2901.
Shangtong Zhang and Richard S. Sutton. A Deeper Look at Experience Replay. arXiv:1712.01275
[cs], April 2018. arXiv: 1712.01275.
12Under review as a conference paper at ICLR 2021
A PPENDIX
A DDITIONAL V IEWPORT D ETAILS
T ENSOR C OMPARISON V IEWPORT
For environments that have higher dimensional action spaces, it is hard for the user to understand
how neighboring points in the replay buffer viewport differ. This becomes especially relevant for
diagnosing clusters of points that have a higher TD error. The tensor comparison viewport (Figure
9) enables the user to easily select points and then compare them along the dimensions of interest,
which for example could be actions. Dimensions that have a standard deviation beyond a speci-
fied threshold are automatically highlighted, which enables the user to focus on the dimensions of
interest.
Figure 9: Tensor Comparison Viewport Selecting points (dashed green line) in the replay buffer viewport
(4.2.1), and generating (dashed red line) the tensor comparison viewport, allows the user to compare tensors
(e.g. actions or states), where dimensions of higher variance are automatically highlighted. This could lead to
faster debugging in environments where each dimension corresponds to physically intuitive quantities.
C ONSTRUCTING V IEWPORTS
We describe how a user could create a new viewport through an example. However, we defer an
extended discussion to the system documentation, since reading the source code and give the user
more insight. As mentioned in Section 4, viewports are generated by chaining together different
visualization elements. Various viewports we introduced along with the visualization elements they
make use of are:
1. image buffers: state viewport
2. line plots: action viewport, reward viewport, trajectory viewport
3. scatter plots: replay buffer viewport
4. histograms: distribution viewport
Note that these primitives are not fixed and are bound to change if the creation of different viewports
necessitates their expansion. However, we’ve found them to be a good starting point to provide
the minimal functionality required to construct new viewports. For example the construction of a
saliency map viewport, could be done using an image buffer and a line plot.
There exist utilities in the system to handle the rollout of agent policies, and storage of generated
metadata. However, the user would still need to provide code to generate saliency maps 5 . Once the
metadata has been generated, the user specifies which viewports to generate (e.g. core viewports
and custom viewports) along with a visual layout for the dashboard. The system then generates an
interactive interface with the specified viewports and layout, that the user can use to debug the agent
policy and perform further analysis.
This viewport could further be incorporated as a plugin or extension to the core system and dis-
tributed to a community of users in the future. The exact details for this are not concrete yet, since
we expect there to emerge a robust process through iterative design changes, as the tool finds broader
usage.
5
for which there exist open source tools
13Under review as a conference paper at ICLR 2021
A LGORITHMS
R EPLAY B UFFER V IEWPORT: P ROJECTION
Algorithm 1: Procedure to generate samples for the replay buffer viewport
Result: Data samples from replay buffer transformed from original space Rn to lower
dimensional space Rd , where n >> d
Load data samples di from replay buffer into memory;
Where, di = (si , ai , ri , si+1 ), i ∈ (0, T ) and T is the episode timestep;
for i=0; i < T; i++ do
// create data matrix from replay buffer samples;
data[i] = di ;
end
transform = compute transform(data, type); // where, type ∈ [PCA, TSNE, UMAP]
reduced points = transform(data);
R EPLAY B UFFER V IEWPORT: S AMPLE I NFLUENCE V ISUALIZATION
Algorithm 2: Procedure to compute visual size of data samples in the replay buffer viewport
Result: Visual size of data samples in replay buffer viewport transformed in proportion of their
influence on the agent policy
Load data samples di from replay buffer into memory;
Where, di = (si , ai , ri , si+1 ), i ∈ (0, T ) and T is the episode timestep;
Load sample metadata mi into memory;
Where, mi stores the TD error for each sample (for relevant algorithms) ;
for i=0; i < T; i++ do
data[i] = mi ;
end
d min = min(data);
d max = max(data);
for i=0; i< T; i++ do
// p[i] stores the normalized TD error value, and (c min, c max) is the range to which
values are mapped;
p[i] = d p[i]−d min
max−d min × (c max − c min) + (c min);
// r[i] stores the radius of the point to be plotted in the replay buffer viewport ;
q
r[i] = p[i]π ;
end
14Under review as a conference paper at ICLR 2021
Figure 10: Visualizing the replay buffer for hard exploration tasks Tasks such as Montezuma’s
revenge are classic examples of hard exploration tasks. Here we show how the replay buffer viewport, can help
visualize the distribution of data samples in the replay buffer.
A LTERNATE E NVIRONMENTS
H ARD E XPLORATION
We’ve also experimented with using this tool for procedural, hard-exploration tasks such as Mon-
tezuma’s Revenge. Figure 10, shows how the replay buffer viewport can be used to visualize the
distribution of data samples in the replay buffer. Since, the observations returned from the environ-
ment are images, we extract the embeddings computed by the feature extraction model in the agent
policy, and use these for the projection technique described in the Appendix (Algorithms).
U SER S TUDY
We conducted a user study6 from RL users for feedback and an extended evaluation of potential use
cases a tool such as the one described and implemented in this paper would serve.
These questions were of both a numerical and subjective type. We now list both types along with
preliminary results
N UMERICAL QUESTIONS
• On a scale of 0-10, do you think Vizarel would help you identify bugs in your RL algo-
rithms? Average: 7.5
• On a scale of 0-10, do you think Vizarel would help you identify improvements in your RL
algorithms? Average: 7.0
• On a scale of 0-10, do you think Vizarel would help you understand whether your RL
algorithms are working as intended? Average: 8.0
S UBJECTIVE QUESTIONS ( SELECTED )
• Are there specific settings where you think this tool might help answer questions that you
might otherwise not easily been able to?
– To show the effects of changes in reward function coefficients
– Surfacing important points in the agent trajectory history
• Which features do you think are missing and would be a useful addition to have?
– Add the capability to search over the replay buffer viewport and filter events based on
search criteria.
– Provide a documented approach to load in agent policies
– More details on how to create plugins
6
Results from this are preliminary, as the survey is still in progress
15Under review as a conference paper at ICLR 2021
– Display agent trajectories in the replay buffer viewport
Future work along this direction would include creating test scenarios for debugging, and running
an A/B test for users, contrasting their experience with existing tools vs the proposed tool along
dimensions of efficacy in debugging RL algorithms.
P ERFORMANCE
We’ve run measured preliminary performance metrics to help provide insight into how much over-
head running this system would create7 . These numbers were collected for a visualization of an
agent trained using DDPG on the HalfCheetah-v2 task, about 35% of the way to task completion.
The vizarel interface was generated on a machine with an Intel(R) Xeon(R) CPU E5-2620 v4 @
2.10GHz processor, with a 4TB HDD, and 128 GB RAM.
Tasks Time
Generate Viewports 45 sec
Load Dashboard 5 sec
Policy Rollouts 2 minutes
Logging Overhead Fraction (Relative to Tensorboard) 1
Note that the policy rollout time is conditional on the length of the episode trajectory. These were
collected for the HalfCheetah-v2 task
7
Note that these numbers may not be indicative of the final numbers, since the codebase is under active
development
16You can also read