Interactive Visualization of Fused fMRI and DTI for Planning Brain Tumor Resections
←
→
Page content transcription
If your browser does not render page correctly, please read the page content below
Interactive Visualization of Fused fMRI and DTI
                          for Planning Brain Tumor Resections
 Jorik Blaas1 , Charl P. Botha1 , Charles Majoie2 , Aart Nederveen2 , Frans M. Vos3 and Frits H. Post1
                      1 Data Visualization Group, Delft University of Technology
                 2 Department of Radiology, Academic Medical Centre, Amsterdam
                    3 Quantitative Imaging Group, Delft University of Technology

                                                          ABSTRACT
The surgical removal of brain tumors can lead to functional impairment. Therefore it is crucial to minimize the damage to
important functional areas during surgery. These areas can be mapped before surgery by using functional MRI. However,
functional impairment is not only caused by damage to these areas themselves. It is also caused by damage to the fiber
bundles that connect these areas with the rest of the brain. Diffusion Tensor Images (DTI) can add information about
these connecting fiber bundles. In this paper we present interactive visualization techniques that combine DTI, fMRI and
structural MRI to assist the planning of brain tumor surgery. Using a fusion of these datasets, we can extract the fiber
bundles that pass through an offset region around the tumor, as can be seen in Figure 1. These bundles can then be explored
by filtering on distance to the tumor, or by selecting a specific functional area. This approach enables the surgeon to
combine all this information in a highly interactive environment in order to explore the pre-operative situation.

                                                    1. INTRODUCTION
Brain tumors are a major health risk. An estimated 43,800 new cases of primary non-malignant and malignant brain
and central nervous system tumors are expected to be diagnosed in the United States in 2005.1 The surgical removal
of brain tumors is a critical operation, as it may lead to functional impairment, but also to recurrent surgery if a tumor
is not completely removed. Therefore, good surgical planning is crucial to minimize damage to important functional
areas. Support from MRI imaging has become standard practice, by presenting patient-specific structural (anatomical)
information to the neurosurgeon. More recently, different MRI imaging modalities are being combined to provide a good
overview of the potentially affected functions.
   An anatomical MRI scan can show both the tumor and important brain structures. In planning tumor resection, it is of
prime importance to determine how the tumor is related to the surrounding anatomical structures.
    Functional MRI is based on the increase in blood flow to the local vasculature that accompanies neural activity in the
brain. In fMRI, the increased oxygen utilization associated with this activity can be detected using an MR pulse sequence
such as BOLD (Blood Oxygenation Level Dependent). The effects are measured using rapid image acquisition (1 frame per
1-4 sec.), with a spatial resolution of 1.5-3 millimeters. The human subject performs certain tasks, such as moving a hand
or foot, and the response can be shown (after a delay) as zones of increased neural activity, or activation zones. Functional
MRI can be of great help to provide a mapping of the brain zones activated by certain motor activities. However, functional
impairment can not only be caused by direct damage to these functional zones, but also by damage to the neural pathways
connecting these zones with other parts of the brain.
    Diffusion Tensor Imaging (DTI) has recently emerged as a technique for the quantification of water diffusion in living
tissue.2, 3 Diffusion is usually represented by a second-order symmetric tensor for each voxel. These tensors describe
the free motion of water molecules in living tissue and can be derived from a sequence of diffusion-weighted scans, each
sensitive to a different diffusion direction. This makes DTI usable for imaging fibrous tissue, such as neural brain fibers, as
there are large differences in diffusion speed parallel with and perpendicular to the fiber. By eigen analysis of the tensors,
the anisotropy and the main directions of diffusion can be extracted. Thus, DTI can be used to visualize the connection
structure of neural fibers in the living human brain, by tracing paths following the strongest diffusion directions. This
    Further author information: (Send correspondence to J. Blaas.)
J.Blaas: E-mail: j.blaas@tudelft.nl, Telephone: 31 15 278468
Figure 1. Combined visualization of a brain tumor, the white matter tractography and the functional areas associated with motor tasks.
The tumor is surrounded by a safety area, which is used to filter and color the fibers in the tractography. Both the tumor and the activation
areas directly influence the color of the fibers.

technique is called fiber tracking, or white matter tractography. For this reason, DTI is now also used for surgical planning
of tumor resection, to add information about these connecting nerve structures, which may be damaged by the resection.
    It is clear that each of the three MRI techniques provide relevant information for tumor resection. The problem is how
to combine the information from these three modalities: structural, functional, and diffusion MRI, and present it to the
neurosurgeon in such a way that it can be helpful for planning the resection.
    In this paper we present an ordered set of visualization tools to examine structure and function of the resection area
around a tumor, and possible access paths for surgery. The main basis for this visualization set is (1) multimodal imaging
(structural, functional, and diffusion MRI), (2) identifying the functional activation zones and neural connections, and (3)
interactive examination of the large multi-modal data sets. Combined visualization of the three types of information leads
to the insight for the neurosurgeon, to support the critical decisions in planning an operation.
    The set of techniques we developed is the result of preliminary work in surgical planning for tumor resection. For many
neurosurgeons, the information presented is quite new and unusual, and together we are searching for an effective way to
present, explore, and utilize this information. At this stage it is not possible to perform rigorous clinical tests to measure
the effectiveness, or to formalize the planning information to be used for intra-operative navigation. The main purpose at
this point is to allow the neurosurgeon to get a clear image of several aspects of the surgery area.
     Our main contributions in this work are the interactive selection and probing techniques that can be used to combine
the information from the three different modalities, each providing a different type of information for the planning. We
present an ordered toolset, which means that it is a balanced, goal-directed set of visualization tools, which fully covers
its area of functionality, and not an open-ended, unstructured collection of tools for free exploration. For this purpose, our
existing interactive platform for DTI data visualization DTII4 was extended.
    This paper is structured as follows: after a discussion of related work, we will present the multi-modal visualization
toolset. It is based on a simple model defining the main visualization components, and describing the functions by combin-
ing these components pairwise and all three. Then we will present a discussion, with conclusions and directions of future
work.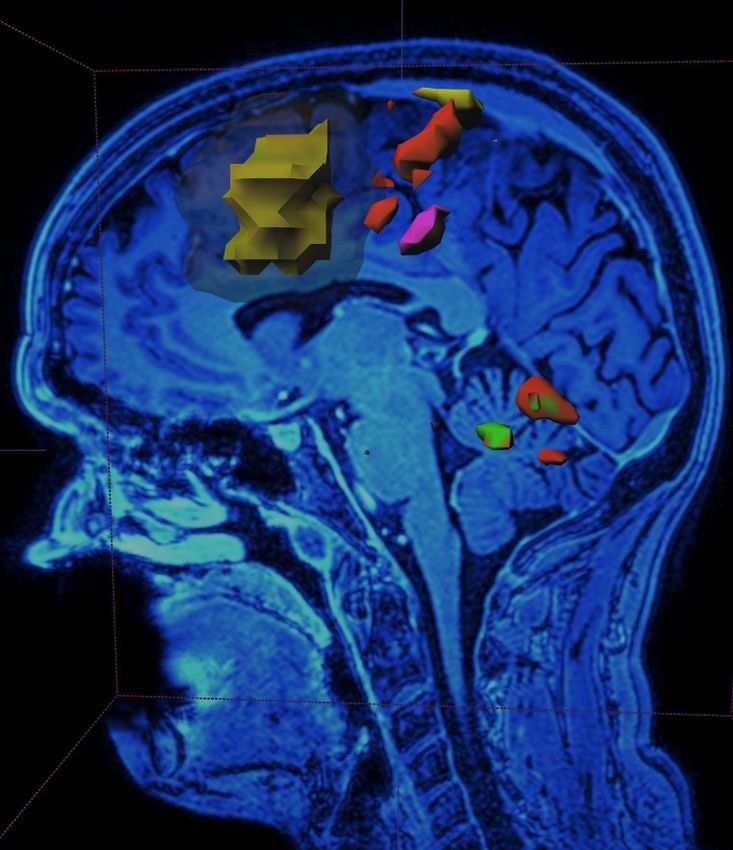
2. RELATED WORK
fMRI and DTI are exciting research fields and the number of publications is growing fast. Both fields provide excellent
additional information for planning brain surgery. In the past few years a number of techniques have been proposed to
combine structural MRI together with different MRI based techniques
    This combination of techniques has been researched in a number of different settings. Specifically, the connectivity of
the primary motor cortex has been studied by Guye et al. who concluded that MRI-correlated DTI is a promising tool to
study the structural basis of functional networks.5
    In the particular field of surgical planning, recent developments have focussed on combining anatomical information
about the tumor with fMRI and DTI. Mori et al. have shown that fMRI and tractography can be used together for pre-
surgical mapping.6 This combination of functional MRI and DTI was tested on a larger patient group by Talos et al.7
    These approaches however usually adhere to a fairly rigid processing pipeline, where user interaction is limited to
viewing the end results. Interactive exploration of the surroundings of the tumor and the activation areas is severely limited.
Our approach focusses on presenting all the information in a comprehensive interactive framework, aimed at exploring all
available data to the fullest extent.

                                  3. DATA ACQUISITION AND PREPARATION
All datasets were acquired on a Philips Intera 3 Tesla MRI scanner. For the structural MRI we used a T1 weighted scan
with a 0.5 × 0.5 × 1 mm resolution.
   A Functional MRI scan was then performed to map the activation of important motor tasks. The activation patterns for
hand and foot motion were imaged on both the left and right side. A repeated 60 second sequence of alternating motion
and rest was used. The resolution of the functional scan was 1.7 × 1.7 × 3.3 mm.
    The DTI datasets were acquired along 16 different diffusion directions. Each direction was scanned twice and averaged
to improve the signal to noise ratio. The scan time was approximately 6 minutes per patient and the final resolution of the
DTI dataset was 2 × 2 × 2 mm.

3.1. Preprocessing
As the data from fMRI and DTI scans need complex preprocessing, we have used third party tools to perform the required
steps on these data. The functional MRI was processed using FEAT, the FMRI Expert Analysis Tool, which is provided as
part of the FSL package.8
    To make the diffusion weighted images from the DTI scan suitable for fiber tracking, a tensor estimation step was
performed using the TEEM toolkit.9

3.2. Registration
Since not all scans could be made in the same frame of reference, a registration step was necessary before the datasets
could be fused.
    We used a semi-automatic registration approach, where the initial transform is automatically determined, after which
the alignment can be fine-tuned by the user while viewing a realtime fusion of both datasets.
   We have chosen to align both the functional and the structural scan to the DTI. To ease the visual alignment process
we presented the user with a fused B0 volume reconstructed from the DTI data together with the scan to be aligned. This
approach turned out to provide valuable feedback to the user, and has made the alignment task relatively easy.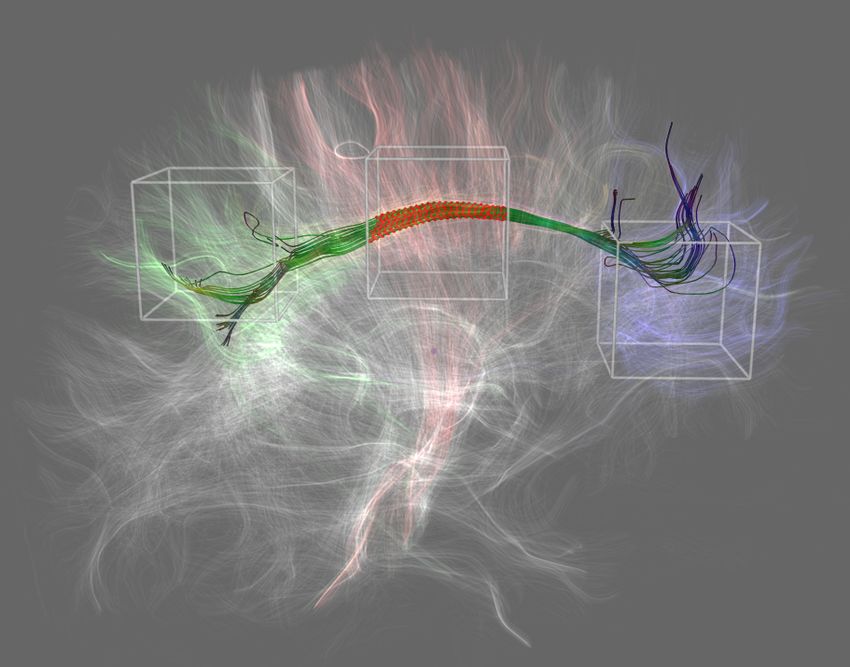
Figure 2. The sliceviewer, showing an structural T1 MRI (left) and the fusion of a structural T1 with a B0 reconstructed from a DTI
scan.

                                         4. VISUALIZATION COMPONENTS
After preprocessing, the data volumes are loaded into the DTII framework. This tool facilitates the interactive inspection
of MRI data by providing a number of visual components that can be used to inspect any aspect of the input datasets. The
fusion of multiple data sets, even with custom blending and compositing functions, is handled by the platform in a highly
responsive way.
    DTII employs the the TEEM library for all data handling and fiber tracking. TEEM is an open-source image processing
and visualization library that also supports tensor processing. Via this toolkit, DTII offers two types of fiber tracking:
fourth-order integration based streamlines on the primary eigenvectors of the diffusion tensors or tensor lines.9
    All visualization methods in DTII support progressive updates in order to maintain high frame-rates even during com-
plex manipulations. DTII was written in C++ and is highly portable, depending only on a few external libraries. Currently,
versions for Windows and Linux are in use. It is complemented by a conversion utility which can convert both MRI and
DTI DICOM series to the native DTII data format. This facilitates deployment in a medical environment.

    The next sections describe the components present in DTII.

4.1. The Slice Viewer
The SliceViewer is a well known component in data visualization, it shows a single cutting plane through a data volume, as
illustrated in Figure 2. The sliceviewer in DTII works in the same way, except that it can operate on an arbitrary combination
of volumes. We can use this to superimpose activation areas on structural scans, but also to assist the alignment process by
showing a red/green fusion of two datasets.

4.2. Tumor Neighborhood Isosurface Rendering
For rendering the geometry of the tumor, we use an ordinary polygon renderer in combination with a marching cubes
surfacer. However, apart from the geometry of the tumor, the surgeon also needs information about the area surrounding
the tumor. Safety zones are normally used in tumor surgery, and for this reason we have chosen to make it possible to
visualize a neighborhood of the tumor by specifying an offset distance. We use an order-independent renderer to show
multiple transparent isosurfaces at the same time, so that both the geometry of the tumor and that of the surrounding safety
margin are visible together. The tumor and an offset surface at a user-specified distance are shown in Figure 3.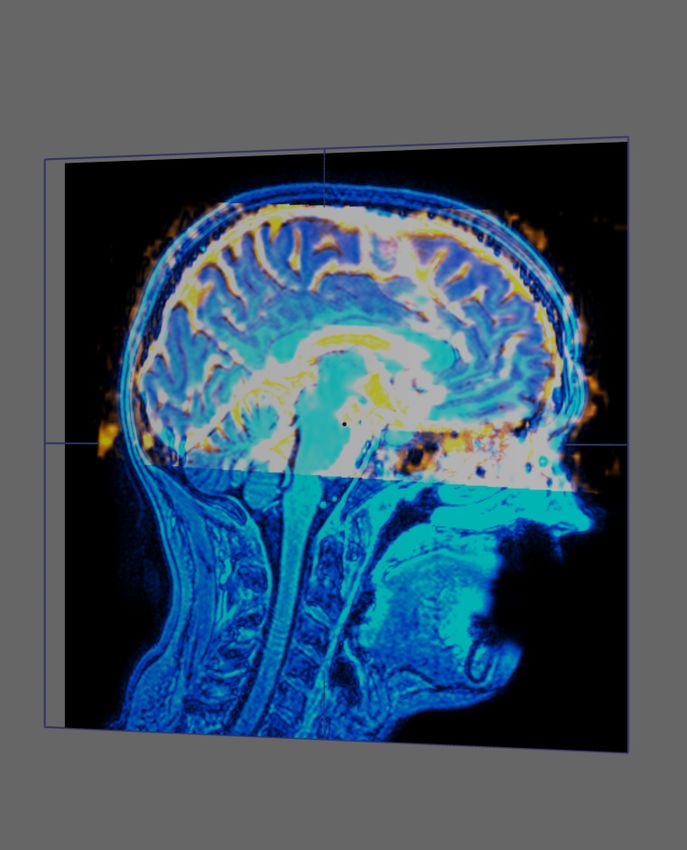
Figure 3. The segmented tumor displayed separately (left), and with a surface at a fixed distance from the tumor (right).

Figure 4. The activation areas, displayed using three different rendering modes. From left to right: Shell rendering, Polygon rendering
from marching cubes, Point based rendering. The colors correspond with the different tasks.

4.3. Point-Based Activation Area Rendering
The functional activation areas are commonly stored as volumes with statistical z-values. We have such a volume for each
task. A higher value generally means that the activation in that voxel is more likely to be part of that task. The activation
areas are extracted by thresholding these statistical values.
    As shown in Figure 4, we have a number of methods for rendering these areas. The first method is a simple shell
renderer, that uses blocks to mark all voxels that belong to a specific area. The shell renderer provides an unshaded surface
representation, which is sometimes preferred when complex coloring modes are used. The second method is the marching
cubes renderer that is also used to show the tumor surface. While its shaded surface provides a good impression of the
shape of the areas, it is sometimes hard to discern the surface when used in combination with other complex visualization
components. Also, the surface is often considered a bit too clean for the uncertain and noisy nature of functional MRI. To
solve these problems we have a third rendering mode, which uses a point based renderer to display the activation areas. The
point based renderer uses a large number small spheres that lie on the isosurface. This makes the areas easily perceptible,
while maintaining a sense of the uncertainty associated with functional MRI scans. For all of these rendering methods,
the DTII platform allows the user to interactively modify the threshold values as needed and get direct feedback on the
resulting changes.

4.4. Tractography display
After preprocesing the Diffusion Tensor Imaging data, we use fiber tracking to create a full brain white matter tractography
(as seen in Figure 5). The fiber tracts can be displayed with a large set of fully customizable color modes. The local tensor
shape can determine the color to indicate the anisotropy or direction of the diffusion. Optionally, the color can also be
determined using data from another scan, such as secondary fields like tumor-distance or activation maps. The colors can
either be calculated locally for each point on the fiber, or they can be automatically aggregated over each fiber, as to store
the maximum or minimum color along the fiber path. This tractography generally contains twenty to thirthy thousand fiber
tracts. To assist the exploration of this complex structure, we provide filters for selective visualization of the tracts.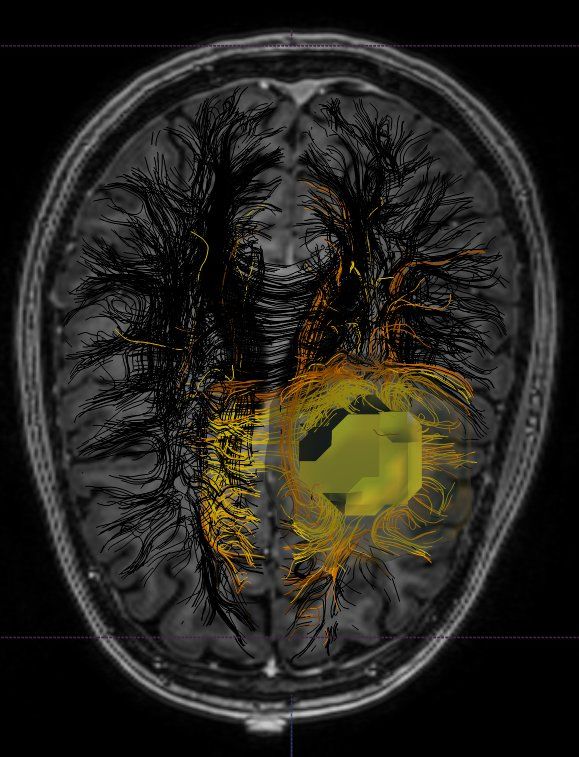
Figure 5. A full brain tractography consisting of seventeen thousand pathways, color coded by the local diffusion direction. A green
color means that the diffusion is the largest in the anterior-posterior direction, red in the left-right direction and blue in the up-down
direction.

Figure 6. A full brain tractography filtered by using three selection boxes. Only the fibers passing trough all of the boxes are selected
and therefore rendered opaque. The other fibers are rendered transparent, in a color that represents which boxes they pass through. Each
box has a unique color to make it easy to spot fibers that pass through any combination of boxes.

    We present two basic filtering modes, to help the user select the tracts he is interested in.

   1. Filtering by arbitrary convex selection objects. This first filtering mode is meant for interactive exploration of larger
      sets of fibers. We use an interactive filtering technique that provides the user with a set of movable boxes.4 All the
      boxes can be freely positioned, rotated and resized within the DTII user interface. The fibers are tested against each
      box for intersections. The most commonly used filter is to only display the tracts that pass through all of the boxes,
      as seen in Figure 6. However, the technique is expandable to any logical combination, so that extra boxes may be
      used in a negated fashion to prune away fibers from the selected set.

   2. Filtering by aggregation of arbitrary volume data over the fiber. Apart from the box filters described in the previous
      section, we also have filters that use the geometry of the fiber tracts to locally retrieve a scalar from a secondary
      volume. Much like the aggregated color over the fiber, the measured values are then combined over each tract, and
      the aggregated value is compared with a threshold to determine the visibility of the tract. This can for instance be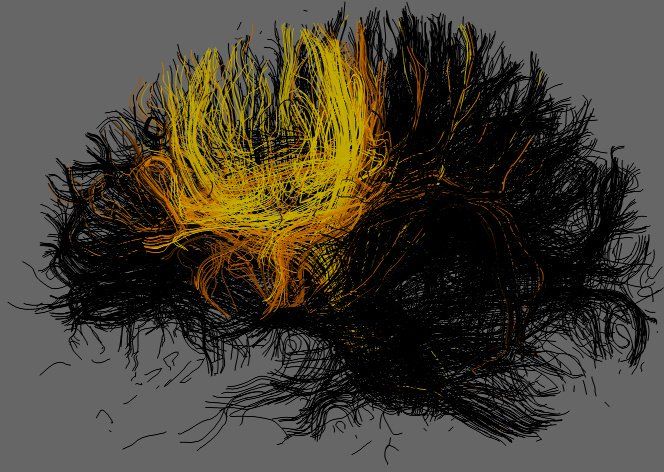
used to quickly remove all tracts where the minimum fractional anisotropy is below a specified value.

                             5. MULTI-DOMAIN VISUALIZATION FRAMEWORK
In this section, we present our conceptual framework and implementation for the visualization of and interaction with
structural MRI, fMRI and DTI datasets. The goal of the visualization is to assist interactive exploration of the information
contained within the datasets before a tumor resection procedure. During this exploration, the surgeon attempts to gather
information about the various interactions between tumor location, fMRI activation areas and fiber bundles in the white
matter of the brain.
                                                               Tumor Location

                                      Tumor and Activation                           Tracts and Tumor

                                                             Combined Visualization

                                         Activation Areas    Activation and Tracts      Tractography

Figure 7. The triangular space representing the possible combinations of the three data domains. The corners represent the tumor
location, the activation areas and the tractography.

   Combining all datasets in a useful manner and presenting them in a single interactive visualization poses quite a
challenge. Our framework helps in solving this problem.
    The framework is illustrated in Figure 7. The three vertices represent the information contained in each of the three
datasets involved in the exploration: The structural MRI is used primarily for locating the tumor, the fMRI for the activation
areas and DTI for the tractography. We have termed the information contained in the datasets and represented by the
vertices of the triangle, such as the fMRI activation areas, domains.
    Each of the three edges represents interaction between two different domains. For example, the edge on the right
represents interaction between the tumor location domain and the tractography domain. Increasing the tumor distance
threshold as explained in Section 4.2 will directly interact with the current fiber selection and a number of fibers will be
activated, deactivated or colored differently. For each edge, there are a number of different interaction possibilities.
    In the following sections, we will describe four visualization approaches. Each of the first three address one of the
edges of the triangle. The final approach combines the interactions represented by all three edges, and can thus be seen as
situated in the interior of the triangle.

5.1. Tumor and Activation
In the first approach, the interaction between tumor locations and fMRI activation areas is explored. The tumor distance
parameter can be adjusted, thus increasing the volume of the offset surface surrounding it. Activation areas that are
intersected by this volume are updated in real-time. This allows the surgeon to experiment with the safety zone surrounding
the tumor, and to explore the degrees of freedom that should be available during the resection procedure.
    The combined visualization of the activation areas and the tumor assists the highest level of pre-surgical planning. The
information presented allows the surgeon to pinpoint the location of the motor areas in the brain, and use this to estimate a
surgical path to the tumor that avoids these areas. Figure 8 shows an example of this visualization mode.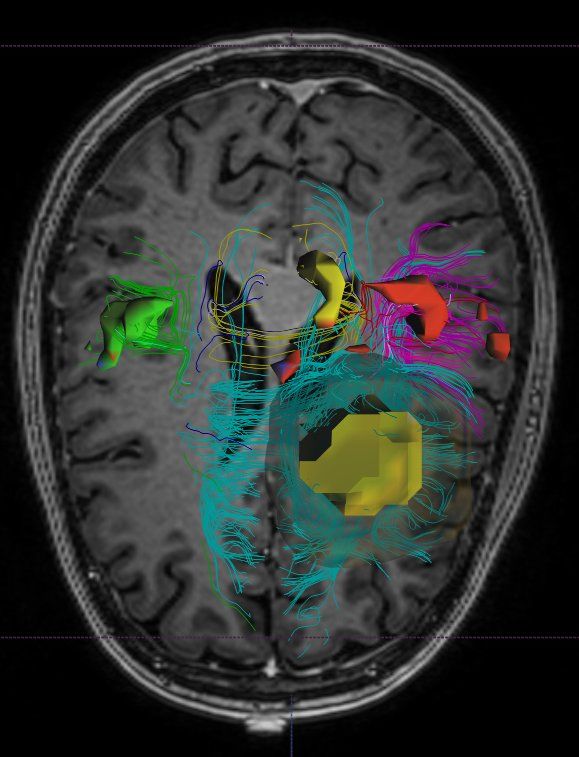
Figure 8. Tumor neighborhood and Activation areas

5.2. Tracts and Tumor
This visualization enables the operating clinician to explore the interaction between the DTI fiber tracts and segmented
tumor. As in all cases, an offset surface surrounding the tumor, representing a safety zone, can be adjusted by modifying a
distance threshold. Fibers that do not intersect with the tumor and its safety zone can be deactivated. With the functionality
described in Section 4.4, tumors that do intersect the safety zone can be colored in different ways:

   1. A single color can be assigned to each visualized fiber based on the shortest distance at which it passes the actual
      tumor. This visualizes, per fiber, how great the risk is to that fiber during a resection. Fibers that enter the interior
      of the tumor are all assigned the color representing zero distance. Recall that, due to the nature of current DTI
      techniques, each visualized fiber actually represents the likely path a whole bundle of real axonal fibers follow.

   2. Fibers that intersect the safety volume can be colored according to the distance of each point to the tumor. In other
      words, the color across a single fiber changes depending on the distance of that point of the fiber from the tumor.

     Figure 9 shows an example of the per-fiber coloring. In this case, the full tractography is shown, but fibers that do not
intersect the safety volume are not colored. They can also be completely deactivated, i.e. removed from the visualization.
Fibers that are more brightly colored pass closer to the tumor. Figure 10 shows two more examples for comparison: on the
left color across the fiber reflects the distance of that point from the tumor and on the right each fiber is colored according
to its shortest distance.
    Other filtering techniques described in Section 4.4 can be applied at the same time. For example, anatomical fiber
tracts can be filtered using selection objects, whilst the intersection of these tracts with the tumor safety volume and their
coloring are updated in real time.
    This visualization aids insight into how the tumor has deformed its surrounding tissue by allowing the user to visualize
interactively the full tractography in the tumor’s vicinity.

5.3. Activation and Tractography
The third edge of the triangle concerns the interaction between the fMRI activation and the tractography domains. This
mode shows the the explicit relationship between fiber bundles and fMRI activation areas.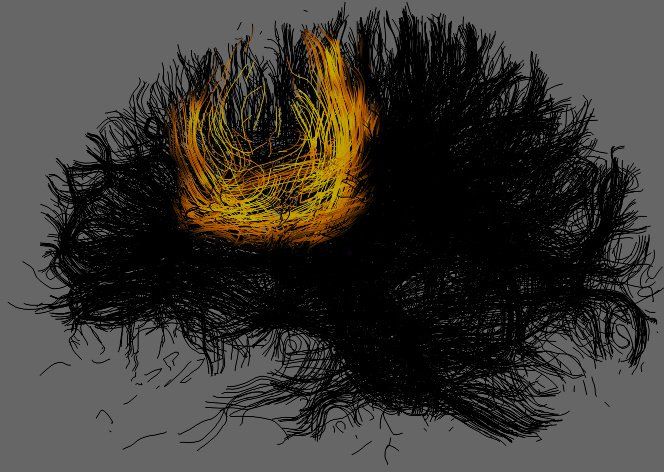
Figure 9. Tumor neighborhood and Tractography

Figure 10. The tractography, using the distance to the tumor for coloring. On the left local coloring is used, while on the right a single
color per fiber is determined by taking the minimum distance.

    As shown in Figure 11, each fMRI activation area is automatically colored with a distinct color and can be rendered
using several different rendering methods as explained in Section 4.3. Fibers that intersect with an activation area are
assigned the same color as that activation area. If fibers intersect more than one activation area, the colors of those areas
are blended and assigned to the fiber. The specific colors that have been chosen, along with spatial cues, make it a generally
straightforward task to judge through which activation areas a fiber has passed.

5.4. Combined Visualization
Combinations of the three visualization modes described above can be used during exploration of fused MRI, fMRI and
DTI datasets. For example, in Figure 12 the tumor and its safety zone are shown along with a number of fMRI activa-
tion areas. Fibers that pass through the tumor safety zone have been colored turquoise, whereas tumors passing through
activation areas but not through in the vicinity of the tumor have been colored the same as the activation areas.
    Throughout the exploration process, parameters can be changed and visualization modes can be modified. The visu-
alization remains completely interactive and supplies continuous feedback on all changes. This combined visualization
mode is situated in the interior of the multi-domain visualization triangle.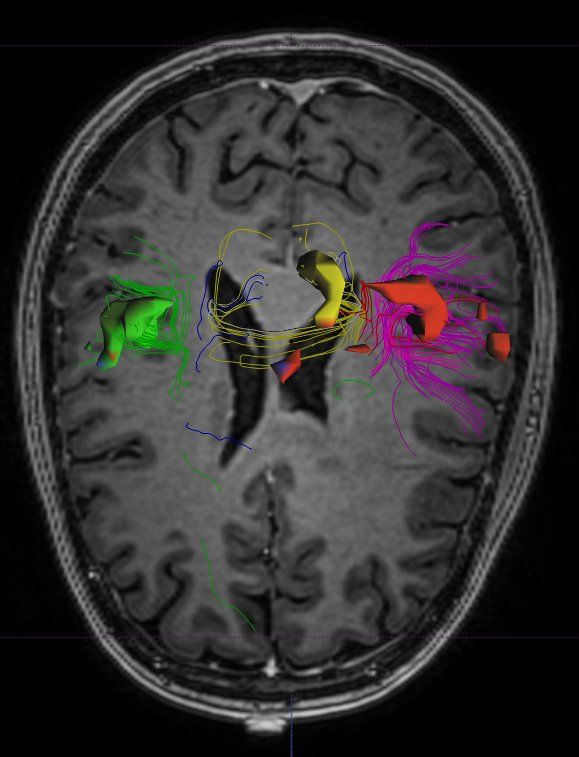
Figure 11. Activation areas and Tractography

                                                      6. DISCUSSION
The visualization options described in the previous section are all highly interactive, despite the size of the data. An es-
sential design strategy to achieve this is to combine pre-generation of all possible important information with fast selection
techniques. The pre-generated information includes the full-brain tractography, the segmented tumor and the activation
zones, while the fast selection techniques (similar to those described in4 ), filter this information to answer specific queries.
Another design aspect is the strong integration of the information by representing everything in a single data space, so the
relational queries (such as distances between fibers and tumor, and the fibers passing through functional activation zones)
can be easily answered.
    Experience has shown that visualization helps to explore the surgery zone and extract the most important information
such as the vital functions to be spared and the crucial connections from the zone immediately adjacent to the tumor.
Thus, the visualization tools can very well play a role that is supplementary to traditional surgical planning. The use of
this information has given surgeons high expectations, even if clinical experience is still very limited and little test data
is available. Although in this study real patient data has been used, we are still in a stage of exploring possibly useful
visualization tools. So far, the mainly qualitative results have gained great interest and support from the end users.
   However, quantitative information is also needed, for example for rigorous clinical testing, comparison between patient
populations, and temporal comparisons (such as pre- and post-operative information). In a further stage even more accurate
and reliable quantitative information is needed in calculating the risk and damage for a specific surgical approach. Another
use for accurate quantitative information is the generation of planning information for use in an intra-operative optical
guidance system (such as BrainLab).
    To be able to generate both qualitative and quantitative information, a number of medical and technical problems have
to be addressed:

   • Accurate and (semi-)automatic segmentation of the tumor
   • Modelling an access path for resection
   • Investigation of the accuracy of fiber tracking near certain tumors (where the anisotropy is much lower compared
     with healthy brain)
Figure 12. Tumor, Activation and filtered tractography
• Investigation of the effects of damage to neural fibers, and how this can be measured by DTI
• Development of good indicators for functional impairment
• Good registration of all modalities, for individual patients and patient groups for statistical analysis
• Real-time deformation to keep pre-operative images registered to intra-operative visualization
The ultimate test for this type of surgical planning system would be a comparison with strong indicators such as reduced
time for the operations, less revision surgery or recurrence of the tumor, less functional damage, and overall improved re-
sults of resections. For the time being, we can only develop tools that may eventually be integrated in such a comprehensive
surgical planning system.
7. CONCLUSIONS AND FUTURE WORK
In this paper we have presented an ordered toolset of visualization techniques for the interactive and simultaneous explo-
ration of anatomical MRI, fMRI and DTI datasets with the goal of providing information on the resection area around a
brain tumor. We have also presented a conceptual framework for this multi-domain visualization exercise.
Our toolset consists of a number of basic components that can be combined within the multi-domain visualization
framework to create effective and interactive visualizations of tractography, fMRI activation areas and tumor locations.
What differentiates our approach from other work in the field is the fact that it allows simultaneous visualization in all
three domains and, very importantly, makes possible rich interaction between these three domains. For example, where
other approaches require a tractography to be performed from a pre-selected region of interest before fusion with other
modalities, our approach fuses the full brain tractography with the other domains and allows the user to filter information
in the fully fused visualization.
We plan to continue our research into which visualization domain interactions are most applicable to and effective
for specific clinical questions. We also intend to use this flexible framework to gain direct feedback on the usability of
innovative multi-domain techniques in a clinical setting.Acknowledgements
DTII makes use of the teem toolkit, available at http://teem.sourceforge.net.
REFERENCES
1. “Primary brain tumors in the united states - statistical report 1998-2002,” Central Brain Tumor Registry of the United
States , p. 10, 2005-2006.
2. C.-F. Westin, S. Maier, B.Khidhir, P. Everett, F. A. Jolesz, and R. Kikinis, “Image processing for diffusion tensor
magnetic resonance imaging,” in Proceedings of Second Int. Conf. on Medical Image Computing and Computer-
assisted Interventions (MICCAI’99), pp. 441–452, 1999.
3. C.-F. Westin, S. E. Maier, H. Mamata, A. Nabavi, F. A. Jolesz, and R. Kikinis, “Processing and visualisation for
diffusion tensor MRI,” Medical Image Analysis 6, pp. 93–108, 2002.
4. J. Blaas, C. P. Botha, B. Peters, F. M. Vos, and F. H. Post, “Fast and reproducible fiber bundle selection in DTI
visualization,” in Proceedings of IEEE Visualization 2005, C. Silva, E. Gröller, and H. Rushmeier, eds., pp. 59–64,
October 2005.
5. M. Guye, G. Parker, M. Symms, P. Boulby, C. A. Wheeler-Kingshott, A. Salek-Haddadi, G. J. Barker, and J. S.
Duncan., “Combined functional mri and tractography to demonstrate the connectivity of the human primary motor
cortex in vivo.,” in NeuroImage, pp. 1349–1360, 2003.
6. T. Hendler, P. Pianka, M. Sigal, M. Kafri, D. Ben-Bashat, S. Constantinu, M. Grait, I. Fried, and Y. Assat, “"two are
better than one": Combining fmri and dti based fiber tracking for effective pre-surgical mapping,” in Proc. Intl. Soc.
Mag. Reson. Med, p. 394, 2003.
7. I. F. Talos, L. O’Donnell, C.-F. Westin, S. K. Warfield, W. M. Wells, S. S. Yoo, L. Panych, A. Golby, H. Mamata,
S. E. Maier, P. Ratiu, C. G. Guttmann, P. M. L. Black, F. A. Jolesz, and R. Kikinis, “Diffusion tensor and functional
MRI fusion with anatomical mri for image guided neurosurgery,” in Sixth International Conference on Medical Image
Computing and Computer-Assisted Intervention (MICCAI’03), pp. 407–415, (Montreal, Canada), November 2003.
8. S. Smith, M. Jenkinson, M. Woolrich, C. Beckmann, T. Behrens, H. Johansen-Berg, P. Bannister, M. D. Luca, I. Drob-
njak, D. Flitney, R. Niazy, J. Saunders, J. Vickers, Y. Zhang, N. D. Stefano, J. Brady, and P. Matthews, “Advances in
functional and structural mr image analysis and implementation as fsl.,” pp. 208–219, 2004.
9. D. Weinstein, G. Kindlmann, and E. Lundberg, “Tensorlines: Advection-Diffusion based Propagation through Diffu-
sion Tensor Fields,” in Visualization ’99, proceedings, pp. 249–530, 1999.You can also read