INTERIM RATE APPLICATION - 2021/22 November 15, 2021 - Tab 9 Page 0 of 52 November 30, 2018 - Manitoba Hydro
←
→
Page content transcription
If your browser does not render page correctly, please read the page content below
Tab 9
                                                             Page 0 of 52
                                                        November 30, 2018

         2021/22
INTERIM RATE APPLICATION

      November 15, 2021

        Available in accessible formats upon request.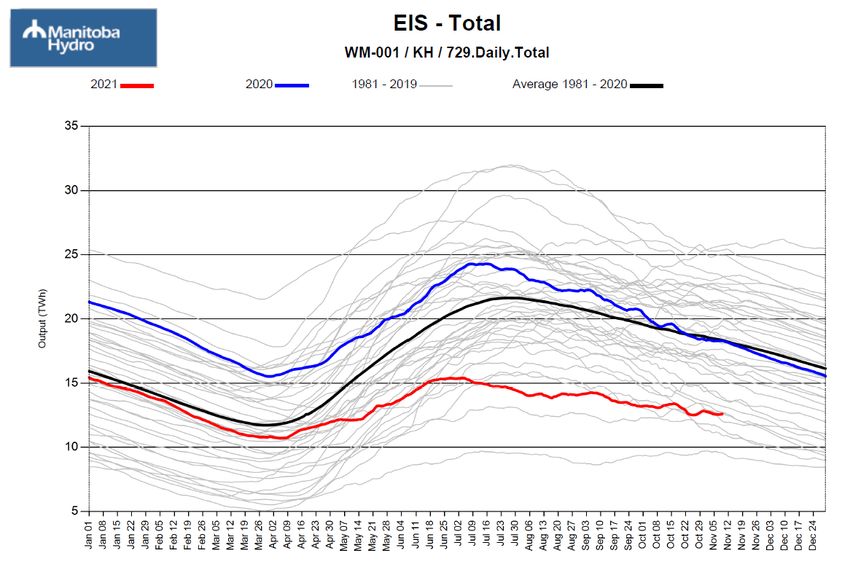
2021/22 Interim Rate Application
1                                                                      INDEX
2    1.0      APPLICATION SUMMARY ............................................................................................. 3
3             1.1       Approvals ......................................................................................................... 3
4             1.2       Background ...................................................................................................... 3
5             1.3       Reasons for the Application ............................................................................. 5
6    2.0      THE PROPOSED REVENUE INCREASE IS REQUIRED TO HELP MITIGATE THE FINANCIAL
7             IMPACT OF DROUGHT ................................................................................................. 8
8             2.1       Water Conditions and Energy Supply & Demand ............................................ 9
9             2.2       Energy Market Prices ..................................................................................... 13
10            2.3       Significant Financial Impact of the Drought on Net Extraprovincial Revenue 17
11            2.4       Uncertainty Analysis ...................................................................................... 18
12   3.0      MANITOBA HYDRO’S FINANCIAL METRICS AND NEED FOR RATE INCREASES TO
13            REMAIN SELF-SUPPORTING ....................................................................................... 22
14            3.1       Financial Metrics............................................................................................ 22
15            3.2       Consistent Annual Rate Increases are Required to Remain Self-Supporting.. 26
16   4.0      OVERVIEW OF THE 2021/22 FORECAST ..................................................................... 33
17            4.1       2021/22 Forecast Compared to 2021/22 Budget .......................................... 33
18            4.2       Placing Major Capital Projects In-Service results in a Substantial Increase in
19                      2021/22 Revenue Requirement..................................................................... 35
20            4.3       Major Capital Projects Deferral ..................................................................... 36
21            4.4       Keeyask In-Service Deferral ........................................................................... 37
22   5.0      COST ALLOCATION AND CUSTOMER BILL IMPACTS................................................... 39
23            5.1       Summary of PCOSS21 .................................................................................... 39
24            5.2       Manitoba Hydro Rate Change Proposal ......................................................... 40
25            5.3       Comparison of Rates to Canadian Jurisdictions ............................................. 45
26   6.0      MANITOBA HYDRO IS STRATEGICALLY ADAPTING TO THE EVOLVING ENERGY
27            LANDSCAPE WHICH WILL HELP INFORM FUTURE RATE APPLICATIONS .................... 47
28   7.0      CONCLUSION ............................................................................................................. 51
29
30   Appendices
31         1. Report on hydraulic generation, water conditions, and energy exchange data
32            (Directive 5 of Order 43/13)
33         2. Price Risk Mitigation Activities (filed in confidence with PUB only)
34         3. Historical Financial Metrics Back to 1992

     November 15, 2021                                                                                                    Page 1 of 51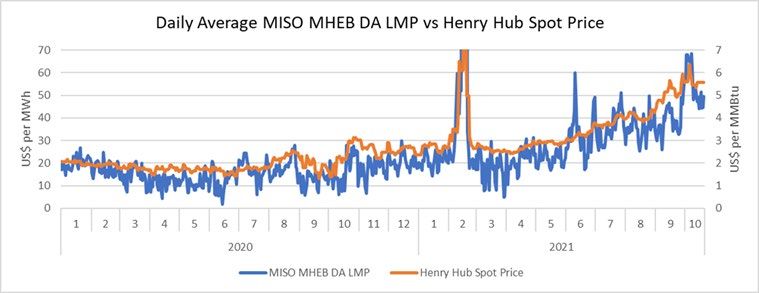
2021/22 Interim Rate Application
1      4. Jan 1/22 Proposed Rate Schedules
2      5. Minimum Filing Requirements

    November 15, 2021                                            Page 2 of 51
2021/22 Interim Rate Application
1 1.0 APPLICATION SUMMARY
2
3 1.1 Approvals
4 In this Application, Manitoba Hydro is requesting an Order of the Public Utilities Board
5 of Manitoba (“PUB”) pursuant to section 25 of The Crown Corporations Governance &
6 Accountability Act and section 47(2) of The Public Utilities Board Act, for the following:
7
8 1) Approval, on an interim basis, of rate schedules incorporating an overall increase
9 in General Consumers Revenue of 5.0% effective January 1, 2022; and,
10
11 2) Approval to begin recognizing the revenues from the Major Capital Deferral
12 established by the PUB in Order 69/19 commencing January 1, 2022, with the
13 balance to be amortized over 24 months.
14
15 1.2 Background
16 On August 17, 2021, the PUB issued Order 89/21, directing a Status Update process
17 for Manitoba Hydro to provide evidence to assist the PUB in its determination of
18 whether Manitoba Hydro’s rates are just and reasonable and costs are fairly allocated
19 among the various customer classes. On September 9, 2021, the PUB proposed
20 certain Minimum Filing Requirements for the Status Update Process for comment by
21 Manitoba Hydro.
22
23 On September 22, 2021, the Minister of Crown Services issued a ministerial directive
24 to the Manitoba Hydro-Electric Board (“MHEB”) providing specific instruction for
25 Manitoba Hydro to take all necessary steps to proceed with an Interim Rate
26 Application to the PUB for 2021/22, as well as directing Manitoba Hydro to engage
27 with the PUB on the timing and parameters of its next multi-year General Rate
28 Application.
29
30 As an initial and immediate procedural step to fulfill and comply with this directive,
31 on September 29, 2021, Manitoba Hydro advised the PUB that it intended to file an
32 interim rate application to address the significant financial impacts due to the current
33 drought conditions to ensure the financial health of the corporation. Manitoba Hydro
November 15, 2021 Page 3 of 512021/22 Interim Rate Application
1 advised that as part of its application it would provide responses to the PUB’s MFRs that
2 were issued as part of the Status Update review process to the greatest extent possible
3 with necessary modification, and requested the PUB discontinue the Status Update
4 process and replace it with an expedited public process to review Manitoba Hydro’s
5 interim rate application.
6
7 An Award of Interim Rate Relief Is Appropriate and Justified Given the Current
8 Circumstances of Manitoba Hydro
9
10 This Application for interim rates has been filed pursuant to section 26 of The Crown
11 Corporations Governance and Accountability Act, CCSM c. C336 and section 47(2) of
12 The Public Utilities Board Act, CCSM c. P280.
13
14 In an interim rate application, the applicant must establish a prima facie case for the
15 requested interim rates. While the overarching principle of awarding rates in the
16 general public interest applies, that is balancing the interests of the customers and
17 the financial health of the utility, interim rate applications are not subject to the same
18 rigor and standards of a final rate application. As the PUB has previously articulated,
19 interim rates are set without the benefit of a full evidentiary record and on a less
20 onerous legal standard 1 entirely consistent with the Supreme Court of Canada’s
21 fundamental principle that interim applications are “made in an expeditious manner
22 on the basis of evidence which would often be insufficient for the purposes of the
23 final decision.” 2
24
25 Furthermore, the PUB has ruled that an interim rate application is not the appropriate
26 forum to consider and rule upon contentious issues such as the financial performance
27 targets to be utilized by the PUB in rate-setting, debt management strategy,
28 forecasting and rate design. 3 Revenues and expenses are also not fully tested in an
29 interim rate application. 4
1
PUB Order 59/18 at page 18-19; Order 90/18 at page 41.
2
Bell Canada v Canada (Canadian Radio-Television and Telecommunications Commission), [1989] 1 SCR
1722.
3
Order 80/17 at pages 21-23; Order 40/11 at page 30.
4
Order 40/11 at page 41.
November 15, 2021 Page 4 of 512021/22 Interim Rate Application
1
2 Manitoba Hydro’s 2021/22 Forecast, which was approved by the Manitoba Hydro-
3 Electric Board on November 10, 2021, clearly establishes that the current drought
4 conditions have severely impacted Manitoba Hydro’s financial health with very
5 limited opportunity for additional water inflows to contribute to a recovery in the
6 remainder of fiscal 2021/22. These undisputable and uncontrollable deleterious
7 impacts to Manitoba Hydro’s financial health warrant the modest general revenue
8 increase requested in this Application given the current circumstances as detailed
9 herein.
10
11 To be responsive to the MFRs approved by the PUB on October 19, 2021 seeking
12 information relating to the 2022/23 fiscal year, Manitoba Hydro is also providing a
13 2022/23 Preliminary Plan to help inform the PUB’s review of this Application. This
14 Preliminary Plan has not yet been approved by the MHEB or provided to the Treasury
15 Board in accordance with the annual summary budgeting process. Manitoba Hydro is
16 not requesting approval of an increase for 2022/23 as part of this Application and as
17 a simplifying assumption has not assumed a rate increase in the 2022/23 Preliminary
18 Plan filed with this Application.
19
20 1.3 Reasons for the Application
21 Due to the effective merging of the process and the information requested as part of
22 the Status Update Proceeding with this Application, a significant amount of additional
23 evidence is being provided by Manitoba Hydro that exceeds what would normally be
24 required to support the need for immediate interim relief from the impacts of the
25 drought.
26
27 Drought risk is the risk of low water inflows and storage, as well as energy market
28 prices that can significantly impact Manitoba Hydro's financial position and
29 operations. Manitoba Hydro is committed to provide reliable energy service our
30 customers, and the corporation is engaged in planning, development and operation
31 of systems to mitigate the impact of the drought. As discussed in Section 2.1 of the
32 Application, Manitoba Hydro reduced outflows from Lake Winnipeg and Grand Rapids
33 to near minimum starting in July 2021 to ensure that firm demands could be met
34 assuming: drought conditions persisted for the remainder of the year, above normal
November 15, 2021 Page 5 of 512021/22 Interim Rate Application
1 winter loads in 2021/22, followed by severe drought and above normal winter loads
2 in 2022/23.
3
4 The drought conditions have resulted in a significant reduction in projected net
5 extraprovincial revenues of $398 million in fiscal 2021/22 compared to the 2021/22
6 Budget. This reduction is the primary driver behind a negative swing of $366 million
7 in projected results, from net income of $177 million in the 2021/22 Budget, to a net
8 loss of $190 million the in 2021/22 Forecast (which includes water conditions to
9 October 20, 2021). With the rain season ending, it is very unlikely that water
10 conditions will materially change during the remainder of the 2021/22 fiscal year.
11 Manitoba Hydro’s 2021/22 Forecast projects the requirement for higher energy
12 imports/purchases in order to serve demand, at a time when energy market prices
13 are rising. As discussed in Section 2.2, Manitoba Hydro has taken steps to mitigate
14 this price risk, but uncertainty related to energy market prices still remains.
15
16 In addition to the anticipated net loss of $190 million for the electric operations,
17 Manitoba Hydro is anticipating a cash shortfall in 2021/22 that will further weigh on
18 the financial health and self-sustainability of Manitoba Hydro. As shown in Figure 11
19 below and in response to PUB MFR 6, it is anticipated that Manitoba Hydro will have
20 to borrow $348 million to fund core operations in 2021/22. Core operations are
21 defined as all costs, both capital and operating, excluding major capital projects. The
22 interest costs on the borrowings to fund core operations in 2021/22, if not repaid in
23 future years, will amount to an estimated annual cost of $13 million per year 5 or
24 nearly equivalent to 0.8% of an electric rate increase. Manitoba Hydro’s balance
25 sheet is already highly leveraged and the corporation expects to spend 42% of all
26 revenues on interest costs in fiscal 2021/22. According to Moody’s, Manitoba Hydro’s
27 financial metrics are among the worst, if not the worst in the country when compared
28 to other peer crown utilities:
29 “Moody's adjusted EBITDA to interest expense ratio was 1.4x, EBIT to interest
30 expense was 0.8x and debt to book capitalization was 89%. These financial
5
Estimated annual interest cost on $348 million borrowed at the corporations projected cost of
borrowing
November 15, 2021 Page 6 of 512021/22 Interim Rate Application
1 metrics are among the weakest, if not the weakest, of any of Manitoba
2 Hydro's peers, including vertically integrated provincially owned crown
3 corporations in Canada.”
4 Manitoba Hydro has also compared the health of its balance sheet to that of
5 provincially owned crown corporations in Canada, as discussed in Section 3.1 of the
6 Application. Across Canada, utilities are trying to reduce debt and strengthen their
7 balance sheets in order to provide flexibility to respond to the changing energy
8 landscape, avoid stranding assets, and provide future investment necessary to
9 address aging infrastructure. Manitoba Hydro’s current debt to equity ratio is 86%.
10 All other peer Crowns have achieved targets below that or have plans to achieve
11 lower levels of debt within 10 years.
12
13 The drought is also occurring at a time when Manitoba Hydro is transitioning from
14 construction of the Major Capital Projects including Bipole III, the Keeyask Generating
15 Station (with five of seven units having been placed in-service), the Manitoba
16 Minnesota Transmission line (“MMTP”), the Great Northern Transmission Line
17 (“GNTL”) and the Birtle transmission line, to operating and maintenance of total
18 assets of $30.5 billion. Due to the capital intensive nature of its business, Manitoba
19 Hydro’s cost structure is largely fixed in nature and there is a significant impact to
20 Manitoba Hydro’s revenue requirement of $619 million in 2021/22 related to the
21 finance expense, depreciation, and capital taxes on the above named Major Capital
22 Projects, as discussed in Section 4.2 of the Application.
23
24 It is not possible to recover from a cash flow deficiency of $348 million in one fiscal
25 year or with one proposed increase that will take effect January 1, 2022. Should the
26 proposed interim rate increase be approved it is anticipated to generate $27 million
27 of incremental revenue in 2021/22 and $88 million in 2022/23. In light of this reality,
28 when considering the level of increase to request in this Application, Manitoba Hydro
29 considered the following:
30 • The need to limit further deterioration in Manitoba Hydro’s financial health.
31 Even with the proposed 5.0% revenue increase Manitoba Hydro is projecting
32 a net loss of $190 million in 2021/22, along with a deterioration in its debt
33 ratio to 87% in 2021/22 and 88% in 2022/23;
November 15, 2021 Page 7 of 512021/22 Interim Rate Application
1 • The need to preserve intergenerational equity, by recovering the carrying
2 costs on the additional borrowings required to fund core operating activities
3 in 2021/22, as these costs should not be deferred to be recovered from future
4 customers; and
5 • The need for rate stability and predictability for customers. Manitoba Hydro
6 has been projecting the need for annual rate increases of at least 3.5% since
7 2009.
8 With these considerations in mind, Manitoba Hydro submits that the proposed 5.0%
9 general revenue increase reasonably balances the financial needs of Manitoba Hydro
10 by addressing the very severe and immediate financial impacts of the drought, and
11 the impact on customers during the current pandemic and period of higher inflation.
12
13 2.0 THE PROPOSED REVENUE INCREASE IS REQUIRED TO HELP MITIGATE THE
14 FINANCIAL IMPACT OF DROUGHT
15
16 Drought has both an operational and financial impact on Manitoba Hydro. Manitoba
17 Hydro plans and operates its system knowing that droughts will occur at some time in
18 the future. The primary drought operating objective is to ensure energy supply will be
19 available to meet dependable load requirements, including domestic and dependable
20 export load. A secondary objective is to minimize price risk and cost for customers
21 during drought.
22
23 Manitoba Hydro plans its reservoir releases with the first priority being to ensure
24 energy reliability can be maintained, should drought conditions persist if it is already
25 dry, or if water supply conditions transition to drought in the future. The operations
26 planning process involves planning reservoir releases to optimize net extraprovincial
27 revenues considering current reservoir storage conditions and a range of possible
28 future inflows. This plan is tested to ensure that, if the economic reservoir release
29 plan is executed, and it turns dry or drought conditions worsen, that Manitoba Hydro
30 will still be able to meet its firm load commitments even under future severe drought
31 conditions and above average Manitoba load.
32
November 15, 2021 Page 8 of 512021/22 Interim Rate Application
1 From a financial risk perspective, drought risk is the risk of low water inflows and
2 storage as well as elevated energy market prices that impact Manitoba Hydro's net
3 extraprovincial revenues. Drought risk is therefore affected by both water conditions
4 and future energy market prices, both of which involve significant uncertainty and are
5 outside the corporation’s control.
6
7 2.1 Water Conditions and Energy Supply & Demand
8 Water conditions are an “imposed risk”, that is a risk originating from
9 uncontrollable and unavoidable external factors. It is not possible to accurately
10 predict when drought will occur or how long droughts will continue.
11
12 Water Conditions in 2021/22
13 Prior to the 2020/21 Budget, Manitoba Hydro used the historical record of 100+ years
14 of water flows for determining average extraprovincial revenues for budgeting
15 purposes. The 2021/22 Budget and 2022/23 Preliminary Plan now assume a shorter
16 record consisting of 40 years of more recent historic flows. The use of a shorter record
17 (i.e. 40 years vs. 100+ years) has improved the quality of the projections over prior
18 years, where budgets were based on the full long-term record of inflows that overall
19 were less connected with current or more recent basin conditions. While not
20 materially affecting the average of net extraprovincial revenues, as compared to using
21 the full long-term flow record, using a shorter, higher resolution data set for budget
22 purposes better reflects current hydrologic trends and upstream flow regulation
23 practices. Also, recent historic flow data has greater temporal and spatial resolution
24 as compared to older records. This enables the transition from current observed flows
25 to historic flows to be reflected in the budget, while still providing a range of potential
26 future flow conditions, including drought periods and high flow periods.
27
28 Until mid-summer 2020, the primary focus of Manitoba Hydro’s reservoir operations
29 was on managing high inflows at various locations across the system. By mid-August,
30 Lake Winnipeg water levels receded below the license flood reduction threshold level
31 of 715 feet, allowing Manitoba Hydro to reduce outflows and alleviate flooding
32 conditions on the Lower Nelson River. At the same time, Manitoba Hydro was able to
33 manage outflows for economics, meaning planning reservoir releases to optimize net
November 15, 2021 Page 9 of 512021/22 Interim Rate Application
1 extraprovincial revenues assuming a range of possible flow conditions that could
2 occur in the future.
3
4 Manitoba Hydro prepared its 2021/22 Budget based on storage conditions in
5 November 2020 assuming inflows would transition to a range of possible inflow
6 scenarios in 2021/22 made up of the recent 40 years of historic hydrology.
7
8 Winnipeg River basin precipitation has been well below normal since the fall of 2019.
9 Despite this overall system inflows were above average and storage levels were near
10 normal heading into winter 2020/21. Consistent with typical winter operations,
11 Manitoba Hydro increased Lake Winnipeg outflows to maximize Nelson River
12 generation in order to meet winter electrical demands.
13
14 Following a below average snowmelt runoff in the south and in anticipation of above
15 average snowmelt runoff in northern tributaries, in April 2021 Manitoba Hydro
16 reduced Lake Winnipeg outflows from near median to below lower quartile flows, for
17 that time of year. These Lake Winnipeg outflow reductions set the stage for reduced
18 summer opportunity exports and increased imports relative to 2021/22 Budget.
19
20 In May 2021, Manitoba Hydro projected that total hydraulic generation would be
21 below the 2021/22 Budget, assuming normal precipitation for the remainder of the
22 year. Still being early in the rain season and with basin storage and system inflows
23 above lower quartile, Manitoba Hydro continued to closely monitor the water
24 situation focusing its operations and energy planning on the assumption that inflows
25 could transition to any one of 40 potential future inflow scenarios for the remainder
26 of the fiscal year.
27
28 As dry conditions persisted and expanded across southern portions of the Nelson
29 River Basin through early summer 2021, Manitoba Hydro operations transitioned
30 from economic conservation, with reduced opportunity exports, to being governed
31 by energy reliability.
32
33 Manitoba Hydro implemented further Lake Winnipeg outflow reductions, to near
34 minimum by mid-July. Grand Rapids outflows were reduced to near minimum possible
November 15, 2021 Page 10 of 512021/22 Interim Rate Application
1 by the end of July 2021. These operations were necessary to ensure firm demands
2 could be met assuming drought conditions persisted for the remainder of the year,
3 above normal winter loads in winter 2021/22, followed by severe drought and above
4 normal winter loads in 2022/23. With these flow reductions, higher than budgeted
5 imports were required starting in July.
6
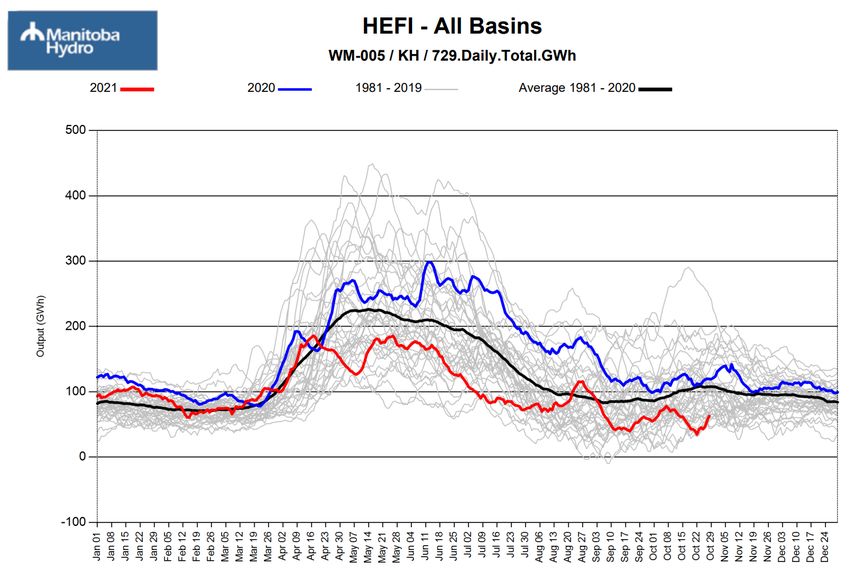
7 Figure 1 provides the total system accumulated precipitation from September 2020
8 to November 2021, with a comparison to actual precipitation for the period of
9 September 2002 to September 2003 during which the last drought occurred, as well
10 as normal accumulated precipitation. Figure 1 demonstrates that precipitation for
11 2020-2021 period has been well below normal, as well as being below levels
12 experienced during from the 2002-2003 drought.
13
14 Figure 1: Total System Inflows since September 1, 2020
15
16 Figure 2 provides the 2020 and 2021 hydraulic energy from inflows compared to
17 average, and Figure 3 provides energy in storage for the same period compared to
18 average. These figures demonstrate that hydraulic generation inflows and energy in
19 storage are well below average in 2021.
November 15, 2021 Page 11 of 512021/22 Interim Rate Application
1 Figure 2: Potential Hydraulic Energy from Inflows – All Basins
3 Figure 3: Total Potential Energy in Storage
4
5
6 Hydraulic generation in the 2021/22 Forecast is projected to be approximately 27%
7 below hydraulic generation assumed in the 2021/22 Budget, and total supply is
November 15, 2021 Page 12 of 512021/22 Interim Rate Application
1 projected to be approximately 14% below forecasted total supply in the 2021/22
2 Budget.
3
4 As a result of the decrease in hydraulic generation, estimated net imports have
5 increased by 4.4 TWh in the 2021/22 Forecast to 5.6 TWh (from 1.2 TWh in the
6 2021/22 Budget), shown in Figure 4 below.
7
8 Total demand is projected to be approximately 14% below forecast assumed in the
9 2021/22 Budget. This is primarily driven by lower than expected opportunity
10 extraprovincial revenue volumes of 4.3 TWh, as shown in Figure 4 below.
11
12 Figure 4: 2021/22 Budget compared to 2021/22 Forecast Total - Supply & Demand
13 (TWh)
15
16 In accordance with Directive 5 of Order 43/13, Manitoba Hydro is providing additional
17 information in Appendix 1 on hydraulic generation, water conditions and extra-
18 provincial energy exchange data, which will be updated on a monthly basis until the
19 PUB issues an Order with respect to this Application.
20
21 2.2 Energy Market Prices
22 Energy market prices are the other primary factor that influences the impact of
23 drought risk. The assessment of the financial impact of the drought is based on a
24 forecast of future energy market prices. Future energy market prices are based on a
25 forward price curve, which is a forecast of the expected price that energy will sell for
26 in the market at a point in time in the future which can be based on many variables,
27 including the value of current market trades/transactions and historical price trends.
November 15, 2021 Page 13 of 512021/22 Interim Rate Application
1 Forward price curve information used by Manitoba Hydro is sourced from multiple
2 external, subscription-based providers that provide daily forward strips of expected
3 monthly prices for both on and off peak. The expected forward energy prices
4 considering these forecasts is provided in Figure 5 below.
5
6 Figure 5: Expected Forward Energy Prices
Expected Forward Prices ($/MWH)
120
101
100 94
77 72
80 73
62 65 61
$CAD
60 58 52
40
20
-
November December January February March
On Peak Off Peak
7
8
9 Volatility of Energy Market Prices
10 Energy market prices have increased substantially over the last several months. Actual
11 MISO MHEB prices have increased by approximately 40% since August 2021.
12 Increased energy market prices are not a trend localized to the MISO market, as
13 increases in worldwide demand has put pressure on available supply.
14
15 Global demand for natural gas has impacted price and liquidity in energy markets. In
16 North America, two primary factors are driving natural gas prices higher, which is
17 impacting energy market prices:
18
19 1) Below average production and storage inventories across North America,
20 year-over-year, have put additional pressure on natural gas markets entering
21 the 2021/22 winter season; and
22
November 15, 2021 Page 14 of 512021/22 Interim Rate Application
1 2) Demand for liquified natural gas (“LNG”) in Asia is spurring additional LNG
2 exports out of the United States, putting additional supply and price pressures
3 on North American gas markets
4
5 As shown in Figure 6 below, actual MISO market prices and natural gas prices
6 (represented by the Henry Hub spot price) have both been increasing at a similar pace
7 in this rising energy price environment.
8
9 Figure 6: Daily Average MISO MHEB Energy Prices vs. Henry Hub Spot Gas Prices
10
11
12 Additionally, lingering effects of last winter’s February Arctic Event across the
13 Midwest and another colder than normal winter expected in 2021/22 in some parts
14 of the US, has made markets increasingly unpredictable with more companies looking
15 to purchase energy to mitigate potential price risk, thus impacting available supply
16 levels.
17
18 This uncertainty has translated into recent upward volatility in short term energy
19 markets. Forward market prices have increased over 50% since August, as shown in
20 Figure 7 below.
21
22
23
24
25
November 15, 2021 Page 15 of 512021/22 Interim Rate Application
1 Figure 7: Forward Market Prices Since August
Forward Curve Volatility ($/MWH)
120
101
100
77 94
86
80 73 79 72
61 66
$CAD
60 57 61 55
50
47
44
40
20
-
November December January February March
August Forecast September Forecast October Forecast
2
3
4 Hedging Activities (Price Risk Mitigation)
5 While water conditions are an imposed risk that Manitoba Hydro cannot mitigate,
6 price risk associated with drought can be mitigated to a certain extent. Based on the
7 amount of energy imports required to address the reduced hydraulic generation and
8 rising energy market prices due to high demand globally for energy and natural gas,
9 Manitoba Hydro implemented a hedging strategy to mitigate its price risk associated
10 with projected energy imports.
11
12 Hedging involves Manitoba Hydro entering into fixed price purchase arrangements to
13 reduce the price risk for its future projected import requirements. These fixed price
14 arrangements allow Manitoba Hydro to “hedge” against the risk of increased energy
15 market prices. Manitoba Hydro has substantially hedged its projected imports for the
16 November 2021 to March 2022 timeframe, as well as entered into arrangements for
17 fixed price firm delivered natural gas supply for energy generation purposes.
18 Appendix 2 provides additional information related to these activities/arrangements.
19 This information is commercially sensitive as public release of this information could
20 detrimentally impact Manitoba Hydro’s competitive position in future transactions
21 with commercial counterparties. As such, this information is being filed in confidence
22 with the Public Utilities Board only.
23
November 15, 2021 Page 16 of 512021/22 Interim Rate Application
1 2.3 Significant Financial Impact of the Drought on Net Extraprovincial Revenue
2 The financial impact to Manitoba Hydro of the drought is a substantive reduction in
3 the Corporation’s net extraprovincial revenue for 2021/22 compared to Budget. Net
4 extraprovincial revenue is made up of the following:
5
6 Net Extraprovincial Revenue = Export Revenue - Fuel and Power Purchased
7 (imports) - water rentals
8
9 The budgeted vs. forecasted amounts for these components of net extraprovincial
10 revenue are summarized in the following figures, which demonstrate 2021/22
11 forecasted net extraprovincial revenue is projected to be $398 million lower than
12 the 2021/22 Budget amount. This is primarily the result of a reduction in dependable
13 export sales ($46.3 million) and opportunity export sales ($121.7 million), an increase
14 in opportunity import purchases ($262.5 million), with a small offset in the level of
15 water rental fees ($32.1 million).
16
17 Figure 8: Net Extraprovincial Revenues 2021/22 Budget vs. Forecast (Summary)
19
20
November 15, 2021 Page 17 of 512021/22 Interim Rate Application
1 Figure 9: Net Extraprovincial Revenues 2021/22 Budget vs. 2021/22 Forecast
NET EXTRAPROVINCIAL REVENUES
($ millions)
2021/22 2021/22
Budget Forecast Difference
EXTRAPROVINCIAL REVENUES
Dependable Export 590 544 (46)
Opportunity Export 210 88 (122)
Transmission Credits 3 3 (0)
Other Export Revenue 2 2 (0)
Total Extraprovincial Revenue 806 637 (168)
FUEL & POWER PURCHASED
Dependable Purchases 73 73 1
Opportunity Import Purchases 9 272 262
Thermal Costs 6 6 (0)
GNTL Charges 39 39 (1)
Transmission Charges 37 38 1
Other Import Costs 0 (0) (0)
Total Fuel & Power Purchased 166 428 262
WATER RENTALS & ASSESSMENTS
Water Rentals 120 88 (32)
Assessments & Other 11 10 (0)
Total Water Rentals & Assessments 131 98 (32)
Net Extraprovincial Revenues 509 111 (398)
3
4 2.4 Uncertainty Analysis
5 In mid-October, water conditions came into clearer focus. Any winter precipitation
6 received has more of an impact on the next fiscal year as it will impact inflows from
7 snowmelt runoff. However, uncertainty around energy market prices remains.
8
9 2021/22 Hydraulic Uncertainty
10 As discussed above, water condition uncertainty is an inherent risk and variable that
11 Manitoba Hydro has to continuously monitor, assess and manage. As there remained
12 potential for late summer and fall precipitation and inflows to recover, financial
13 forecasting considered that flows could transition to any one of 40 potential inflow
14 scenarios by the end of the fiscal year based on historic transition statistics.
15
November 15, 2021 Page 18 of 512021/22 Interim Rate Application
1 By mid-September, it was apparent that a recovery to average or above average flows
2 was increasingly unlikely. Accordingly, the range of potential future flow scenarios
3 were narrowed to a subset of 10 of the 40 historic flow years.
4
5 By early October, due to continued dry conditions and unfavourable forward
6 precipitation forecasts, Manitoba Hydro further reduced the subset of plausible
7 future flow scenarios to four.
8
9 By late October, with very low potential for additional precipitation remaining, the
10 expected range of flows narrowed further for the remainder of the fiscal year
11 effectively leaving a single flow scenario to be utilized. With the precipitation season
12 ending and freeze up near, there is very limited variability remaining in future
13 hydraulic conditions for the remainder of this fiscal year.
14
15 The change from 40, to 10, to 4, to essentially one future flow scenario for the bulk of
16 the inflows to the Manitoba Hydro system resulted in a significantly narrowed range
17 of projected hydraulic generation for the remainder of 2021/22. With a narrow range
18 of possible inflows for the remainder of 2021/22, there is relatively less uncertainty
19 in total hydroelectric generation for fiscal 2021/22. As such, it follows that there is
20 less uncertainty in export and purchase volumes for the remainder of the year and
21 therefore it is very unlikely that water conditions will improve materially during the
22 2021/22 fiscal year.
23
24 Figure 10 shows the range of projected hydraulic generation as drought conditions
25 have worsened through summer and fall of 2021, demonstrating that as time
26 progressed, and drought conditions persisted that the range of potential water flow
27 scenarios continued to narrow.
28
29
November 15, 2021 Page 19 of 512021/22 Interim Rate Application
1 Figure 10: Evolution of Range of Projected Hydraulic Generation
2
3
4 Likelihood of Continued Drought
5 Precipitation forecasts beyond a few days into the future are not reliable; due to this
6 and other factors, it is not possible to accurately predict inflows with very long lead
7 times, particularly during the rainfall season. It is also not possible to identify when
8 drought will occur.
9
10 There exists some correlation of system inflows from one year to the next. In general,
11 the likelihood that a year with well above average inflows will be followed by year
12 with above average inflows is greater than the chance it would be followed by a year
13 of below average inflows. Conversely, there is a greater likelihood that a year with
14 well below average inflow will be followed by a year with below average inflow.
15
16 Given current drought conditions, there is an elevated likelihood of below average
17 inflows occurring in 2022/23. However, annual hydraulic generation is very
November 15, 2021 Page 20 of 512021/22 Interim Rate Application
1 dependent on spring and summer rainfall. Given the long lead time through to the
2 end of 2022/23, Manitoba Hydro is not able to quantify the increase in likelihood of
3 drought occurring next year.
4
5 Manitoba Hydro therefore assumes that the historical water flow record is indicative
6 of the possible flows in 2022/23, for financial forecasting purposes.
7
8 The 2022/23 Preliminary Plan is prepared based on the opening storage conditions
9 projected for April 1, 2022, which are determined based on a narrow range of flow
10 conditions for the remainder of 2021/22, and assumes there is an equal probability of
11 transitioning to any one of 40 historic inflow years in 2022/23. Net extraprovincial
12 revenues are simulated for each inflow case, and the average of these net
13 extraprovincial revenue results is used in the 2022/23 Preliminary Plan.
14
15 Although Manitoba Hydro assumes there is an equal probability of transitioning to
16 any one of 40 historic flow years in 2022/23 for financial forecasting purposes, for
17 energy reliability planning purposes, Manitoba Hydro will continue to manage energy
18 resources to protect for possibility of severe drought occurring next year.
19
20 Market Price Uncertainty
21 While uncertainty related to water conditions narrowed significantly by late October,
22 there continues to be significant uncertainty associated with energy market prices.
23 Future energy market prices could be higher or lower than current forward price
24 curves suggest. Manitoba Hydro’s hedging activity has mitigated some of the risk
25 associated with this price uncertainty, but some exposure remains. Manitoba Hydro
26 could experience additional costs or further impact to 2021/22 net extraprovincial
27 revenue under both increasing or decreasing market price scenarios.
28
29 To assess this potential impact associated with price uncertainty, Manitoba Hydro has
30 analyzed net extraprovincial revenue based on several energy market price scenarios.
31 These price scenarios are built from the existing forward price curve (as shown in
32 Figure 5 above), which acts as the “base case” scenario. Low, high and extreme price
33 scenarios have been considered and represent alternative views of the actual energy
34 market prices that could be experienced when imports are required.
November 15, 2021 Page 21 of 512021/22 Interim Rate Application
1 The development of these price scenarios and the potential impact of these scenarios
2 on net extraprovincial revenue are commercially sensitive, as public release of this
3 information could detrimentally impact Manitoba Hydro’s competitive position in
4 future hedging transactions with commercial counterparties. As such, this information
5 is being filed in confidence with the Public Utilities Board only.
6
7 There is the potential for Manitoba Hydro to further mitigate the price risk associated
8 with the high price and extreme price scenarios through entering into further fixed
9 price hedge arrangements, if market opportunities present themselves. However, as
10 further hedges are executed it reduces the opportunity to benefit (improved net
11 extraprovincial revenue) from any reduction in actual market prices (i.e. movement in
12 prices from the base case towards the Low-Price scenario). While these
13 considerations need to be balanced, energy market prices continue to trend upwards
14 and as such Manitoba Hydro intends to pursue further hedging opportunities, where
15 appropriate, to mitigate the risk of higher prices.
16
17 3.0 MANITOBA HYDRO’S FINANCIAL METRICS AND NEED FOR RATE INCREASES TO
18 REMAIN SELF-SUPPORTING
19
20 3.1 Financial Metrics
21 Although no longer on the legislative agenda, Manitoba Hydro supports the debt ratio
22 targets that were outlined in the previously proposed legislation, which are
23 summarized below.
24 • 87% by March 31, 2025
25 • 84% by March 31, 2030
26 • 78% by March 31, 2035
27 • 70% by March 31, 2040
28
29 The combination of debt ratio targets and achievement dates establishes a general
30 and reasonable roadmap to gradually reduce the utility’s leverage over a 20-year
31 period. Manitoba Hydro’s net debt is expected to exceed $24 billion following the
32 completion of the major capital projects. The focus for the next decade will be on
November 15, 2021 Page 22 of 512021/22 Interim Rate Application
1 minimizing further debt growth and increasing earnings to reduce the debt ratio by
2 3% and achieve the 84% target by March 31, 2030.
3
4 As part of the enterprise planning process, Manitoba Hydro will be further reviewing
5 its key performance indicators including its financial metrics. While establishing
6 appropriate debt ratio targets and achievement dates are important for the continued
7 financial health of any utility such as Manitoba Hydro, the granting of the interim rate
8 relief requested in this Interim Application need not consider or debate these
9 important and contentious issues at this time as part of this process. Rather, the
10 financial metrics, debt ratio targets and achievement dates provided in this Interim
11 Application are intended to provide a full financial “status update” to the PUB while
12 clearly demonstrating that the proposed interim general revenue increase and
13 resulting rates are just and reasonable and required immediately to address the very
14 significant financial impact of the current drought conditions.
15
16 The following is a list of financial metrics Manitoba Hydro is tracking and considering
17 as part of its key performance indicator review. Detailed calculations of each metric
18 can be found in the response to PUB MFR 6.
19 i. Debt Ratio: the portion of assets that are financed by debt rather than equity.
20 ii. EBITDA Interest Coverage Ratio: the number of times earnings before
21 interest, taxes, depreciation and interest can cover interest payments on the
22 outstanding debt.
23 iii. Cash Surplus/(Deficiency) for Core Business Activities: a deficiency indicates
24 borrowings are required to fund business activities other than the major
25 capital projects.
26 iv. Interest Paid as a Percentage of Total Revenue: the portion of every dollar of
27 revenue that is needed to service the interest payments on the outstanding
28 debt.
29
30 Figure 11 below compares these metrics for the 2021/22 Forecast and the 2021/22
31 Budget. Manitoba Hydro does not presently have targets for these metrics. The
32 current metrics are provided to demonstrate the significant impact the current
33 drought conditions have had on Manitoba Hydro’s projected results in 2021/22, and
November 15, 2021 Page 23 of 512021/22 Interim Rate Application
1 to provide a picture of Manitoba Hydro’s financial health compared to other
2 provincially owned electric utilities.
3
4 Figure 11: Financial Metrics 2021/22 Forecast Compared to the 2021/22 Budget
2021/22 2021/22
Electric Segment Forecast Budget Change
Proposed Rate Increase 5.0% 3.5% 1.5%
Net Income/(Loss) ($190) $177 ($366)
Net Export Revenue $111 $509 ($398)
Cash Surplus/(Deficiency) to Fund Core Business
($348) $62 ($410)
Operations
EBITDA Interest Coverage Ratio 1.36 1.68 (0.32)
Interest Paid as a % of Total Revenue 42% 40% 2%
Debt Ratio 87% 86% 1%
5
6 The 2021/22 Budget which assumed a range of possible water flow conditions for the year
7 and a 3.5% rate increase effective October 1, 2021, projected net extraprovincial revenue
8 of $509 million. The 2021/22 Budget projected sufficient earnings and cash flow to avoid
9 borrowing to fund core business activities, an EBITDA interest coverage ratio just under
10 1.7, maintained the debt ratio at 86% and prevented interest paid as a percentage of total
11 revenue from exceeding 40%.
12
13 The 2021/22 Forecast, which incorporates actual water conditions to October 20, 2021
14 and assumes a 5.0% rate increase effective January 1, 2022, projects net extraprovincial
15 revenue of $111 million, a ($190) million net loss, and $348 million of additional
16 borrowings to fund core business activities. This is resulting in a 1% deterioration of the
17 debt ratio to 87%, an EBITDA interest coverage ratio of 1.36 (from 1.68) and interest paid
18 as a percentage of total revenue increases to 42% (from 40%).
19
20 Even with a 5% rate increase, Manitoba Hydro must borrow approximately 90% of the
21 projected $398 million in lost extraprovincial revenue/increased fuel and power
22 purchases resulting from the current drought.
23
24 As shown in PUB MFR 6, Manitoba Hydro is projecting a small surplus of cash flow to fund
25 core business operations in the 2022/23 Preliminary Plan of $51 million, assuming the
26 return to average water flows as discussed in Section 2.4 of the Application. Without the
November 15, 2021 Page 24 of 512021/22 Interim Rate Application
1 proposed general revenue increase of 5% in 2021/22, which is expected to generate $88
2 million in revenues in 2022/23, Manitoba Hydro would again expect to borrow to fund
3 core business operations next fiscal year. Manitoba Hydro notes that $51 million in
4 surplus cash flow is small considering the size of Manitoba Hydro’s operations and the
5 uncertainties facing the corporation, including the risk of low water.
6
7 Manitoba Hydro continues to possess the highest debt ratio amongst other Crown-owned
8 Canadian electricity utilities as illustrated in Figure 12 below.
9
10 Figure 12: Debt Ratio Amongst Crown-owned Canadian Utilities
Manitoba BC Hydro SaskPower Quebec Nalcor
Hydro Hydro
Fiscal year ending Mar 31/21 Mar 31/21 Mar 31/21 Dec 31/20 Dec 31/20
Debt Ratio 86% 80% 71% 69% 63%
Percentage points N/A -6% -15% -17% -23%
lower/better than Manitoba
Hydro
11
12 A higher debt ratio means a larger proportion of the utility’s assets are funded with debt
13 versus equity and typically a higher proportion of revenues are used to service the cost of
14 carrying the debt. Figure 13 below compares each utility’s interest paid as a percentage
15 of its total revenues.
16
17 Figure 13: Interest Paid as a Percentage of Total Revenues Amongst Crown-owned
Manitoba BC Hydro SaskPower Quebec Nalcor
Hydro Hydro
Fiscal year ending Mar 31/21 Mar 31/21 Mar 31/21 Dec 31/20 Dec 31/20
Interest Paid as a % of Total 41%* 14% 16% 28% 42%**
Revenue
* Manitoba Hydro’s total revenues are adjusted for the cost of gas that is a pure pass through and is not available for debt service.
** Nalcor has received equity injections from the Province of Newfoundland. Despite the high equity component in their capital structure,
Nalcor has very weak financial metrics and poses a great risk to the Province of Newfoundland which is recognized by credit rating agencies.
18
19 Over 40% of Manitoba Hydro’s revenues are used to pay interest on borrowings
20 compared to only 14%, 16% and 28% for BC Hydro, SaskPower and Quebec Hydro
21 respectively. Having such a high ratio of gross interest to total revenues limits
22 Manitoba Hydro’s financial flexibility through its ability to absorb higher operating
November 15, 2021 Page 25 of 512021/22 Interim Rate Application
1 costs or deal with operational risks, for example, lower than normal water flow
2 conditions and major weather events.
3 3.2 Consistent Annual Rate Increases are Required to Remain Self-Supporting
4 Manitoba Hydro requires rate increases to remain self-supporting. Absent rate
5 increases, Manitoba Hydro may not generate sufficient funds to cover operations. To
6 clarify, the attributes of a self-supporting government-owned entity (as identified by
7 credit rating agencies) are:
8 • it has the ability to generate sufficient funds to support its own operations
9 including servicing its debt; and
10 • it does not require support from government to avoid financial distress.
11
12 Manitoba Hydro’s financial metrics are among the worst of its peer utilities in
13 Canada. DBRS rating agency publishes rating reports for Manitoba Hydro and most of
14 its peer crown utilities. DBRS highlights three key ratios for each utility: Debt in Capital
15 Structure, EBIT (Earnings Before Interest and Tax) Interest Coverage, and Cash Flow
16 to Debt. Each metric references a different financial statement (balance sheet, income
17 statement and cash flow statement respectively) which provides for a good overall
18 picture of the utility’s financial health. Credit rating agencies do monitor both the EBIT
19 and EBITDA Interest Coverage ratios; however, DBRS in these referenced utility
20 reports has chosen to highlight the EBIT interest coverage ratio.
21
22 The cash flow to debt ratio evaluates how much available cash from operations a
23 business has relative to its outstanding debt. DBRS, other credit agencies and
24 investors use this ratio to understand how much cash a business has available to make
25 interest and principal payments on debt. The higher the ratio is, the better position
26 the company is in to meet its financial obligations. If the ratio begins to decrease, that
27 means cash flows are slowing down, the company has taken on more debt, or both. A
28 declining or very low ratio means the business may not have enough available cash to
29 make its principal and interest payments on outstanding debt. Manitoba Hydro has
30 relatively high levels of debt compared to its peer utilities and has limited cash flow
31 with which to service this growing debt load, as shown in Figure 14 below.
32
33
34
November 15, 2021 Page 26 of 512021/22 Interim Rate Application
1 Figure 14: Utility Comparison of DBRS Cash Flow to Debt Ratio
DBRS Cash Flow/ Debt
14
12
10
Percentage
8
6
4
2
0
2005 2006 2007 2008 2009 2010 2011 2012 2013 2014 2015 2016 2017 2018 2019 2020
Year
Manitoba Hydro BC Hydro Sask Power
Hydro Quebec Peer Average
2
3
4 Based on DBRS’ calculations, Manitoba Hydro’s low cash flow/debt ratio means that
5 the utility is at a greater risk of not making its interest payments and principal debt
6 repayments and is on a comparably weaker financial footing than its peers.
7
8 The credit rating agencies have noted that Manitoba Hydro’s financial situation has
9 deteriorated in recent years as evidenced by Figure 14 above. Moody’s noted: “…rate
10 increases have not been keeping up with costs as evidenced by ongoing weak financial
11 metrics.” in its latest report on the MHEB from May 4, 2021. In 2008, Manitoba Hydro
12 had a cash flow/ debt ratio similar to its peers; however and predictably, years of
13 borrowing for its capital program have greatly pressured the utility’s financial health
14 to the point that Manitoba Hydro has little financial flexibility to sustain operations in
15 the wake of unanticipated events and must borrow for any requirement arising out of
16 such events. This is evidenced in Figure 11: Financial Metrics 2021/22 Forecast
17 Compared to the 2021/22 Budget which shows Manitoba Hydro does not have
18 sufficient cash flow to support its own operations, and must borrow approximately
19 90% of the projected $400 million reduction in net extraprovincial revenue resulting
20 from the current drought.
November 15, 2021 Page 27 of 512021/22 Interim Rate Application
1
2 Moody’s has warned of this risk in its latest report on Manitoba Hydro:
3
4 As part of its debt management strategy, Manitoba Hydro targets certain
5 financial metrics such as an interest coverage ratio greater than 1.8x and
6 equity-to-capitalization greater than 25%. However, both targets are not
7 expected to be met for an extended period of time due to its large capital
8 program and limited rate increases. For example, during the last twelve month
9 ending 31 December 2020, Moody's adjusted EBITDA to interest expense ratio
10 was 1.4x, EBIT to interest expense was 0.8x and debt to book capitalization
11 was 89%. These financial metrics are among the weakest, if not the weakest,
12 of any of Manitoba Hydro's peers, including vertically integrated provincially
13 owned crown corporations in Canada.
14
15 The willingness to operate outside of set targets is a material credit negative
16 because it restricts financial flexibility and adds risk in case of unexpected
17 events. – May 4, 2021 Moody’s Report on the MHEB (PUB MFR 14 –
18 Attachment 1)
19
20 As a Crown Corporation, Manitoba Hydro’s credit ratings are a flow-through of the
21 Province’s credit ratings. Manitoba Hydro’s financial strength is an important factor
22 for credit rating agencies and investors in assessing the Province’s credit standing. The
23 weak financial metrics have rating agencies concerned that Manitoba Hydro will need
24 to borrow and increase its debt further to fund operations. If this proves to be the
25 case, credit rating agencies may no longer view the utility as being self-supporting
26 which could cause problems for both the Province of Manitoba and Manitoba Hydro.
27
28 While credit-rating agencies still deem Manitoba Hydro to be self-supporting, this
29 determination is not based on a ‘snap shot in time’ picture, particularly in the case of
30 a crown corporation which is guaranteed by a government entity. The rating agencies
31 will look at the historical performance and expected future trends of financial metrics
32 as well as business risks of the enterprise in order to assess the status of the debt.
33 Currently, Moody’s has noted that despite the fact the EBIT to interest expense ratio
34 is below 1x, (currently 0.8x according to Moody’s methodology), which indicates that
November 15, 2021 Page 28 of 512021/22 Interim Rate Application
1 Manitoba Hydro is borrowing to make interest payments, it still considers Manitoba
2 Hydro to be self-supporting. However, should this negative trend continue without
3 being alleviated by the implementation of regular annual rate increases by Manitoba
4 Hydro, as well as by additional export revenues following the in-service of Keeyask,
5 Moody’s may reassess the self-supporting status.
6
7 As shown in the Figure 15 below, using DBRS’ methodology for calculating EBIT
8 interest coverage, Manitoba Hydro lags its peers in terms of financial health with DBRS
9 indicating: “Financial performance has also been weak, with earnings and cash flows
10 negatively affected by growing interest expense.” – DBRS Report on Manitoba Hydro,
11 December 9, 2020 (PUB MFR 14 – Attachment 4)
12
13 Figure 15: Utility Comparison of DBRS EBIT Interest Coverage
DBRS EBIT Interest Coverage
2.2
2
1.8
1.6 Manitoba Hydro
Times
1.4 BC Hydro
1.2 Sask Power
Hydro Quebec
1
0.8
2016 2017 2018 2019 2020
Year
14
15
16 Historically, Manitoba Hydro has experienced an increase in its debt ratio during the
17 construction of new generation and transmission projects. Upon in-service, the assets
18 become revenue generating and the debt ratio eventually recovers and reaches the
19 financial target. For example, the debt ratio decreased to the 75% target in 2007/08
20 following the construction of Limestone and would have achieved the target in
21 2002/03 were it not for a significant drought beginning in that year. This recovery
22 period for the debt ratio was approximately 10-15 years following the in-service of
23 Limestone. As noted in the PUB’s Needs For and Alternatives To (“NFAT”) Report, it
November 15, 2021 Page 29 of 512021/22 Interim Rate Application
1 was anticipated that a similar recovery period would be required after the
2 construction of Keeyask with regular annual rate increases in the range of
3 approximately 4% per year.
4
5 Credit rating agencies understand that the financial metrics will weaken during
6 construction of new generation and transmission. However, there is an expectation
7 that Manitoba Hydro’s financial metrics will recover and steadily improve with the in-
8 service of the Keeyask “DBRS Morningstar does not expect financial performance to
9 meaningfully improve until the Keeyask Project is fully in service and generating
10 export revenues.” – DBRS Report on Manitoba Hydro, December 9, 2020
11
12 Credit rating agencies also fully expect that the regular rate increases discussed at the
13 NFAT will materialize to support the recovery of Manitoba Hydro’s financial health.
14 Moody’s identified in their report on the Province of Manitoba from June 22, 2021
15 that “A rise in the indebtedness of Manitoba Hydro materially above forecasted
16 levels” was a factor that could lead to a downgrade. The forecast to which Moody’s
17 was referring was a scenario that Manitoba Hydro shared with all the rating agencies
18 which assumed and projected regular rate increases of 3.5% annually to 2030. In this
19 particular scenario, debt repayment did not begin until several years after the in-
20 service of Keeyask even with regular rate increases of 3.5%. In other words, absent
21 regular rate increases, debt will continue to grow, and Manitoba Hydro continues to
22 risk losing its self-supporting status and triggering a downgrade to the Province’s
23 credit rating.
24
25 DBRS Morningstar continues to view Manitoba Hydro as self-supporting, as its
26 earnings and cash flows remain sufficient to cover its operating expenses and
27 service its outstanding debt. However, DBRS Morningstar could consider
28 reclassifying a portion of the Utility’s debt to be tax-supported should the
29 financial health of the Utility deteriorate to the point where its expenses
30 cannot be recovered through rates or export revenues. This could potentially
31 arise if rate increases are insufficient to recover Manitoba Hydro’s costs or if
32 export revenues are weaker than forecast. If this were to occur, it could
33 potentially put downward pressure on the Province’s credit rating. Similarly,
34 a large equity injection by the Province that materially increases tax-supported
November 15, 2021 Page 30 of 512021/22 Interim Rate Application
1 debt could also put downward pressure on the Province’s credit profile. – DBRS
2 Report on Manitoba Hydro, December 9, 2020 (PUB MFR 14 – Attachment 4)
3
4 The trend for Manitoba Hydro’s debt in capital structure, as compared to its peers (as
5 calculated by DBRS 6 ) is shown in Figure 16 below.
6
7 Figure 16: Utility Comparison DBRS Debt in Capital Structure Ratio
DBRS Debt in Capital Structure
90
85
80
Percentage
Manitoba Hydro
75
BC Hydro
70
Sask Power
65 Hydro Quebec
60
2016 2017 2018 2019 2020
Year
8
9 The credit rating agencies viewed the financial targets within Bill 35 as being
10 favourable for Manitoba Hydro’s financial health with DBRS indicating:
11 the PUB would have to take into consideration debt-to-capitalization targets
12 in Bill 35 as part of its rate-setting process. DBRS Morningstar believes this
13 change is ultimately positive for Manitoba Hydro's financial health as its key
14 financial ratios have been weak during this period of elevated capex for the
15 Keeyask Infrastructure and Generating Station Project (the Keeyask Project;
16 total capex of $8.7 billion). Leverage for the Utility has increased to more than
6
All financial data for peer utilities taken from DBRS reports on peers:
• British Columbia Hydro and Power Authority May 27, 2020 p. 2 please note, information for 2020 includes actual results for
the 12 months to December 31, 2019. Fiscal year is March 31.
• Hydro Quebec December 9, 2020 p. 2 please note, information for 2020 includes actual results for the 12 months to
September 30, 2020. Fiscal year is December 31.
• Sask Power December 30, 2019 p. 1 please note, information for 2020 includes actual results for the 12 months to June 30,
2019. Fiscal year is March 31.
November 15, 2021 Page 31 of 51You can also read