Degradation Products of Tryptophan in Cell Culture Media: Contribution to Color and Toxicity
←
→
Page content transcription
If your browser does not render page correctly, please read the page content below
International Journal of
               Molecular Sciences

Article
Degradation Products of Tryptophan in Cell Culture Media:
Contribution to Color and Toxicity
Alisa Schnellbaecher, Anton Lindig, Maxime Le Mignon, Tim Hofmann, Brit Pardon, Stephanie Bellmaine *
and Aline Zimmer

                                           Upstream R&D, Merck KGaA, Frankfurter Strasse 250, 64293 Darmstadt, Germany;
                                           alisa.schnellbaecher@merckgroup.com (A.S.); anton.lindig@tu-dortmund.de (A.L.);
                                           maxime.le-mignon@merckgroup.com (M.L.M.); tim.hofmann@merckgroup.com (T.H.);
                                           brit.pardon@merckgroup.com (B.P.); aline.zimmer@merckgroup.com (A.Z.)
                                           * Correspondence: stephanie.bellmaine@merckgroup.com

                                           Abstract: Biomanufacturing processes may be optimized by storing cell culture media at room
                                           temperature, but this is currently limited by their instability and change in color upon long-term
                                           storage. This study demonstrates that one of the critical contributing factors toward media browning
                                           is tryptophan. LC-MS technology was utilized to identify tryptophan degradation products, which
                                           are likely formed primarily from oxidation reactions. Several of the identified compounds were
                                           shown to contribute significantly to color in solutions but also to exhibit toxicity against CHO cells.
                                           A cell-culture-compatible antioxidant, a-ketoglutaric acid, was found to be an efficient cell culture

                                           media additive for stabilizing components against degradation, inhibiting the browning of media
                                    formulations, and decreasing ammonia production, thus providing a viable method for developing
Citation: Schnellbaecher, A.; Lindig,      room-temperature stable cell culture media.
A.; Le Mignon, M.; Hofmann, T.;
Pardon, B.; Bellmaine, S.; Zimmer, A.      Keywords: tryptophan; color; cell culture media; LC-MS; antioxidant; cytotoxicity; biomanufacturing
Degradation Products of Tryptophan
in Cell Culture Media: Contribution
to Color and Toxicity. Int. J. Mol. Sci.
2021, 22, 6221. https://doi.org/           1. Introduction
10.3390/ijms22126221
                                                 One strategy for improving biopharmaceutical manufacturing processes is to optimize
                                           cell culture media (CCM). The latest drive in the industry is to improve the chemical
Academic Editor:
                                           stability of hydrated media against degrading conditions such as exposure to light and
Burkhard Poeggeler
                                           increased temperatures. Detrimental light exposure can be encountered unintentionally in
                                           the transport and storage of CCM or during the cell culture itself, as modern cell culture
Received: 30 April 2021
Accepted: 5 June 2021
                                           bioprocesses are often carried out in reaction vessels that are exposed to light [1,2]. It
Published: 9 June 2021
                                           is standard practice to maintain CCM at 4 ◦ C prior to use, but the design of hydrated
                                           CCM that are stable at room temperature (RT) may decrease the energy consumption by
Publisher’s Note: MDPI stays neutral
                                           eliminating the need for refrigeration. This optimization of CCM stability involves both
with regard to jurisdictional claims in
                                           developing methods to detect critical changes to CCM that can negatively impact cell
published maps and institutional affil-    culture [3,4] and using this information to discover strategies to mitigate such changes.
iations.                                         When exposed to stressed conditions (e.g., light, heat), sensitive CCM components
                                           decompose and new degradation products are generated. This chemical change in the
                                           media composition can often be directly observed by a change in the color of the media.
                                           This is a greater issue for feeds of a fed-batch process than for basal media, due to the
Copyright: © 2021 by the authors.
                                           higher concentration of components. This color change is not only a warning signal for
Licensee MDPI, Basel, Switzerland.
                                           a chemically altered CCM but is of added concern for the potential to alter the color of
This article is an open access article
                                           the drug product, a critical quality attribute (cQA) of therapeutic monoclonal antibodies
distributed under the terms and            (mAbs). The ability of degraded CCM components to alter the color of the mAb product
conditions of the Creative Commons         was best demonstrated by Prentice et al., who showed that the light-induced degradation
Attribution (CC BY) license (https://      of cyanocobalamin (vitamin B12) to hydroxocobalamin caused the mAb product to become
creativecommons.org/licenses/by/           pink-colored [5]. However, while many reports explore the contributions of particular
4.0/).                                     CCM components and specific degrading conditions to mAb coloration [5–8], researchers

Int. J. Mol. Sci. 2021, 22, 6221. https://doi.org/10.3390/ijms22126221                                       https://www.mdpi.com/journal/ijms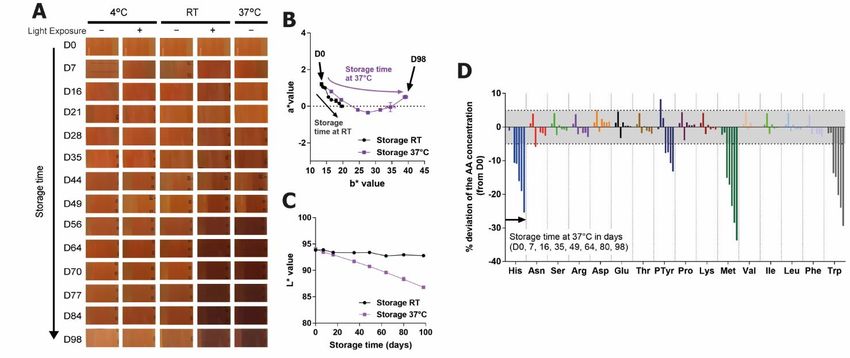
Int. J. Mol. Sci. 2021, 22, x FOR PEER REVIEW 2 of 15
(http://creativecommons.org/li-
Int. J. Mol. Sci. 2021, 22, 6221 of cyanocobalamin (vitamin B12) to hydroxocobalamin caused the mAb product to2be- of 14
censes/by/4.0/). come pink-colored [5]. However, while many reports explore the contributions of partic-
ular CCM components and specific degrading conditions to mAb coloration [5–8], re-
searchers have yet to explore the coloration of CCM itself. The color change associated
have
with yet
the to explore of
degradation thesome
coloration of CCM
cell culture itself.
media The color has
components change
beenassociated
reported, suchwith asthe
degradation
for the Maillard of reaction
some cellofculture
amino media components
acids (AAs) has been
and glucose, reported,
which leads tosuch as for
highly the
oxi-
Maillard reaction of amino acids (AAs) and glucose, which
dized, highly colored organic compounds [9–11]. Other common organic CCM compo- leads to highly oxidized, highly
colored organic compounds [9–11]. Other common organic CCM components shown to
nents shown to produce colored degradation products are thiamine [12,13] and trypto-
produce colored degradation products are thiamine [12,13] and tryptophan [14,15]. The
phan [14,15]. The instability of CCM components is not only an issue for color production,
instability of CCM components is not only an issue for color production, but also for the
but also for the potential production of toxic degradation products, which would be det-
potential production of toxic degradation products, which would be detrimental to cell
rimental to cell culture. Methods to inhibit color change in CCM when exposed to stressed
culture. Methods to inhibit color change in CCM when exposed to stressed conditions (e.g.,
conditions (e.g., heat, light) may also then mitigate the production of toxic degradation
heat, light) may also then mitigate the production of toxic degradation products, which
products, which would be an additional benefit for the biomanufacturing industry.
would be an additional benefit for the biomanufacturing industry.
In this study, the major organic compounds (i.e., amino acids and vitamins) in a feed,
In this study, the major organic compounds (i.e., amino acids and vitamins) in a
developed for CHO-based bioproduction, were investigated for their contribution to col-
feed, developed for CHO-based bioproduction, were investigated for their contribution to
oration (also known as browning) under stressed conditions, with a focus on attaining
coloration (also known as browning) under stressed conditions, with a focus on attaining
knowledge that may be used to develop RT stable CCM. Tryptophan (Trp) was found to
knowledge that may be used to develop RT stable CCM. Tryptophan (Trp) was found to be
bethe
themajor
majorcontributor.
contributor. LC-MS LC-MS technology
technology waswas used
used to
toidentify
identifytryptophan
tryptophandegradation
degradation
products
products which were built up in the stressed conditions that correlatedwith
which were built up in the stressed conditions that correlated withbrowning,
browning,
and
and these products were tested for their ability to contribute to feed coloration andcellular
these products were tested for their ability to contribute to feed coloration and cellular
toxicity.
toxicity.An Anantioxidant
antioxidantknown knowntotobebetolerated
toleratedininhigh
highconcentrations
concentrationsinincell cellculture
culturewas
was
investigated
investigatedfor foritsitsability
abilitytotoreduce
reducebrowning
browningand/or
and/or thethe generation
generation ofofdetrimental
detrimentalTrp Trp
degradation
degradation products.
products. This
Thiswork
work contributes
contributesheavily
heavily toto
the theunderstanding
understanding of of
Trp degra-
Trp degra-
dation
dationinincellcellculture
culturemediamediaandandother
otheraqueous
aqueoussolutions,
solutions,including
includingadvanced
advancedknowledge
knowledge
ofof
TrpTrpdegradation
degradation products
products andand
methods toward
methods towardinhibiting
inhibitingproblematic degradation,
problematic es-
degradation,
pecially
especiallythe the
generation
generation of toxic or highly
of toxic colored
or highly species.
colored species.
2.2.Results
Results
2.1. TryptophanIsIsa aMajor
2.1. Tryptophan MajorInducer
InducerofofBrowning
Browninginina aFeed
FeedUsed
Usedfor
forCHO-Based
CHO-BasedBioproduction
Bioproduction
Experimentsinvestigating
Experiments investigatingthe theeffects
effectsofofincreased
increasedtemperature
temperatureand andlight
lightexposure
exposureinin
the long-term storage of feed showed no color change at 4 ◦ C storage, but storage at RT in
the long-term storage of feed showed no color change at 4 °C storage, but storage at RT in
thepresence
the lightororatat3737°C◦ C
presenceofoflight inin the
the absence
absence ofof light
light both
both causeda astark
caused starkbrowning
browningofofthe
the
medium (Figure
medium (Figure 1A). 1A).
Discolorationand
Figure1.1.Discoloration
Figure andamino
aminoacid
aciddegradation
degradationofoffeedfeedupon
upon9898days
daysofofstorage
storageininstressed
stressedconditions:
conditions:(A) (A)images
imagesofof
feed
feedthroughout
throughoutthethestability
stabilitystudy;
study;changes
changesinin(B)
(B)a*a*and
andb*b*values
valuesand
and(C)
(C)L*L*values
valuesofofthe
theRT and3737°C◦ Cstored
RTand storedsamples
samples
(no light exposure); (D) changes in amino acid content of feed upon 37 ◦ C storage (no light exposure). Gray zones indicate
the maximum variability due to the analytic method.
A more precise measure of the color change was determined using the CIE L*a*b*
color system (See Supplementary Materials Section S1 for details) [16,17]. In the sample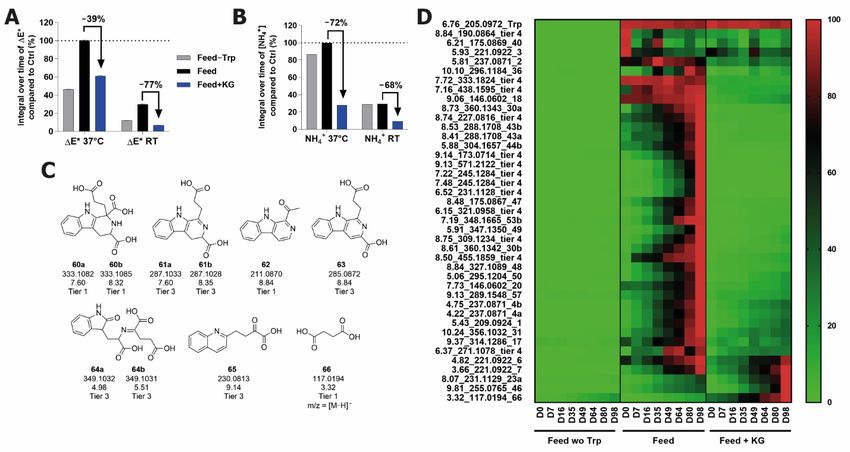
(no light exposure); (D) changes in amino acid content of feed upon 37 °C storage (no light exposure). Gray zones indicate
the maximum variability due to the analytic method.
Int. J. Mol. Sci. 2021, 22, 6221 A more precise measure of the color change was determined using the CIE L*a*b* 3 of 14
color system (See Supplementary Materials Section S1 for details) [16,17]. In the sample
stored at 37 °C, the b* value shifted consistently in a positive direction over time (becom-
ing more yellow), while the a* value decreased slightly at first (became more green) and
stored
then at 37 ◦ C, again
increased the b* (more
value shifted
red). The consistently
RT sample in did
a positive direction
not exhibit suchover time (becoming
a strong color shift
more yellow), while the a* value decreased slightly at first
in these axes but followed the same trajectory as the 37 °C sample (Figure 1B). (became more green)TheandRT
then increased again (more red). The RT sample did not exhibit
sample showed no change in L*, while for the 37 °C sample, the L* value decreased nota-such a strong color shift
in these
bly, whichaxes but followed the
is representative same
of the trajectoryofasthe
darkening 37 ◦ C sample
thesolution over time(Figure
(Figure1B).1C).
TheTheRT
sample showed no change in L*, while for the 37 ◦ C sample, the L* value decreased
similar a*b* trajectory in the two samples but stronger L* changes in the 37 °C sample may
notably, which
indicate that theis representative
increased temperatureof the darkening
is causing of the
thesolution over time (Figure
same degradation, but at1C). The
a faster
similar a*b* trajectory in the two samples but stronger L* changes in the 37 ◦ C sample may
rate. Investigations into the changes in the amino acid levels of these two solutions
indicate that
showed that the increased
at RT, temperature(Met)
only methionine is causing
and Trpthe were
same significantly
degradation, affected
but at a faster
(data rate.
not
Investigations into the changes in the amino acid levels of these two solutions showed that
shown), while at 37 °C histidine (His) and phosphotyrosine (PTyr) were also degraded
at RT, only methionine (Met) and Trp were significantly affected (data not shown), while
(Figure 1D). The PTyr decrease at 37 °C is known to be the result of PTyr being converted
at 37 ◦ C histidine (His) and phosphotyrosine (PTyr) were also degraded (Figure 1D). The
to Tyr, as opposed ◦to being degraded to other components [18]. The vitamins were also
PTyr decrease at 37 C is known to be the result of PTyr being converted to Tyr, as opposed
investigated for their contribution to color, but this was found to be negligible (data not
to being degraded to other components [18]. The vitamins were also investigated for their
shown).
contribution to color, but this was found to be negligible (data not shown).
Due to the considerable amount of literature regarding the production of yellow deg-
Due to the considerable amount of literature regarding the production of yellow
radation products from tryptophan [8,19,20], initial experiments focused on the possible
degradation products from tryptophan [8,19,20], initial experiments focused on the possible
contribution of Trp to the color of the degraded feed, by comparing the complete feed to
contribution of Trp to the color of the degraded feed, by comparing the complete feed to
a version lacking Trp. The presence of Trp in the feed caused a clearly visible increase in
a version lacking Trp. The presence of Trp in the feed caused a clearly visible increase in
browning (Figure 2A). The increase in b* with Trp inclusion suggested a greater increase
browning (Figure 2A). The increase in b* with Trp inclusion suggested a greater increase
of
of color
color in
in the yellow coordinate
the yellow coordinate (Figure
(Figure 2B), while the
2B), while the decrease
decrease inin L*
L* indicated
indicated aa much much
stronger
stronger darkening
darkening of of color
color over
over time
time (Figure
(Figure 2C).
2C). This
This shows
shows that
that there
there isis aa significant
significant
color contribution to the solutions as a result of the presence of Trp. The
color contribution to the solutions as a result of the presence of Trp. The degradation profile degradation pro-
file of the sensitive AAs His, Met, and PTyr were all comparable
of the sensitive AAs His, Met, and PTyr were all comparable in both solutions (data not in both solutions (data
not shown),
shown), demonstrating
demonstrating thatdegradation
that the the degradation of theseof AAs
thesehas AAsnohas no bearing
bearing on coloron color
change
change in the solution. The degradation of these AAs even in the absence
in the solution. The degradation of these AAs even in the absence of Trp indicates that Trp of Trp indicates
that Trp degradation
degradation is not the
is not inducing inducing the degradation
degradation of any of the of other
any ofAAs,
the and
othervice-versa.
AAs, andThese vice-
versa. Theseconfirm
experiments experiments
that Trp confirm that component
is the major Trp is the producing
major component producing
brown products brown
in this feed.
products in this feed.
Figure 2. Stability study of the feed with or without (wo) Trp at 37 ◦ C over 98 days. (A) Images of
the solutions. (B) Changes in a*/b* and (C) L* values in the solutions.
Figure 2. Stability study of the feed with or without (wo) Trp at 37 °C over 98 days. (A) Images of
the
2.2.solutions. (B) Changes
Identification in a*/b* Products
of Degradation and (C) L*from
values
Trpininthe solutions.
Water Stored under Stressed Conditions
Having established that Trp degradation is the lead cause of browning in this feed, the
next step in understanding the color change was to determine which degradation products
are being generated. Due to the complexity of the solutions, LC-MS was chosen as the
optimal method for identifying degradation products of interest. The method was first
applied to degraded solutions of Trp in water, considering this might also help identify
components in the feed that are coming exclusively from Trp self-reactions. Additional
conditions also known to degrade Trp were included in this part of the study, namely expo-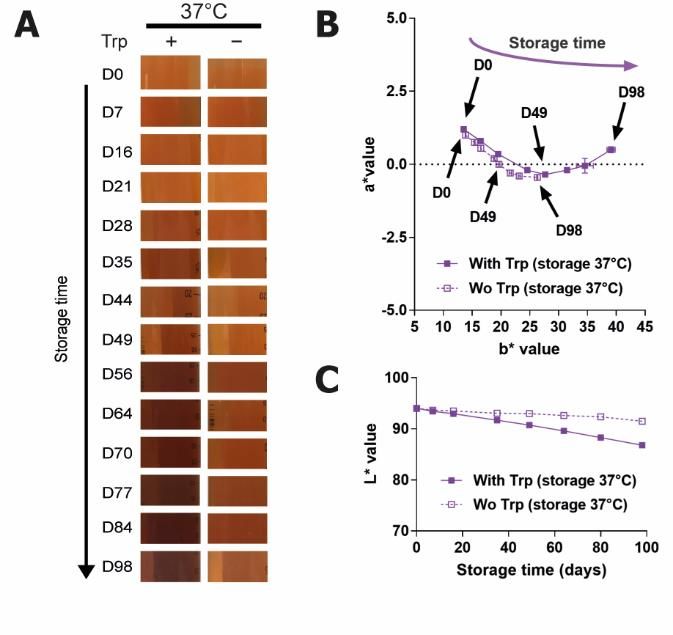
Having established that Trp degradation is the lead cause of browning in this feed,
the next step in understanding the color change was to determine which degradation
products are being generated. Due to the complexity of the solutions, LC-MS was chosen
as the optimal method for identifying degradation products of interest. The method was
Int. J. Mol. Sci. 2021, 22, 6221 4 of 14
first applied to degraded solutions of Trp in water, considering this might also help iden-
tify components in the feed that are coming exclusively from Trp self-reactions. Addi-
tional conditions also known to degrade Trp were included in this part of the study,
namely exposure to
sure to hydrogen hydrogen
peroxide, peroxide,
exposure exposure
to UV to UV
light, and light,at
storage and storage
various at various tem-
temperatures [14].
peratures [14]. This experiment was shorter in duration (24 days) but
◦
This experiment was shorter in duration (24 days) but included a 70 C stressed condition, included a 70 °C
stressed condition,ofasan
as representative representative of an accelerated
accelerated degradation degradation
condition. condition. The
The measurement meas-
of the Trp
urement of thechanges
concentration Trp concentration
showed thatchanges
the UV showed that the
light exposure andUV ◦ C conditions
70light exposure resulted
and 70 °C in
conditions
the greatestresulted in the greatest
Trp degradation (37% Trp
and degradation
42% total loss(37%afterand 42% total
24 days, loss after followed
respectively), 24 days,
respectively), followedincubation,
by hydrogen peroxide by hydrogen peroxide
while the storage at 4 ◦ C, RT,
incubation, while
andthe ◦ C induced
37 storage at 4minimal
°C, RT,
Trp degradation (Figure 3A). Changes in the parameter ∆E*, which broadly quantifiesΔE*,
and 37 °C induced minimal Trp degradation (Figure 3A). Changes in the parameter the
which
overallbroadly quantifies
color change theL*a*b*
in the overall color (see
system change in the L*a*b*Materials
Supplementary system (see Supplemen-
Section S1) [17]
tary Materials
showed that the 70 ◦ CS1)
Section [17] showed
condition changedthatcolor
the 70most
°C condition changed
significantly, colorby
followed most
UV,signif-
while
icantly,
the otherfollowed
solutionsbydid
UV,notwhile
changetheatother solutions
all (Figure didthe
3B). For nottemperature
change at all and(Figure 3B). For
UV conditions,
the temperature
there and UV conditions,
is clearly a correlation between the there is clearly
extent a correlationand
of Trp degradation between the extent
the increase of
in color.
Trp degradation
Interestingly, theand the increase
degradation in color.
caused Interestingly,
by hydrogen peroxidethe did
degradation
not lead to caused by hy-
a correlating
increaseperoxide
drogen in color. did not lead to a correlating increase in color.
Figure
Figure 3.
3. Degradation
Degradation ofof tryptophan
tryptophan in
in water
water (10
(10 mM,
mM, pH pH 7)
7)under
under stressed
stressed conditions.
conditions. The
The conditions
conditions tested
tested were
were stored
stored
with
with varying
varying concentrations
concentrations of
of hydrogen
hydrogen peroxide,
peroxide, exposure
exposure to to UV
UV light,
light, and
and storage
storageat
atvarying
varyingtemperatures
temperaturesfor for24
24days.
days.
(A)
(A) Changes
Changes in in Trp
Trpconcentration
concentration(NS,
(NS,non
nonsignificant).
significant).(B)
(B) Color
Color change
change displayed
displayed as as ΔE*.
∆E*. (C)(C) Venn
Venn diagram
diagram of features
of the the fea-
tures identified
identified in LC-MS
in LC-MS aboveabove an abundance
an abundance threshold
threshold of 30,000.
of 30,000.
With
With the
theknowledge
knowledgeofofwhich whichstress conditions
stress conditions result in an
result in increase
an increasein color, LC-MS
in color, LC-
was employed
MS was employedto determine the major
to determine degradation
the major degradationproducts in each
products condition,
in each and ulti-
condition, and
mately which
ultimately products
which were were
products contributing to browning.
contributing LC-MS LC-MS
to browning. featuresfeatures
that corresponded
that corre-
to unique to
sponded compounds were characterized
unique compounds with unique
were characterized identifying
with information
unique identifying (retention
information
time (rt) and m/z for a given parent ion) and focus was given to analyzing
(retention time (rt) and m/z for a given parent ion) and focus was given to analyzing the most prom-
the
inent
most features,
prominent defined as defined
features, those generated
as those above
generateda chosen
aboveabundance threshold threshold
a chosen abundance (>30,000)
(see Supplementary
(>30,000) Materials Materials
(see Supplementary Section S2Section
for detailed
S2 fordata processing).
detailed Fifty-fiveFifty-five
data processing). features
features
were foundwere found
to be to be in
increased increased
both theinUVboth
andthethe UV and
70 °C the 70 ◦ Ci.e.,
conditions, conditions, i.e., the
the conditions in
conditions
which in which
browning browning
occurred. Thisoccurred.
indicates This indicates
that these that these
features features
are those mostare those
likely to most
rep-
likely small
resent to represent small
molecules molecules
that that are to
are contributing contributing
browning. In to addition,
browning.42In ofaddition, 42 of
these features
these features presented an abundance significantly higher in the 70 ◦ C compared to the
UV condition, corresponding to the relative magnitude of browning in these conditions,
and as such the small molecules corresponding to these features may be those most sig-
nificantly contributing to browning. Structure suggestions for these features were made
based on literature knowledge or by the analysis of the MSMS fragmentation pattern.
Where possible, standards were purchased or synthesized to attain a confirmation for the
proposed structure (see Supplementary Materials Figure S1 for an example of matching
MSMS profiles for standard and experimental data). The structure proposals for each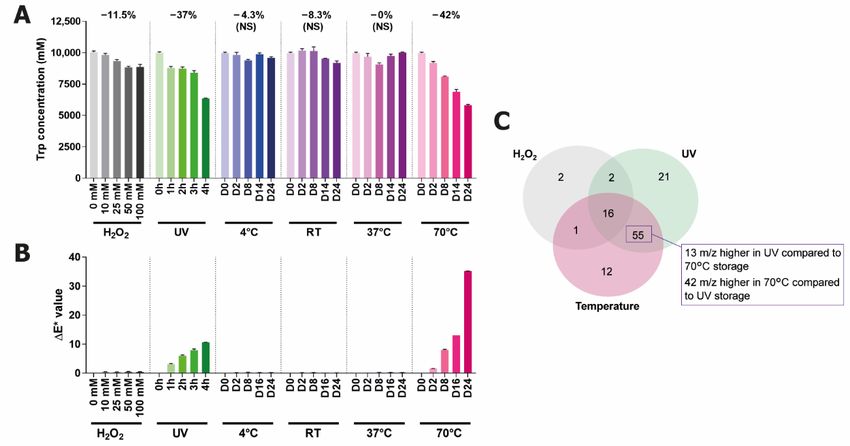
presented an abundance significantly higher in the 70 °C compared to the UV condition,
corresponding to the relative magnitude of browning in these conditions, and as such the
small molecules corresponding to these features may be those most significantly contrib-
uting to browning. Structure suggestions for these features were made based on literature
knowledge or by the analysis of the MSMS fragmentation pattern. Where possible, stand-
Int. J. Mol. Sci. 2021, 22, 6221 5 of 14
ards were purchased or synthesized to attain a confirmation for the proposed structure
(see Supplementary Materials Figure S1 for an example of matching MSMS profiles for
standard and experimental data). The structure proposals for each feature were assigned
a confidence
feature level (a tier)
were assigned based onlevel
a confidence best (a
practices for small
tier) based on bestmolecule
practicesstructure
for smallidentifica-
molecule
tion usingidentification
structure LC-MS [21,22]. A compound
using was assigned
LC-MS [21,22]. A compound tier 1was
when the MSMS
assigned tier 1data
when andthert
matched
MSMS with
data anda pure standard
rt matched anda tier
with pure1*standard
if the confirmation
and tier 1* was
if thevia a standard that
confirmation wascould
via a
not be purified,
standard but for
that could not which the structure
be purified, assignment
but for which based onassignment
the structure the synthetic route
based onwas
the
supportedroute
synthetic by the
wasliterature
supported (see
bySupplementary
the literature (see Materials Section Materials
Supplementary S2 for detailed
Sectiontier
S2 de-
for
detailed tierOf
scriptions). descriptions). Of the
the 109 features 109 features
detected detected as
as significantly significantly
modulated modulated
in these aqueous in these
solu-
aqueous solutions
tions of Trp, of Trp,were
30 features 30 features
assignedwere
to assigned to tier
tier 1 or 1*, 1 or 1*, corresponding
corresponding to a total ofto28a total
con-
of 28 confirmed
firmed compound compound structures,
structures, as somewere
as some features features were assigned
assigned as diastereomers
as diastereomers (absolute
(absolute configuration
configuration unknown—features
unknown—features with earlierwithrtearlier rt are designated
are designated as ‘a’
as ‘a’ and andrtlater
later rt
as ‘b’)
as ‘b’) (Figure
(Figure 4). 4).
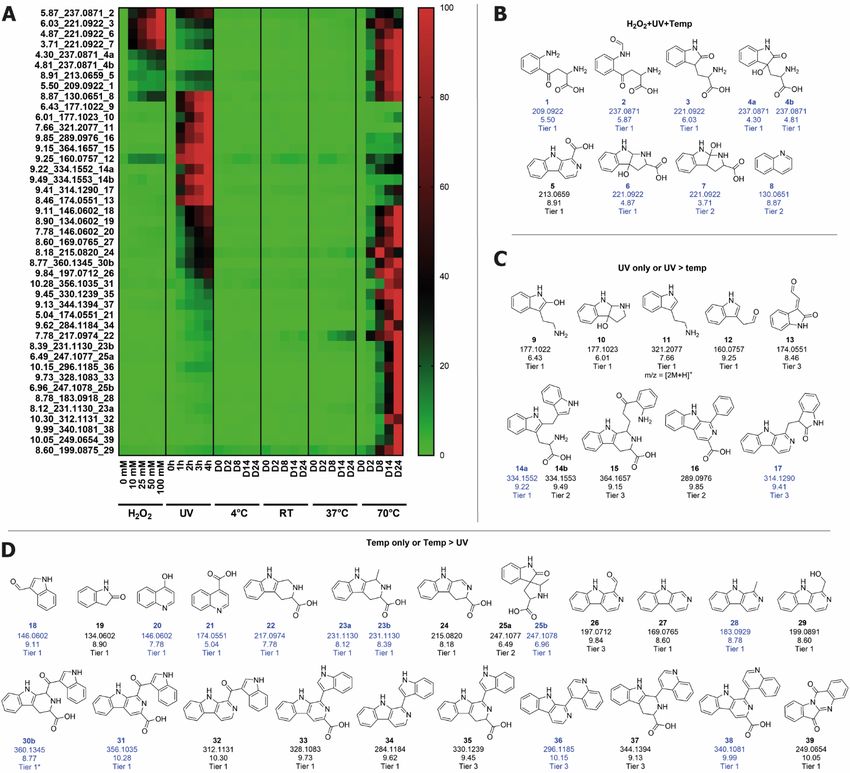
Figure 4. Tier 1–3 features in the aqueous Trp samples which were significantly modulated in at least one of the stress
conditions. (A) Normalized abundance profiles of each feature (rt_m/z_structure number), presented in a heatmap. Green
represents the lowest abundance and red the highest abundance for each feature independently. Structures for features that
were increased (B) in all stress conditions, (C) in UV only or UV > 70 ◦ C conditions, and (D) in 70 ◦ C only or 70 ◦ C > UV
conditions. All m/z represent [M+H]+ unless specified otherwise (shown with structures). Features that are also present in
the 37 ◦ C feed experiment (Table S1) have the compound number and feature data displayed in blue.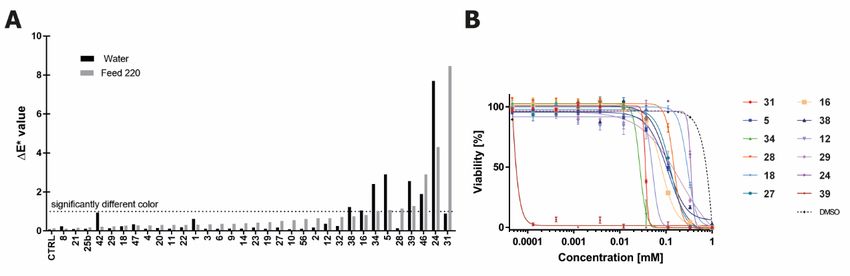
Int. J. Mol. Sci. 2021, 22, 6221                                                                                             6 of 14

                                         Five of these compounds were found in all degradation conditions and correspond
                                   to major known degradation products of Trp: kynurenine (KYN, 1), N-formylkynurenine
                                   (NFK, 2), oxindolylalanine (Oia, 3), dioxindolylalanine (diOia, 4a and 4b), and pyrolloindole-
                                   3-carboxylic acid (PIC, 6) [23]. Within the tier 1 features that increased in abundance in
                                   the UV and/or 70 ◦ C condition and may therefore be contributing to browning, three
                                   main structure classes were identified—b-carbolines, quinolines, and indoles. It is well
                                   established that tetrahydro-b-carboline structures can be easily formed from Trp via a con-
                                   densation reaction with aldehydes and ketones known as the Pictet-Spengler reaction [24],
                                   and that these structures can readily undergo subsequent oxidation, optionally with con-
                                   comitant decarboxylation [25]. This pathway easily explains the presence of the many
                                   b-carboline products, and in some cases the direct aldehyde precursor was also detected,
                                   as is the case for aldehyde 18, which is potentially a direct precursor for carbolines 33 and
                                   34. Quinolines have been shown to be formed from Trp via the initial formation of KYN
                                   (1) [26], which provides a sensible explanation for the appearance of compounds 8, 20, and
                                   21. While the indole moiety in the products is carried over from Trp, most indole structures
                                   exhibit additional oxidation (e.g., 9, 19, 25b). High levels of oxidation are prevalent in most
                                   of the degradation products, especially in the products formed at higher temperatures,
                                   such as the fully unsaturated b-carbolines (e.g., 26–29, 31–34, 36, 38). The oxidation of
                                   tetrahydro-b-carbolines by atmospheric dissolved oxygen has been reported [25,27]. The
                                   presence of spiro[pyrrolidineoxindole] 25 also indicates that the storage conditions are
                                   highly oxidizing. This spiro compound may be formed either via a Mannich reaction
                                   (another type of condensation reaction) between acetaldehyde and the oxidation product
                                   Oia (3) or from the oxidative intramolecular rearrangement of the tetrahydro-b-carboline
                                   23 [28]. Tryptanthrin (39) is a natural product produced by yeast and plant species. Despite
                                   being a natural product, many methods have been developed to synthesize this structure
                                   chemically, usually involving the oxidation of an indole-containing precursor such as in-
                                   dole or isatin, which indicates that this compound is also probably formed in these samples
                                   via oxidative reactions [29]. The only products exhibiting signs of reduction formed pre-
                                   dominantly in the UV condition and are likely caused by radical/photochemical reactions,
                                   as has been shown in the literature for compounds 11 and 14 [30,31]. Structures were also
                                   proposed for 13 other features, falling into the tier 2 or 3 categories (Figure 4). These contain
                                   the same functional groups as seen in the tier 1 compounds and therefore the generation of
                                   these compounds in aqueous solutions under these degradation conditions is highly likely.
                                   The remaining features in this experiment fell into the tier 4 and 5 categories, and their
                                   corresponding abundance data are located in Supplementary Materials, Figure S2.

                                   2.3. Identification of Degradation Products Originating from Trp in Feed Stored at
                                   Elevated Temperature
                                         While the industry is predominantly interested in developing RT stable feed, for
                                   the purposes of detecting degradation products, 37 ◦ C was chosen as representative of
                                   an accelerated degradation condition. An LC-MS analysis of the degraded solutions
                                   previously analyzed for color (Figure 2A) identified 85 features that were highly abundant
                                   only in the feed containing Trp (Table S1). Of the 47 features that were categorized into
                                   tiers 1–3 (55% annotation of features), 22 features were also found in the aqueous Trp
                                   samples (corresponding features have the compound number and feature data in blue in
                                   Figure 4 and are indicated with an asterisk next to the compound number in Table S1).
                                   Additional stability studies of feeds selectively depleted in other organic CCM components
                                   were used to establish the origins of some of the features (CCM component origin shown
                                   in Table S1). Some features were identified as having arisen solely from Trp from the
                                   water-only study (e.g., 40, 41) (Figure 5). A total of 25 features were clearly derived from
                                   AAs, and 13 of these were classified as tier 1–3. Seven features were derived from non-AA
                                   organic CCM components (namely choline, thiamine or pyridoxine) and five of these
                                   were categorized into tiers 1–3 (42 from pyridoxine and 43a/b and 44a/b from choline).
                                   As with the water solutions of Trp, the structures of tier 1 features in feed contain many
                                   of the same functional groups (e.g., ketone, imine, alkene) and structural skeletons (e.g.,
to establish the origins of some of the features (CCM component origin shown in Table
S1). Some features were identified as having arisen solely from Trp from the water-only
study (e.g., 40, 41) (Figure 5). A total of 25 features were clearly derived from AAs, and 13
of these were classified as tier 1–3. Seven features were derived from non-AA organic
Int. J. Mol. Sci. 2021, 22, 6221
CCM components (namely choline, thiamine or pyridoxine) and five of these were7 cate- of 14
gorized into tiers 1–3 (42 from pyridoxine and 43a/b and 44a/b from choline). As with the
water solutions of Trp, the structures of tier 1 features in feed contain many of the same
functional groups (e.g., ketone, imine, alkene) and structural skeletons (e.g., b-carboline,
b-carboline, spirane),that
spirane), indicating indicating
the samethat theof
kinds same kinds of chemical
degradative degradative chemical
processes processes
(e.g., conden-
(e.g.,
sation, condensation, oxidation)
oxidation) occur in feedoccur
and in feedsamples.
water and water samples. Sixty-seven
Sixty-seven features (39features (39
in tiers 1–3)
in tiers 1–3) increased in abundance over time and thus correlated
increased in abundance over time and thus correlated with the increase in browning (Ta-with the increase in
browning (Table S1). The compounds correlating with browning
ble S1). The compounds correlating with browning show many common features—a high show many common
features—a high level
level of oxidation andofalmost
oxidation and the
always almost always
presence ofthe
an presence
aromaticof an aromatic
ring. It is wellring.
under- It
isstood
well that
understood thataromaticity
increasing increasing aromaticity
and conjugationand conjugation
in an organic in an organic compound
compound leads to a
leads
greater to ability
a greater ability light
to absorb to absorb light
[16,17], so [16,17], so it is
it is possible possible
that that these compounds
these compounds are contrib-
are
uting contributing directly
directly to the colorto the color
increase. increase.
However, an However,
examination an of
examination of the direct
the direct contribution of
contribution of these compounds to color in solution is required to
these compounds to color in solution is required to make such a claim. It is importantmake such a claim. It to
isnote
important to note
that features that
that features
were that were
prominent in theprominent
water study in but
the not
water study
in the feedbut not are
study in the
not
feed study are
necessarily not necessarily
absent absent
from the feed. from
The samethefeatures
feed. Themaysame befeatures
generatedmay inbe generated
feed below the in
feed below the cutoff threshold chosen for data analysis or may be difficult
cutoff threshold chosen for data analysis or may be difficult to detect in the complex ma- to detect in the
complex
trix due to matrix
signal due to signal suppression.
suppression.
Figure5.5.Structures
Figure Structures for
fornovel
novelTrp
Trpdegradants
degradantsdetected
detectedin
infeed
feedstudies
studies(those
(thosefeatures
featuresdetected
detectedininboth
bothwater
waterand
andfeed
feed
studies are shown in Figure 4 with their feature data marked in blue). Structures are provided for tier 1–3 features that
studies are shown in Figure 4 with their feature data marked in blue). Structures are provided for tier 1–3 features that were
were significantly modulated in the Trp-containing feed compared to the Trp-depleted feed. All m/z represent the parent
significantly modulated in +the Trp-containing feed compared to the Trp-depleted feed. All m/z represent the parent peaks
peaks detected as [M + H] ions, unless indicated otherwise.
detected as [M + H]+ ions, unless indicated otherwise.
2.4.Color
2.4. ColorContribution
ContributionofofTier
Tier11Compounds
CompoundstotoWater
Waterand
andFeed
FeedSolutions
Solutions
Standardsavailable
Standards availableinin significant
significant enough
enough quantities
quantities werewere
usedused for spiking
for spiking experi-
experiments
ments to see whether they contributed to the coloration of either pure water
to see whether they contributed to the coloration of either pure water or feed. ∆E* > or feed. ΔE*
1
was deemed as a significant change (Figure 6A). Some of these compounds have already
been identified as possessing notable color. Tryptanthrin (39) and pityriacitrin (32) are both
natural products characterized as yellow solids [29,32], and pityriacitrin was shown to
have broad absorption in the UV spectrum [32].water, by compounds 28 and 31 in feed, and by compounds 5, 24, 34, 39, and 46 in both
conditions (Figure 6A). In stability experiments, eight of these nine compounds (all except
46) were present in at least one condition in the degraded water samples, and four of these
nine compounds (28, 31, 38, and 46) were present in the degraded feed. Compounds 28,
Int. J. Mol. Sci. 2021, 22, 6221
31, and 46 all had significant abundances in the degraded feed samples and displayed a
8 of 14
significant production of color in the feed, which would suggest that these compounds
may be critical to enhance color in feed stored at enhanced temperatures.
Figure6.6.(A)
Figure (A)Color
Colorchange
changeasasmeasured
measuredby by∆E*
ΔE*in inboth
bothwater
waterand
andfeed
feedupon
uponaddition
additionofofdegradation
degradationproducts.
products.Solutions
Solutions
of
of degradation products in DMSO were spiked into aqueous solutions to yield a theoretical concentration of
degradation products in DMSO were spiked into aqueous solutions to yield a theoretical concentration of 500 µ M (1%
500 µM (1%
DMSO).
DMSO). (B) Toxicity data for the Trp degradation products that produced a significant toxicity in CHOK1 GS cells
(B) Toxicity data for the Trp degradation products that produced a significant toxicity in CHOK1 GS cells as
as
comparedto
compared tothe
theDMSO
DMSOcontrol.
control.Error
Errorbars,
bars,S.D.
S.D.
Compounds
2.5. Toxicity were dissolved
of Trp-Derived in DMSO
Degradation at 50in
Products mMCHOandCells
then spiked into the solutions to
achieve a final compound concentration of 500µM. Some
Four of the established Trp degradants are natural products of the tested compounds
and have beenformed
tested
a precipitate immediately upon spiking of the DMSO solution. As the precipitates in
previously for various types of cellular toxicity. Pityriacitrin (32) and pityriacitrin B (31)
solution can interfere with the absorption measurement, each sample was centrifuged prior
have demonstrated toxicity against some cancer cell lines [33], and while eudistomin U
to taking absorption measurements, meaning that the final concentrations were not all
(34) displayed some toxicity in human cancer cell lines, it was most potent as an antibac-
at 500 µM. This interference from precipitation was shown not to occur in the complete
terial agent [34]. Tryptanthrin (39) is known to exhibit low micromolar toxicity against a
feed samples, as the L*a*b* measurements in the 37 ◦ C samples at 98 days of storage were
wide range of both cancerous and non-cancerous human cell lines [29,35,36]. As we have
shown to be identical before and after the filtration of the medium through a 0.22 µm filter
demonstrated that these compounds are generated from degraded Trp, it was of interest
(data not shown). A significant color change was produced by compounds 16 and 38 in
to investigate the toxicity of these and the other established Trp degradants in CHO cells,
water, by compounds 28 and 31 in feed, and by compounds 5, 24, 34, 39, and 46 in both
the most prevalent cell type used in the biomanufacturing industry. The same panel of
conditions (Figure 6A). In stability experiments, eight of these nine compounds (all except
standards previously tested for color effects were tested for toxicity in a CHOK1 GS cell
46) were present in at least one condition in the degraded water samples, and four of these
line. Twelve compounds were found to elicit notable toxicity in this cell line (GI50 < 1 mM)
nine compounds (28, 31, 38, and 46) were present in the degraded feed. Compounds 28,
(Figure
31, and 466B)all
and
hadwere therefore
significant tested for toxicity
abundances in three other
in the degraded feedCHO cell and
samples clones. The com-
displayed a
pounds showed roughly the same toxicity trends across the four cell
significant production of color in the feed, which would suggest that these compoundslines (see Supple-
mentary
may Materials,
be critical Table S2).
to enhance colorTryptanthrin
in feed stored(39) displayed temperatures.
at enhanced extremely high toxicity across
all cell lines (GI50 ≤ 1.1 µ M), while eudistomin U (34) and pityriacitrin B (31) were fairly
2.5. Toxicity of Trp-Derived Degradation Products in CHO Cells
Four of the established Trp degradants are natural products and have been tested
previously for various types of cellular toxicity. Pityriacitrin (32) and pityriacitrin B (31)
have demonstrated toxicity against some cancer cell lines [33], and while eudistomin U (34)
displayed some toxicity in human cancer cell lines, it was most potent as an antibacterial
agent [34]. Tryptanthrin (39) is known to exhibit low micromolar toxicity against a wide
range of both cancerous and non-cancerous human cell lines [29,35,36]. As we have
demonstrated that these compounds are generated from degraded Trp, it was of interest
to investigate the toxicity of these and the other established Trp degradants in CHO
cells, the most prevalent cell type used in the biomanufacturing industry. The same
panel of standards previously tested for color effects were tested for toxicity in a CHOK1
GS cell line. Twelve compounds were found to elicit notable toxicity in this cell line
(GI50 < 1 mM) (Figure 6B) and were therefore tested for toxicity in three other CHO cell
clones. The compounds showed roughly the same toxicity trends across the four cell
lines (see Supplementary Materials, Table S2). Tryptanthrin (39) displayed extremely high
toxicity across all cell lines (GI50 ≤ 1.1 µM), while eudistomin U (34) and pityriacitrin B
(31) were fairly toxic (10 < GI50 < 22 µM across all cell lines) and compounds 18 and 24
displayed the lowest toxicity of the twelve (GI50 > 226 µM).
2.6. Inhibition of Browning and Degradation Product Formation Using Alpha-Ketoglutaric Acid
With the observation that the structures correlating with increased browning showed
distinct characteristics of oxidation (incorporation of oxygen atoms, increase in aromaticity),With the observation that the structures correlating with increased browning showed
distinct characteristics of oxidation (incorporation of oxygen atoms, increase in aromatic-
ity), the application of a known antioxidant as a method to reduce the browning and con-
comitant production of these degradants was tested. a-Ketoglutaric acid is a common
CCM component with antioxidative properties, which has been shown to have no detri-
Int. J. Mol. Sci. 2021, 22, 6221 9 of 14
mental effect on the CHO cell culture up to 50 mM and to protect against the temperature-
induced degradation of some organic CCM components [37]. The ketoacid was tested for
its ability to minimize browning and the production of Trp degradation products in feed
stored
the at RT or 37
application of °C for 98 days.
a known The ammonia
antioxidant levelstoinreduce
as a method the solutions were also
the browning andmeasured,
concomi-
as this
tant could arise
production offrom
theseseveral of the was
degradants identified
tested.Trp degradation acid
a-Ketoglutaric products in which CCM
is a common nitro-
gen loss is observed
component (e.g., 12, 18,
with antioxidative 19). Increased
properties, which ammonia
has beeninshown
CCM is to undesirable, as it can
have no detrimental
adversely
effect affect
on the CHOcellcellgrowth
cultureand product
up to 50 mMquality [38–40].against
and to protect The addition of aKG induced a
the temperature-induced
39% decreaseofinsome
degradation browning
organic forCCM
feedcomponents
stored at 37 [37].
°C, and
Theaketoacid
77% decrease at RTfor
was tested (Figure 7A).
its ability
This demonstrates that the addition of aKG is highly effective in
to minimize browning and the production of Trp degradation products in feed storeddecreasing browning, as
theRT
at color
or 37 ◦
change
C forat98RTdays.
was lower in the +aKG
The ammonia condition
levels than in the
in the solutions no also
were Trp control.
measured, as
In both
this could conditions,
arise from severalthe decrease in ammonia
of the identified (72% at 37 °C,
Trp degradation 68% atinRT)
products far exceeded
which nitrogen
the decrease
loss brought
is observed (e.g.,about
12, 18,when
19). Trp was excluded
Increased ammonia (13% at 37 °C
in CCM and 0% at RT)as(Figure
is undesirable, it can
adversely affect cell
7B). This suggests thatgrowth and product
the ammonia qualityin[38–40].
production the feedThe addition
is not comingofexclusively
aKG induced from a
39%
Trp, decrease in browning
and that aKG for feed stored
is also inhibiting at 37 ◦ C, and a 77%degradation
the ammonia-generating decrease at ofRTother
(Figure 7A).
organic
This
CCMdemonstrates
compounds, that mostthe addition
probably of aKG
other AAs, is as
highly effective in decreasing
AA deamination browning, as
at higher temperatures
the
is a color change at RT
well-established was of
cause lower in the production
ammonia +aKG condition[41]. than in the no Trp control.
Figure 7. Changes
Figure 7. Changes inin the
the feed,
feed, feed-Trp,
feed-Trp, and
and feed+aKG
feed+aKG solutions
solutions during
during long-term
long-term storage.
storage. (A)
(A) Color
Color change
change measured
measured as
as
∆E*.
ΔE*. (B)
(B)Changes
Changesininammonia
ammoniaconcentration.
concentration.(C)(C)
Structure identifications
Structure for tier
identifications 1–3 features
for tier which
1–3 features are newly
which formed
are newly upon
formed
uponaddition
aKG aKG addition to (D)
to feed. feed. (D) Heatmap
Heatmap showing
showing abundance
abundance changes
changes of features
of features of interest
of interest (denoted
(denoted withwith rt_m/z_struc-
rt_m/z_structure
ture number for tiers 1–3, or else denoted as tier
number for tiers 1–3, or else denoted as tier 4) at RT. 4) at RT.
the 37
In both °C condition,
conditions, 62 features
the decrease in total (see
in ammonia at 37 ◦ C, 68% atMaterials
(72%Supplementary Figuresthe
RT) far exceeded S3
and S4) decreased
decrease in abundance
brought about when Trpupon
was aKG supplementation,
excluded ◦
(13% at 37 Cfive andfeatures exhibited
0% at RT) (Figuresim-
7B).
This suggests that
ilar abundance the ammonia
profiles, and theproduction
formationinofthenine
feedfeatures
is not coming exclusively
was inhibited from Trp,
completely.
and that aKG is also inhibiting the ammonia-generating degradation of other organic CCM
compounds, most probably other AAs, as AA deamination at higher temperatures is a
well-established cause of ammonia production [41].
In the 37 ◦ C condition, 62 features in total (see Supplementary Materials Figures S3
and S4) decreased in abundance upon aKG supplementation, five features exhibited similar
abundance profiles, and the formation of nine features was inhibited completely. However,
12 features had increased abundances with the addition of aKG, and another 14 features
were detected only in the feed+aKG condition. Some of the newly formed features were
identified as compounds formed from the combination of Trp and aKG, e.g., tetrahydro-b-
carboline 60 and its oxidative decarboxylation product, 61 (Figure 7C). For aKG addition
at RT storage, none of these new Trp+aKG features were detected, and 36 features were
markedly reduced or eliminated completely (Figure 7D). Only one remained at a compara-Int. J. Mol. Sci. 2021, 22, 6221 10 of 14
ble abundance with the control (tier 2, corresponding to pyrroloindole 7), and only two
features had increased abundance (tier 1, corresponding to structures 23 and 46), which
were both also increased at 37 ◦ C. Many of the features that had lower abundances in the
+aKG condition were those shown to derive from other CCM components (e.g., 43, 44,
49, 53, 57). Many features corresponding to structures with high oxidation levels were
decreased down to levels comparable to the no Trp control (e.g., 1, 4, 18, 20, 30, 36). The
decreased abundance of these Trp products combined with the reduction in browning
and ammonia production to below the no Trp control level suggests that aKG may be
protecting multiple CCM components from degradation via an antioxidant function. Not
much is known about the function of aKG as an antioxidant, although it is known that the
reaction with the oxidant hydrogen peroxide causes the oxidative decarboxylation of the a-
ketoacid, forming succinic acid (66) [42]. The feature corresponding to this compound was
detected in the feed in negative mode (Figure 7D), and the abundance was increased in the
feed+aKG condition, supporting the hypothesis that aKG is functioning as an antioxidant.
It is curious to note that the Trp degradation was not decreased by aKG supplementation,
but a complete understanding of the chemical changes induced by aKG addition is beyond
the scope of this study.
3. Discussion
This study demonstrated that tryptophan was the major contributor to the browning
of a selected feed. The identification of several Trp degradation products demonstrated that
the condensation reactions of CCM components and oxidation reactions were the major
chemical processes taking place at elevated temperatures. These combinations of reactions
often yielded products with fully oxidized heterocycles and a high level of conjugation,
which are typical properties in colored organic compounds, and correlates with the color in-
crease in the solutions. As these compounds are significantly different in structure from Trp
and as protein translation involves many quality control systems to avoid the incorporation
of incorrect AAs [43], it was deemed unlikely that the incorporation of these degradation
products in the drug product would be a concern. However, the discovery that some of
these compounds can contribute directly to CHO toxicity and feed browning indicates
that these degradation processes can be detrimental in biomanufacturing, and therefore
methods need to be established to limit such degradation in CCM that are intended to
be stored at elevated temperatures. The submicromolar toxicity of tryptanthrin (39) is
especially noteworthy. Its chemical structure is significantly different from that of all of the
other compounds tested (it is the only compound with a indolo[2,1-b]quinazoline core),
and is therefore likely the fundamental reason behind its uniquely high toxicity. It is not
clear by which mechanism tryptanthrin achieves such high toxicity in CHO cells, but in
other cellular toxicity studies it commonly bound to ATP-binding sites of crucial enzymes
in pathways involved in apoptosis regulation, cellular proliferation, and cell survival [25].
Tryptanthrin could therefore be eliciting toxicity via a similar means in CHO cells. For
studies such as this one, which investigate the effects of organic compounds on cell culture,
it is relevant to note that very small amounts of transition metal contaminants can be the
cause of the observed changes (e.g., color and toxicity) [44–46], and as such follow-up
studies may be required to confirm that any detrimental effects are indeed due to the
organic component, though this is currently beyond the scope of this work. The addition of
a-ketoglutaric acid to the cell culture feed was shown to decrease the detrimental chemical
changes in the feed stored at higher temperatures, including browning, ammonia produc-
tion, and the generation of Trp-derived degradation products. The extent of ammonia
reduction suggests that aKG is inhibiting the deamination of other AAs, and the decrease
in major Trp oxidation products, along with the production of succinic acid, suggest that
this may result from aKG functioning as an antioxidant. The production of succinic acid as
a byproduct is possibly even advantageous, as succinic acid is not only colorless in solution
and not toxic to CHO cells, but has even shown potential benefits for mAb production
in CHO cell cultures [47,48]. This work demonstrates the first known application of anInt. J. Mol. Sci. 2021, 22, 6221 11 of 14
antioxidant to stabilize CCM stored at higher temperatures, and thus represents perhaps
the beginning of the next major CCM optimization strategy for the bioprocessing industry.
4. Materials and Methods
4.1. Reagents
Raw materials and cell culture media/feed in the stability studies were all purchased
from Merck KGaA, Darmstadt, Germany, if not stated otherwise. Chemical standards for
LC-MS feature identification were purchased from a commercial supplier and synthesized
externally under contract or in-house. Details of the origins of the standards are provided
in the Supplementary Materials in Table S3. The feed formulation used in this study was a
customized dry powder derived from Cellvento® Feed220 (Merck, Darmstadt, Germany),
depleted in amino acids, and was reconstituted according to the manufacturer’s guidelines,
with amino acids added back as desired.
4.2. Stability Studies
For the Trp solutions, 10 mM Trp solutions were prepared in water with a pH ad-
justment to pH 7.0 ± 0.3 using NaOH(aq.) and sterile filtered with Steriflip® filter units
(Merck, Darmstadt, Germany). For H2 O2 exposure testing, the solutions were spiked with
hydrogen peroxide (30%, 8.82 M) to 0, 10, 25, 50, or 100 mM, and stored for 4h at RT
(~19–23 ◦ C), light-protected. For the UV exposure effects, the solutions were stored for 4 h
under a UV-lamp set to an intensity of 540 V (UV-A, -B and -C radiation). Samples tested
for temperature effects were stored light-protected for 24 days at 4 ◦ C, room temperature
(RT, i.e., ~19–23 ◦ C), 37 ◦ C, or 70 ◦ C. Feed solutions were sterile-filtered as above and stored
for 98 days at 4 ◦ C, RT (~19–23 ◦ C) or 37 ◦ C. The samples were either stored light-protected
or exposed to laboratory fluorescent lighting with partial exposure to glass-filtered daylight
(light-exposed). For testing the a-ketoglutaric acid effects in feed, dry powder feed was
reconstituted with a-ketoglutaric acid, pH adjusted to 7.0 ± 0.3 with NaOH (aq.), filtered
as above, and stored light-protected at RT (~19–23 ◦ C) or 37 ◦ C for 98 days. Ammonia was
quantified using Cedex Bio HT (Roche, Mannheim, Germany). Aliquots were frozen at
−20 ◦ C for subsequent amino acid analysis and LC-MS.
4.3. CIELAB Color Analysis
Absorbance measurements were taken in the range of 380 nm to 780 nm (20 nm steps)
of 100 µL of the samples in four technical replicates (Envision, Perkin Elmer, Waltham, MA,
USA). From the absorbance values, the change in color was calculated using L*a*b* and
∆E* values according to DIN 5033-3 and DIN 6174 norms. The CIE 1931 standard observer
(2◦ ) and the D65 illuminant were selected.
4.4. Amino Acid Analysis
Amino acid analysis was performed using a pre-column derivatization using the AccQ
Tag® Ultra Reagent kit. Derivatization, chromatography, and data analysis were performed
according to the supplier recommendations (Waters, Milford, MA, USA).
4.5. LC-MS Feature Determination and Structure Elucidation
Time point series from stability study experiments were analyzed using UHPLC (Van-
quish, Thermo Fisher, Waltham, MA, USA) coupled with an ESI-Q-ToF mass spectrometer
(Impact II, Bruker, Bremen, Germany). Briefly, the samples were diluted 10 times in water
prior to LC-MS/MS analysis. Five microliters of sample were loaded in 99.9% buffer A
(20 mM ammonium formate/0.1% FA) onto a XSelect HSS T3 column (2.1 × 150 mm,
3.5 µm, Waters, Milford, MA, USA) thermostated at 40 ◦ C with a flowrate of 300 µL/min.
An optimized 12 min linear gradient was applied using 100% methanol (buffer B) as follows
(minute/% B): 0/0.1, 2/0.1, 4/20, 6/30, 8/80, 8.5/100, 9.5/100, 9.6/0.1, 12/0.1.
LC-MS/MS analyses were performed in triplicate using the Impact II mass spec-
trometer equipped with an ESI source (Bruker, Bremen, Germany). MS acquisition wasInt. J. Mol. Sci. 2021, 22, 6221 12 of 14
performed in positive and negative modes with capillary voltages set at 4500 V and 3500 V,
respectively, and the end plate offset set at 500 V. Nebulizer and dry gas (250 ◦ C) were set at
1.4 bar and 9.0 L/min, respectively. MS spectra were acquired over the m/z range 20–1000
with a scan rate of 12 Hz followed by data-dependent auto-MS/MS acquisitions using a
fixed MS-MSMS cycle time of 0.5 s and a summation time adjusted to the precursor inten-
sity. The data analysis was performed using Data Analysis 4.0 (Bruker, Bremen, Germany)
and Progenesis QI (Non-linear Dynamics—Waters, Newcastle, UK). Briefly, raw data were
processed as centroid data using the automatic peak detection algorithm of Progenesis
QI. No normalization was applied to the dataset due to the nature of the study. Unique
ions (retention time (rt) and m/z pairs) were grouped, and their abundancies were summed
to generate unique features. Only features satisfying the following criteria were consid-
ered: abundance >30,000; fold change >3; corrected ANOVA q-value < 0.05. Hierarchical
clustering was used to identify groups (e.g., identify all Trp related features by using a
feed depleted in Trp and selecting the features that are not found in that condition). For
the representation in the heatmap, the data were normalized between the minimum and
the maximum abundance for each replicate independently. Feature annotations were per-
formed within Progenesis QI using precursor mass, fragment mass, and retention time (if
available) with tolerances set at 5 ppm, 20 ppm, and 0.3 min, respectively. Comprehensive
LC-MS data is provided in Supplementary Materials 2.
4.6. Color Measurements of Standards
Chemical standards were prepared as 50 mM stocks in DMSO and then spiked into the
aqueous solutions (either water or feed) to achieve a theoretical compound concentration
of 500 µM (1% DMSO). The solutions were centrifuged, and the absorbance measurements
of these solutions was measured and converted to ∆E* values as described above. The
control condition was pure DMSO (1% v/v).
4.7. Cytotoxicity Assay
To assay the potential toxicity induced in the CHO cell culture by the Trp degradation
products found in this study, a cytotoxicity assay CellTiter-Glo® Luminescent Cell Viability
Assay (Cat #G7572, Promega, Madison, WI, USA) was used, following the manufacturer’s
instructions. Briefly, the cells were seeded with 25,000 viable cells per cavity of a 96-well
opaque white cell culture plate (Thermo Fisher, Waltham, MA, USA) in 80 µL of a pre-
warmed medium. Tryptophan degradation compounds were added in triplicates to the
cells, ranging from 1 mM to 46 nM. A DMSO control was added in the same concentration
range as the tryptophan degradation compounds were diluted. The dose response curves
were fitted with a 4PL model by GraphPad Prism v.7 (GraphPad Software, San Diego, CA,
USA) after luminescence readout with an EnVision 2104 Multilabel Reader (Perkin Elmer,
Waltham, MA, USA).
5. Conclusions
Tryptophan is capable of degrading in cell culture media under elevated temperatures
to afford colored and toxic degradation products. This is a concern for the development
of room-temperature stable CCM, in which medium color change and a buildup of toxic
compounds are undesirable. The storage of tryptophan-containing CCM at higher temper-
atures is best undertaken only if precautions are made to inhibit degradation into colored
or toxic compounds. This study demonstrated that the addition of an antioxidant, namely
alpha-ketoglutaric acid, is a viable means to achieve this goal of stabilizing CCM against
problematic tryptophan degradation processes.
Supplementary Materials: The following are available online at https://www.mdpi.com/article/10
.3390/ijms22126221/s1.
Author Contributions: Conceptualization, A.Z.; methodology, A.S., A.L., M.L.M., T.H., and S.B.;
formal analysis, A.S., A.L., M.L.M., and T.H.; investigation, A.S., A.L., M.L.M., T.H., and B.P.; dataYou can also read