Interim results Q1 2021 - 29 April 2021 - House of Control
←
→
Page content transcription
If your browser does not render page correctly, please read the page content below
Interim results Q1 2021
                                  29 April 2021

Copyright © 2021 - Confidential
The growth journey continues
 NOKm
                                                                                                                 +43%
                                                                                                                    ARR
160                                                                                         160                  Q1‘20-Q1’21
                                                                                                                               151
                                                                                      146
140                                                                                         140
                                                                                                                         138

                                                    +35%                        125
                                                     ARR CAGR
120                                                    ‘16-20                               120

                                                                                                         105
                                                                          102                      99
100                                                                  94                     100

                                                                83
 80                                                                                          80
                                                      71

 60
                                              58                                             60
                                         52
                 45                 44
 40                                                                                          40

 20                                                                                          20

  0                                                                                           0

                      2016                2017          2018          2019        2020            LTM to Q1'20         LTM to Q1'21
                                                   Revenue   ARR

  Copyright © 2021 - Confidential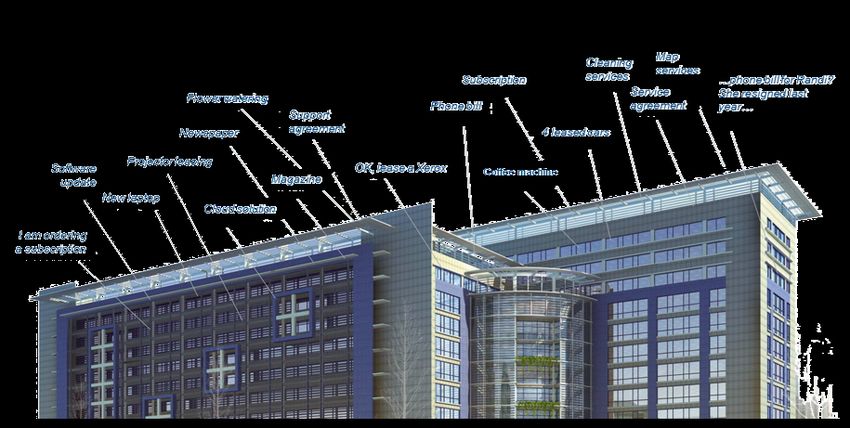
Investing in continued growth
  Strong revenue growth in Q1                                                            Revenue and EBITDA - last 12 months
        Q1 2021:                                                                         NOKm
                                                                                                                                                         138
                                                                                  150                                                                               30, 00%

        • Revenue of NOK 39.7m, +49% year-on-year                                 130
                                                                                                                                          125
                                                                                                                           113
                                                                                                                                                                    25, 00%

        • Organic revenue +17%                                                    110

                                                                                            99              103
                                                                                                                                                                    20, 00%

        Last 12 months:                                                            90

        • Revenue of NOK 137.9m, +39% year-on-year
                                                                                                                                                                    15, 00%

                                                                                   70

        • Organic revenue +17%                                                                                                            8%
                                                                                                                                                         7%
                                                                                   50                                                                               10, 00%

                                                                                                                           5%
        • Proforma revenue NOK 150.3m                                              30

                                                                                                            3%
                                                                                                                                                         1%
                                                                                                                                                                    5,0 0%

  Investing in product innovation and sales for continued high                     10

                                                                                                                           4%             4%
  growth
                                                                                                                                                                    0,0 0%

                                                                                  -10
                                                                                            -4%
  •      Cost increase reflects significantly increased workforce in technology   -30
                                                                                                                                                                    -5,00%

         development and sales                                                              -6%
                                                                                  -50                                                                               -10,00%

  On track for the 2025 ARR target of NOK 500m                                          LTM to Q1'20    LTM to Q2'20   LTM to Q3'20   LTM to Q4'20   LTM to Q1'21
                                                                                                       Revenue         EBITDA %         Adjusted EBITDA %

Copyright © 2021 - Confidential
Operations                        01   Highlights

                                  02   Operations

                                  03   Financials

                                  04   Summary and Outlook

                                  05   Appendix

                                  07   Agenda

                                  08   Agenda

                                  09   Agenda

                                  10   Agenda

Copyright © 2021 - Confidential
House of Control in brief
The CFO’s best friend

• ‘Best-of-breed’ horizontal software for close                                 ARR by country
  to 1,300 CFOs across the Nordics                                               NOK 151m
                                                      Business         20%        end-Q1-21
• Large and underpenetrated market                process solutions    of ARR
  opportunity with limited direct competition

• Scalable subscription-based model with high                                           72%
                                                                                       76%
  recurring revenue
                                                   Supplementary
• Consistent organic growth supported by             solutions         18%
  M&A                                               (23 and growing)   of ARR                           11%
                                                                                                        8%

• Organic growth levers in increased
                                                                                                          Sales office
  penetration, new products and services, and                                                             Headquarter
  upselling and cross-selling across the
  customer base                                                        62%          11%
                                                  Complete Control
                                                                       of ARR
• Multiple M&A opportunities for continued
  Nordic growth and European expansion                                                           Europe/Aus:6%
                                                                                                             5%

Copyright © 2021 - Confidential
Where we come from

                                                                                                                                  Cleaning   Map
                                                                                                                                  services   services
                                                                                                           Subscription                                 …phone bill for Randi?
                                                          Flower watering                                                                 Service       She resigned last
                                                                                                     Phone bill                           agreement     year…
                                                                               Support
                                                           Newspaper           agreement
                                                                                                                          4 leased cars

                                  Software       Projector leasing
                                                                                       OK, lease a Xerox     Coffee machine
                                    update                               Magazines
                                             New laptop
                                                              Cloud solution

                           I am ordering
                           a subscription

Copyright © 2021 - Confidential
Established a broad portfolio of solutions
Business process 20%
solutions of ARR
Authority Supplier Invoice IFRS 16 Budgeting
Procurement
management portal management reporting & Forecasting
Supplementary
solutions 18%
Rent Project Assets Advanced Integration Transactions Currencies of ARR
(23 and growing) management
ESG
notification
HR Digital
signing
Spend visibility and cost savings Multilanguage support for cross-border
usage
Complete Control Notifications on expiries, renewals, due dates etc. 62%
Track and delegate lease contract of ARR
Easier budgeting process and cash flow visibility responsibility
Copyright © 2021 - ConfidentialExpanding into business intelligence software
• Acquired Business Analyze AS, and their all-
in-one business intelligence platform
• Further broadens the portfolio of business
process solutions Procurement Authority Supplier Invoice
management portal management
Business process
• In-house: IFRS 16 reporting software inhouse
solutions
• DinERP: Procurement, authority management,
supplier portal and invoice management
IFRS 16 Budgeting Business Intelligence
• Effectplan: budgeting & forecasting solutions reporting & Forecasting Dashboard
• Working to standardize all the new enterprise
offerings and deploy the House of Control
salesforce Supplementary
solutions
• Synergies potential from new sales, upselling
and cross-selling to both existing and new
customers
Complete Control The CFO’s best friend®
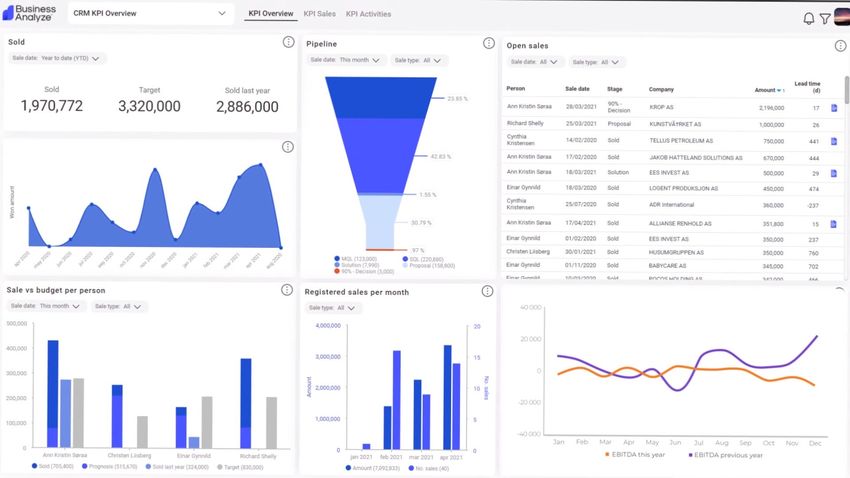
Copyright © 2021 - ConfidentialAcquiring Business Analyze:
All-in-one Business Intelligence dashboard solutions
Business Analyze dashboard example
• ARR of ~NOK 10 million and approximately
300 customers with limited overlap to House of
Control
• Key to accomplish our "CFO dashboard" ambitions
• Clear strengthening of our Business Intelligence
capabilities and market understanding
• Optimized for CRM systems and being adopting to
ERP systems
• Data integration from broad set of databases, web
APIs, Excel, and more
“Our ambition is to provide the control panel that will be the first thing any CFO checks out
every morning and the last thing he or she sees at the end of the working day” – CEO Lasse Sten
Copyright © 2021 - ConfidentialWhere we are going
Supplier Contracts
Customer Contracts Contract
Lifecycle
Forecasting & Budgeting
Cleaning Map Employee Contracts
Analytics & Reporting
Subscription services services …phone bill for
Flower watering Service Randi? She
Phone bill agreement resigned last year…
Support
Dashboard
Newspaper agreement 4 leased cars
Purchasing
Projector leasing
Software
update Magazines
OK, lease a
Xerox
Coffee machine
Invoices
Business
New
laptop Cloud processes
solution
I am Payments
ordering a
subscription
Resources (ERP)
Incumbent
Customers (CRM) Business
Employees (HRM) systems
House of Control offering
DinERP
House of Control integration
Copyright © 2021 - ConfidentialAcquisitions have doubled our addressable market
Large addressable Nordic markets
NOKbn
Complete
Control
NOK 1,9bn • Our acquisitions have doubled the
addressable market to ~60 times the
current ARR
~NOK 9bn • Creates room for additional growth in
Business Market opportunity existing markets
Supplementary
Process
Solutions
solutions
NOK 1,5bn
• New sales, upselling and cross-sales on a
NOK 5,5bn + growing customer base
Source: Third-party consultancy
Copyright © 2021 - ConfidentialProduct development progressing fast
• Continuous improvements of the 5th generation
Complete Control
• Public APIs for better integrations
• Advanced Document Reader for entering contracts
• Document Search
• Launched tool for consolidated IFRS 16 reporting
• Complete Procure is live for the first customers
• Effectplan's development resources are integrated
into the HoC organization
Copyright © 2021 - ConfidentialInvesting in products, customers and sales
Number of employees
140
120
100
80
60
40
20
0
Q1 2020 Q2 2020 Q3 2020 Q4 2020 Q1 2021
Administration Development Customer success Sales
Copyright © 2021 - ConfidentialFinancials 01 Highlights
02 Operations
03 Financials
04 Summary and Outlook
05 Appendix
07 Agenda
08 Agenda
09 Agenda
10 Agenda
Copyright © 2021 - Confidential43% year-on-year ARR growth in Q1 2021
Annual Recurring Revenue (ARR) bridge • Organic ARR growth of 20% last
NOKm 12 months, and increase of NOK
NOK 5 million in Q1 2021
3
8 • Exceptionally strong new sales
1
4 for the season, up 146% from
140
9 Q1’20
• Net retention at 98%, affected by
non-renewal of a significant
21
151 DinERP contract
146
• 99% net retention in the legacy
115
0
4 134
1
0
5 business
3
105
110 • Expect continued high new sales
102
and positive net retention for
remainder of 2021
90
ARR Dec'19
Net retention
Net retention
Net retention
ARR Dec'20
ARR Sep'20
Net retention
Net retention
Acquired ARR
Acquired ARR
New customers
ARR Mar'20
New customers
ARR Jun'20
New customers
New customers
New customers
ARR Mar'21
Copyright © 2021 - ConfidentialARR growth in all geographies
Norway Sweden Denmark Europe and Australia
NOKm NOKm NOKm NOKm
16 16
108 109
28% 65% 15 63%
CAGR CAGR CAGR 14
9 9
85
70
8 8
52
40 6 6
3 3
2 2
1 1
2016 2017 2018 2019 2020 Q1 21 2016 2017 2018 2019 2020 Q1 21 2016 2017 2018 2019 2020 Q1 21 2016 2017 2018 2019 2020 Q1 21
1) ARR portfolios was not registered by geography prior to opening branches 01.01.2018. ARR portfolio for 2017 has been estimated based on sales to the different geographies
2) HoC has been present in Denmark since 2015, but revenues did not grow significantly before the new sales/expansion strategy was implemented in January 2017
Copyright © 2021 - ConfidentialKey figures Q1 2021
Key figures
NGAAP accounting standard
Proforma
• Revenue +49% to NOK 39.7m in NOK thousand Q1 2020 Q1 2021 % 2020 2020
Q1, with recurring revenue at 88% Recurring revenue 25 602 34 988 37 % 117 448 130 639
Other revenue 1 003 4 723 371 % 7 347 14 214
• Costs driven by high investments Total revenue 26 605 39 711 49 % 124 795 144 853
Operating costs -27 998 -44 426 -119 814 -132 792
in software developers, customer EBITDA -1 393 -4 715 4 980 12 061
support and sales EBITDA-margin -5 % -12 % 4% 8%
Special items -1 400 -3 678 -5 173 -5 173
• Reported EBITDA-loss of NOK Adjusted EBITDA 7 -1 037 10 153 17 234
4.7m and adjusted EBITDA-loss of Adjusted EBITDA-margin 0% -3 % 8% 12 %
NOK 1.0m Depreciation & Amortization -3 132 -9 569 -22 653 -32 012
Operating profit/loss, EBIT -4 526 -14 285 -17 673 -19 950
• High depreciation and
Net financial items -3 515 -5 585 -14 806 -14 922
amortization level Profit/loss before tax -8 040 -19 870 -32 479 -34 872
• Includes amortization of excess
Q1 2020 Q1 2021 % 2020
value from acquisitions of NOK NOK million
ARR 105 151 42 146
3.2m million under NGAAP*
New customers, ARR 3 8 21
Net retention, % 100 % 98 % 98 %
*Under IFRS, such amortization would not be booked
Copyright © 2021 - ConfidentialCash flow
Cash flow Q1 2021
• Net cash flow from operating activities NOK -6.0
million
• Mainly reflects losses in the period
• Includes deferred revenues and commission costs
• Cash flow from investing activities NOK -8.6 million
• Software development
• Free cash flow hence NOK -14.6 million
• Cash flow from financing activities NOK -2.6 million
• Interest payments
• Cash and cash equivalents remains solid at NOK
329.5 million
Copyright © 2021 - ConfidentialBalance sheet
Assets Equity & liabilities
NOKm
• Changes mainly reflect share issues increasing
522 522
equity and cash position, and increased assets as a
33
result of acquisitions 490
490
67
• Strong financing and liquidity position
94
390
390
• Equity ratio of 63% 329
• Cash position of NOK 329 million
290
290
• Committed capital and acquisition facility (CAF) of
154 154
NOK 198 million, after NOK 168m increase in
190
190
46 328
19
December 68
90
62
147
90
• Financial flexibility to pursue high growth ambitions 30
82
56
-10
-10
-8
Q1'20 Q1'21 Q1'20 Q1'21
Cash Other ST liabilities
Current assets Deferred revenue
LT liabilities
Non-current assets
Total equity
Copyright © 2021 - ConfidentialSummary and 01 Highlights
Outlook 02 Operations
03 Financials
04 Summary and Outlook
05 Appendix
07 Agenda
08 Agenda
09 Agenda
10 Agenda
Copyright © 2021 - ConfidentialOpportunity-rich environment to continue our growth journey Copyright © 2021 - Confidential
Clear ambitions

                                                               2025 ambitions

                                                                 NOK 500m+
Annual Recurring Revenue (ARR)
                                                             excluding acquired ARR

                                                                      30%
Organic ARR growth
                                                                   2021-2025

Net retention rate                                                    110%

EBITDA margin                                                         40%

                                                          The CFO’s best friend®
Fulfilling our vision
                                  Providing financial control and facilitating optimization of business processes

Copyright © 2021 - Confidential
House of Control • ‘Best-of-breed’ horizontal software for close to 1,300 CFOs across the Nordics • Large and underpenetrated market opportunity with limited direct competition • Scalable subscription-based model with high recurring revenue • Consistent organic growth supported by M&A • Organic growth levers in increased penetration, new products and services, and upselling and cross- selling in existing portfolio • Multiple M&A opportunities for continued Nordic growth and European expansion Copyright © 2021 - Confidential
Appendix                          01   Highlights

                                  02   Operations

                                  03   Financials

                                  04   Summary and Outlook

                                  05   Appendix

                                  07   Agenda

                                  08   Agenda

                                  09   Agenda

                                  10   Agenda

Copyright © 2021 - Confidential
Disclaimer This presentation (the “Presentation”) has been prepared by House of Control Group AS (“House of Control” or the “Company” and together with its subsidiaries the “The Group"). The Presentation has been prepared and is delivered for information purposes only. It has not been reviewed or registered with, or approved by, any public authority, stock exchange or regulated marketplace. The contents of the Presentation are not to be construed as financial, legal, business, investment, tax or other professional advice. Each recipient should consult with its own professional advisors for any such matter and advice. House of Control makes no representation or warranty (whether express or implied) as to the correctness or completeness of the information contained herein, and neither the Company nor any of its subsidiaries, directors, employees or advisors assume any liability connected to the Presentation and/or the statements set out herein. This Presentation is not and does not purport to be complete in any way. By receiving this Presentation, you acknowledge that you will be solely responsible for your own assessment of the Group, its financial position and prospects and that you will conduct your own analysis and be solely responsible for forming your own view of any refinancing and the potential future performance of the Group’s business. The information included in this Presentation may contain certain forward-looking statements relating to the business, financial performance and results of the Group and/or the industry in which it operates. Forward-looking statements concern future circumstances and results and other statements that are not historical facts, sometimes identified by the words “believes”, “expects”, “predicts”, “intends”, “projects”, “plans”, “estimates”, “aims”, “foresees”, “anticipates”, “targets”, and similar expressions. The forward-looking statements contained in this Presentation, including assumptions, opinions and views of the Group or cited from third party sources are solely views and forecasts which are subject to risks, uncertainties and other factors that may cause actual events to differ materially from any anticipated development. None of the Company or any other company in the Group, or any of its advisors or any of their parent or subsidiary undertakings or any such person’s affiliates, officers or employees provides any assurance that the assumptions underlying such forward-looking statements are free from errors nor does any of them accept any responsibility for the future accuracy of the opinions expressed in this Presentation or the actual occurrence of the forecasted developments. House of Control and its advisors assume no obligation to update any forward-looking statements or to conform these forward-looking statements to the Group's actual results. Investors are advised, however, to inform themselves about any further public disclosures made by the Company, such as filings made with Oslo Børs or press releases. This Presentation does not constitute any solicitation for any offer to purchase or subscribe any securities and is not an offer or invitation to sell or issue securities for sale in any jurisdiction, including the United States. Distribution of the Presentation in or into any jurisdiction where such distribution may be unlawful, is prohibited. House of Control and its advisors require persons in possession of this Presentation to inform themselves about, and to observe, any such restrictions. This Presentation speaks as of the date set out on the front page, and there may have been changes in matters which affect the Group subsequent to the date of this Presentation. Neither the issue nor delivery of this Presentation shall under any circumstance create any implication that the information contained herein is correct as of any time subsequent to the date hereof or that the affairs of House of Control have not since changed, and the Group does not intend, and does not assume any obligation, to update or correct any information included in this Presentation. This Presentation is subject to Norwegian law, and any dispute arising in respect of this Presentation is subject to the exclusive jurisdiction of Norwegian courts with Oslo City Court as exclusive venue. By receiving this Presentation, you accept to be bound by the terms above Copyright © 2021 - Confidential
Profit and loss
                                                    Q1            Q1            FY            FY
                                                  2021          2020          2020          2019
                                            01.01-31.03   01.01-31.03   01.01-31.12   01.01-31.12
NGAAP, All amounts in NOK thousand           Unaudited     Unaudited       Audited       Audited

OPERATING REVENUES AND EXPENSES

Recurring revenue                               34 988        25 602       117 448        88 527
Other operating revenues                         4 723         1 003         7 347         5 251
Total operating revenues                        39 711        26 605       124 795        93 779
Salaries                                        32 814        20 391        90 935        66 341
Other operating expenses                        11 612         7 608        28 879        35 450
Total operating expenses                        44 426        27 998       119 814       101 791

Operating profit/loss before depreciation        -4 715        -1 393        4 980         -8 012

Depreciation and amortization                    9 569         3 132        22 653         8 884
Operating profit/loss                           -14 285        -4 526      -17 673       -16 896
Net financial items                              -5 585        -3 515      -14 806         -3 968
Profit/loss before tax                          -19 870        -8 040      -32 479       -20 864

Copyright © 2021 - Confidential
Cash flow
Q1 FY
2021 2020
01.01-31.03 01.01-31.12
All amounts in NOK Unaudited Audited
Operating activities
Profit/loss before tax -19 870 -32 479
Depreciation and impairment 9 569 22 653
Change in net working capital 4 280 4 196
Other non-cash items
Net cash flows from operating activities -6 021 -5 630
Net cash flows from investing activities -8 617 -23 127
Free cash flow -14 638 -28 757
Net cash flows from financing activities -2 550 293 828
Cash and cash equivalents at the beginning of the
346 680 81 609
period
Net change in cash and cash equivalents -17 188 265 071
Cash and cash equivalents at the end of the period 329 492 346 680
Copyright © 2021 - ConfidentialBalance sheet - Assets ASSETS 31.03.2021 31.03.2020 31.12.2020 All amounts in NOK thousand Unaudited Unaudited Audited Non-current assets Deferred tax assets 7 000 3 974 7 035 Other intangible assets 138 798 50 794 140 282 Total intangible assets 145 798 54 767 147 316 Property, plant and equipment 820 768 946 Other non-current assets 548 581 578 Total non-current assets 147 166 56 116 148 841 Current assets Inventories 188 219 188 Trade receivables 8 477 5 532 8 591 Other short-term receivables 36 987 24 561 35 801 Current assets 45 652 30 312 44 579 Cash and cash equivalents 329 492 67 944 346 680 TOTAL ASSETS 522 310 154 372 540 100 Copyright © 2021 - Confidential
Balance sheet – Equity and Liabilities
EQUITY AND LIABILITIES            31.03.2021   31.03.2020   31.12.2020
All amounts in NOK thousand       Unaudited    Unaudited      Audited
Equity
Share capital                         11 408        9 831       11 383
Other equity                        316 922       -17 606     335 738
Total equity                        328 329        -7 775     347 121

Liabilities
Deferred tax liabilities                  0         5 492           0
Other provisions                       3 635           0         3 635
Interest bearing debt                90 636       76 090       90 782
Total non-current liabilities        94 271       81 582       94 417
Trade payables                         4 096        2 583        3 920
Public duties payable                  9 411        5 995      14 794
Deferred revenue                     66 869       61 936       63 120
Other short term liabilities         19 333       10 052       16 728
Total current liabilities            99 710       80 566       98 563
Total liabilities                   193 981      162 147      192 979
TOTAL EQUITY AND LIABILITIES        522 310      154 372      540 100

Copyright © 2021 - Confidential
You can also read