Alliance Aviation Services Limited Half Year Results Presentation - FY2021 10 February 2021 - AFR

Page created by Lee Holmes
 
CONTINUE READING
Alliance Aviation Services Limited Half Year Results Presentation - FY2021 10 February 2021 - AFR
Alliance Aviation Services Limited
    Half Year Results Presentation
                          FY2021
                      10 February 2021
Alliance Aviation Services Limited Half Year Results Presentation - FY2021 10 February 2021 - AFR
Contents                                                      03.   KEY MESSAGES

                                                                   04.   FIVE REVENUE STREAMS

                                                                   05.   FINANCIAL SUMMARY

                                                                   11.   OUTLOOK

                                                                   13.   FUNDING THE E190’s

                                                                   14.   STABLE CONTRACT CLIENT BASE

                                                                   15.   COMMODITY EXPOSURE

                                                                   16.   FOOTPRINT

                                                                   17.   OPERATIONAL EXCELLENCE

                                                                   18.   DISCLAIMER

Alliance Aviation Services Limited 1HFY2021 Results Presentation                                       2
Alliance Aviation Services Limited Half Year Results Presentation - FY2021 10 February 2021 - AFR
Key                                                                                                                                 CASH

     Messages
                                                                         Underlying profit
                                                                                                                           Operating cash flow of
     Alliance Aviation Services Limited announces a                       before tax of                                                                                       Revenue from operations
                                                                                                                            $47.5m, up 225.3%
     half year result which includes:                                   $26.7m, up 72.3%                                                                                       of $154.8m, up 2.3%*

     •   Another record profit;
     •   Record operating cash flows;
     •   Change in mix of flight hours;
                                                                                                                                           DEBT
     •   The settlement of 10 E190 aircraft; and
     •   A positive outlook for FY2021 with growth                                                                                                                              Change in mix of flight
                                                                      1 aircraft added to the                                   Net debt $6.9m
         forecast in FY2022 and beyond.                                fleet – Fleet total, 43                                                                                  hours - 19,067 for the
                                                                                                                                                                                         half

                                                                   *All contract and the majority of charter client contracts contain a rise and fall formula which impacts on the quantum of revenue recognised as
                                                                   well as fuel expensed. The average fuel price across Alliance’s five main ports decreased by 34% in the first half of the financial year when
                                                                   compared to the prior year comparative. In the half year this has had a significant effect on reported revenue and direct costs. Fuel typically
                                                                   accounts for between XX% and XX% of a flight cost base dependent on port, flight time and flight schedule.
Alliance Aviation Services Limited 1HFY2021 Results Presentation                                                                                                                                                      3
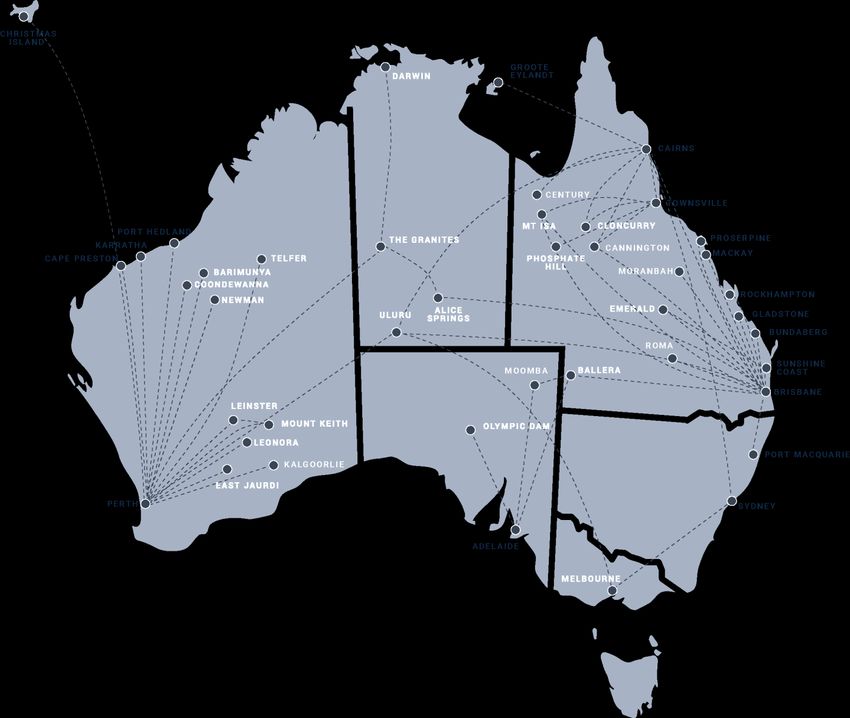
Alliance Aviation Services Limited Half Year Results Presentation - FY2021 10 February 2021 - AFR
Contract                                     Wet
     Contract                                                                              Revenue                                      Lease

     Revenue                                                       RPT                                      Charter                                  Aviation
                                                                   Revenue                                  Revenue                                  Services

                                               1                                 2                               3                             4                              5
     Contract and charter
     continue to experience          Contract Revenue                       Wet Lease                    RPT Revenue                  Charter Revenue               Aviation Services
     revenue growth in the             Long-term contract            Operating Alliance aircraft     Regular public transport       Short-term income from              Allied aviation
                                             flying                      for other carriers          services to regional ports        ad-hoc requests                      services
     first half
                                  • Growth in hours compared         • Wet lease revenue             • RPT revenue continues       • Alliance continued to       • Revenue has been
                                    to 1HFY20 & 2HFY20.                remains low.                    to increase post the lows     operate services for          impacted by the reduction
                                  • The removal of the majority      • Alliance resumed                of COVID-19.                  several clients acquired      of other airlines’
                                    of social distancing has not       services to Emerald on        • Passenger numbers             during FY20.                  operations.
                                    impacted total hours or            behalf of Virgin in             continue to increase        • Charters were operated      • Unity Aviation
                                    revenue.                           November 2020.                  month on month.               for sporting clubs,           Maintenance joined the
                                  • Headline revenue impacted        • Provided capacity for two     • Alliance continues to         government agencies           group from 1 December.
                                    by cost pass through               other operators in the half     service five main RPT         and resource sector         • Aerodrome management
                                    mechanism – fuel price             year.                           routes and this footprint     clients.                      and other engineering
                                    reduced by up to 35%                                               is not expected to          • Alliance has continued to     services continued to
                                    across 5 major ports.                                              expand.                       respond quickly to client     contribute positively in the
                                                                                                                                     requests borne out of         half year.
                                                                                                                                     COVID-19 issues.
Alliance Aviation Services Limited 1HFY2021 Results Presentation                                                                                                                              4
Alliance Aviation Services Limited Half Year Results Presentation - FY2021 10 February 2021 - AFR
FINANCIAL SUMMARY
For the half year ended
31 December 2020

                          5
Alliance Aviation Services Limited Half Year Results Presentation - FY2021 10 February 2021 - AFR
Detail                                                        31 December 2020   31 December 2019
     Operational                                                   Aircraft in service*                                                    43             40

     Metrics                                                       Flight Hours – contracted                                              13,106         11,240

     Alliance consistently delivers                                Flight Hours – wet lease                                                149           4,547

     strong operational performance.
                                                                   Flight Hours – RPT                                                     2,567          2,634

                                                                   Flight Hours – charter                                                 3,065           931

                                                                   Flight Hours – other (incl. maintenance)                                180            358

                                                                   Total Flight Hours                                                     19,067         19,710

                                                                   Average Staff Numbers                                                   552            593

                                                                   Revenue per employee ($k)                                               278            255

                                                                   Contract % of Total Revenue                                             68%            63%

                                                             * Includes all operational aircraft whether flying or in base maintenance.

Alliance Aviation Services Limited 1HFY2021 Results Presentation                                                                                                       6
1HFY2021   1HFY2020    % PCP
                                                                             ($ in millions)
                                                                                                        Actual     Actual    Change
                                                                             Revenue

     Income                                                                      Contract revenue

                                                                                 Wet lease revenue
                                                                                                       105.8

                                                                                                         0.6
                                                                                                                   94.8

                                                                                                                   17.5
                                                                                                                             11.6%

                                                                                                                             (96.6%)

     Statement                                                                   Charter revenue

                                                                                 RPT revenue
                                                                                                        29.3

                                                                                                        16.5
                                                                                                                   10.6

                                                                                                                   21.8
                                                                                                                             176.4%

                                                                                                                             (24.3%)
     Observations:
                                                                                 Aviation services       2.0        6.0      (66.7%)
     •   Contract revenue has increased in the first half due to increased
                                                                                 Other (Incl. FX)       (0.9)       0.1     (1000.0%)
         flight schedules for several clients;
                                                                             Total revenue             153.3      150.8       1.7%
     •   Charter revenue continues to perform strongly. Services
         continued in the half year for new clients acquired in FY20;            Operating expenses   (100.4)    (116.6)     13.9%

     •   RPT revenue is lower than the prior comparative period however      EBITDA                     52.9       34.2      54.7%
         has increased against 2HFY20 as a result of an increased route          Depreciation and
                                                                                                       (18.3)     (17.3)     (5.8%)
         network and an increasing number of passengers;                         amortisation

     •   Operating expenses were lower in the half due to the inclusion      EBIT                       34.6       16.9      104.7%

         of government rebates of $6.9 million and other recurrent cost          Finance costs          (1.0)      (1.4)     28.6%
         efficiencies;
                                                                             PBT                        33.6       15.5      116.8%
     •   Depreciation has increased in line increased fleet numbers; and
                                                                                 Income tax expense    (10.2)      (4.9)    (108.2%)
     •   Alliance will be in an income tax payable position for FY21.
                                                                             NPAT                       23.4       10.6      120.8%

                                                                             Basic EPS (cents)          14.6        8.5      71.8%
Alliance Aviation Services Limited 1HFY2021 Results Presentation                                                                        7
31 December 2020   30 June 20
                                                                     ($ in millions)                                                 % PCP Change
                                                                                                          Actual          Actual
                                                                     Cash                                  45.1            98.8      (54.4%)

                                                                     Receivables                           40.5            54.4      (25.5%)

                                                                     Inventory                             62.9            57.4       9.6%

     Statement of                                                    Total current assets                 148.5           210.6      (29.5%)

     Financial Position                                                  PP&E & Intangibles

                                                                         Right of use assets
                                                                                                          303.1

                                                                                                           19.8
                                                                                                                          217.3

                                                                                                                            8.0
                                                                                                                                      39.5%

                                                                                                                                     147.5%

     Observations:                                                   Total non-current assets             322.9           225.3       43.3%

                                                                     Total assets                         471.4           435.9       8.1%
     •   The PP&E increase relates to various settlements of the
         Embraer fleet and Unity acquisitions;                           Trade & other payables            35.0            48.5       27.8%

     •   Inventory includes $9 million of Embraer spares settled         Borrowings                         3.2            12.0       73.3%

         to date;                                                        Current tax liabilities            7.2             0.0        n/a

     •   Right of use assets and lease liabilities have increased        Lease liabilities                  2.9             1.4      (107.1%)
         due to the inclusion of the Unity Aviation Maintenance          Provisions / other                10.1             8.9      (13.5%)
         hangar land lease and the Adelaide hangar lease;
                                                                     Total current liabilities             58.4            70.8       17.5%
     •   Debt reduced by $2.4 million in the half-year; and
                                                                         Borrowings                        48.8            42.4      (15.1%)
     •   Current tax liabilities reflect Alliance moving to a cash
                                                                         Deferred tax liability            35.1            32.1       (9.3%)
         tax payable position due to increased profits and fully
                                                                         Lease liabilities                 17.4             7.0      (148.6%)
         utilised tax losses.
                                                                         Provisions / other                 1.6             1.5       (6.6%)

                                                                     Total non-current liabilities        102.9            83.0      (23.9%)

                                                                     Total liabilities                    161.3           153.8       (4.8%)

Alliance Aviation Services Limited 1HFY2021 Results Presentation     Net assets                          310.1`           282.1       9.9%      8
31 December   31 December
                                                                    ($ in millions)                                                  2020          2019
                                                                                                                                    Actual        Actual

                                                                    Receipts from customers (inclusive of GST)                      170.9         159.8

     Cash Flow                                                      Payments to suppliers (inclusive of GST)

                                                                    Net interest (paid)/received
                                                                                                                                   (122.8)

                                                                                                                                     (0.6)
                                                                                                                                                 (144.1)

                                                                                                                                                   (1.1)

     Statement                                                      Net cash inflow from operating activities                        47.5          14.6

                                                                        Net payments for aircraft, property, plant & equipment     (101.4)        (19.8)
     Observations:
                                                                    Free cash flow                                                  (53.9)         (5.2)
     •   Record operating cash flow in the half year as a result
         of increased profitability;                                    Proceeds from share issue                                     3.4              -

     •   Operating cash flows also included $6.9 million of             Proceeds from borrowings                                     15.0          18.0
         government rebates and $9 million of inventory
         settlements as part of the E190 transaction;                   Repayment of borrowings                                     (17.4)         (2.1)

     •   Payments for PP&E consisted of $13.9 million in                Principal elements of lease payments                         (0.9)         (0.9)
         Fokker fleet capex and $87.4 million in Embraer fleet
                                                                        Dividends paid                                                   -         (7.3)
         program;
                                                                    Net cash outflow from financing activities                        0.1           7.7
     •   Payments for PP&E also included the Unity Aviation
         Maintenance Pty Ltd acquisition; and                           Net increase in cash and cash equivalents                   (53.7)          2.5

     •   Core debt reduction of $2.4 million bringing net debt to       Effects of currency translation on cash and cash
                                                                                                                                      3.0           0.0
                                                                        equivalents
         $6.9 million.
                                                                        Cash & cash equivalents at the beginning of period           98.8           9.6

                                                                    Cash & cash equivalents at the end of period                     45.1          12.1

Alliance Aviation Services Limited 1HFY2021 Results Presentation                                                                                             9
1H FY2021             2H FY2021   FY2021
                                                                        ($ in millions)
                                                                                                                                            Actual               Forecast   Forecast
                                                                     Existing fleet maintenance

                                                                       Cash outflows

     Capital                                                             Base maintenance providers

                                                                         Engine care program
                                                                                                                                                  2.0

                                                                                                                                                10.2
                                                                                                                                                                    7.8

                                                                                                                                                                    5.5
                                                                                                                                                                               9.8

                                                                                                                                                                              15.7

     Expenditure                                                         Other miscellaneous

                                                                         Operating costs capitalised
                                                                                                                                                  1.0

                                                                                                                                                  0.9
                                                                                                                                                                    0.5

                                                                                                                                                                    1.7
                                                                                                                                                                               1.5

                                                                                                                                                                               2.6
     Observations:
                                                                       Total cash outflows                                                      14.1               15.5       29.6

     •   Existing Fokker fleet maintenance as per forecast;            Non-cash

     •   The last ex-Austrian F70 has now entered the fleet              Parts from inventory used in base
                                                                                                                                                  0.5               3.5        4.0
                                                                         maintenance
         bringing total operational Fokker aircraft to 43;
                                                                    Total existing fleet maintenance                                            14.6               19.0       33.6
     •   Deposit payments on both E190 contracts are included
                                                                    Growth capital expenditure
         in the Embraer program cash out flows as are the
                                                                       Cash outflows
         settlement payments and associated costs for 10
         E190s, entry into service maintenance and ferry costs;          Embraer program (incl Unity transaction)                               87.4               84.8      172.2
         and                                                             Entry into service (Fokker)                                              0.7                 -        0.7
     •   The purchase of Unity Aviation Maintenance Pty Ltd is           Operating costs capitalised (Fokker)                                     0.4                 -        0.4
         also reflected in the Embraer program.
                                                                       Total cash outflows                                                      88.5               84.8      173.3

                                                                       Non-cash
                                                                         Parts from inventory used in base
                                                                                                                                                  0.1                 -        0.1
                                                                         maintenance (Fokker)
                                                                    Total growth capital expenditure                                            88.6               84.8      173.4

                                                                   Total capital expenditure 1                                                103.2               103.8      207.0
Alliance Aviation Services Limited 1HFY2021 Results Presentation   1 – Equates to movement in PP&E plus depreciation (adjusted for Right of Use Depreciation)                          10
Alliance retains a positive outlook for the 2021 financial and forecasts growth in FY2022
                                                              and beyond

     Outlook                                                       Alliance continues to increase its operational
                                                                   activity across a number of revenue types.
                                                                                                                         The charter sector is forecast to continue to remain
                                                                                                                         strong. The shift from RPT services to closed charter
                                                                   Revenue streams impacted negatively by                continues and we forecast the majority of this to be
                                                                   COVID-19 in 2HFY20 are showing signs of               permanent. Domestic tourism charters continues to
     Observations:
                                                                   growth.                                               be a focus for Alliance and it is expected there will be
     •   The Fokker fleet is the backbone of                                                                             a number of additional domestic tours in the
         existing operations for many years to                     Contract revenue is expected to continue to
                                                                                                                         remainder of FY2021.
         come.                                                     increase in FY2021 as the annualised impact of
                                                                                                                         RPT revenues are forecast to increase as border
                                                                   increased schedules is realised.
     •   The Embraer fleet enables growth                                                                                restrictions are lifted enabling passenger movements
         opportunities.                                            Mine maintenance programs are also expected
                                                                                                                         to increase.
                                                                   to have a positive effect in the second half of the
                                                                   year.
                                                                                                                         The Board is focused on maintaining a strong
                                                                                                                         balance sheet. Given the commitments made for
                                                                   Contracted wet lease revenue will increase in
                                                                                                                         major expansion of the Company, the Board has
                                                                   the second half of FY2021 and beyond. The
                                                                                                                         determined that it is prudent not to declare an interim
                                                                   recently announced capacity deal with QANTAS
                                                                                                                         dividend at this time.
                                                                   will commence mid-2021.

                                                                   Alliance will also continue to pursue dry lease
                                                                   and other wet lease opportunities within
                                                                   Australia and the Pacific.

Alliance Aviation Services Limited 1HFY2021 Results Presentation                                                                                                                    11
                                                                                                                                                                                    011
OTHER INFORMATION
For the half year ended 31 December 2020

                                           12
•   As at balance date, Alliance had settlement obligations of USD90.2 million for the
     Funding the                                               balance of the E190 fleet. Subsequent to balance date USD16.08 million has been
                                                               settled.

     E190’s                                                •   Alliance is currently negotiating to fund the balance of the E190 transaction.

                                                                                                             Historical debt to EBITDA ratio
     Alliance has a strong balance sheet
                                                                                             2.5
     and has focussed on ensuring debt
                                                                                             2.3
     capacity is available for expansionary
                                                                                             2.1
     purposes.
                                                                                             1.9

                                                                      Debt to EBITDA ratio
                                                                                             1.7

                                                                                             1.5

                                                                                             1.3

                                                                                             1.1

                                                                                             0.9

                                                                                             0.7

                                                                                             0.5
                                                                                                   FY14   FY15      FY16        FY17         FY18   FY19   FY20
                                                                                                                            Financial Year

Alliance Aviation Services Limited 1HFY2021 Results Presentation                                                                                                  13
Stable Contract Client Base
                                                                                                                       Previous Contract
                                                                   Contracted Client Terms                             Current Contract

Contract 15

Contract 14

Contract 13

Contract 12

Contract 11

Contract 10

 Contract 9

 Contract 8

 Contract 7

 Contract 6

 Contract 5

 Contract 4

 Contract 3

 Contract 2

 Contract 1

        June 2015      June 2016        June 2017       June 2018      June 2019   June 2020   June 2021   June 2022        June 2023      June 2024
Alliance Aviation Services Limited 1HFY2021 Results Presentation                                                                                       14
Phosphate
                                                           Copper/ Gold               2%            Bauxite
                                                               3%                                     2%

     Commodity                                                         Oil / Gas
                                                                                                                          Iron Ore

                                                                                                                          Gold

     Exposure                                                             6%
                                                                                                               Iron Ore
                                                                                                                 30%
                                                                                                                          Copper/ Gold /Uranium

                                                    Silver / Lead / Zinc                                                  Manganese
     Major commodity exposure
                                                             7%
     as a percentage of                                                                                                   Nickel
     1HFY21 revenue by the                                                                                                Silver / Lead / Zinc
     top 15 contracted clients.
                                                        Nickel                                                            Oil / Gas
                                                         8%
                                                                                                                          Copper/ Gold

                                                                                                                          Phosphate

                                                                                                                          Bauxite
                                                           Manganese
                                                             10%
                                                                                                              Gold
                                                                                                              17%

                                                                            Copper/ Gold /Uranium
                                                                                     15%

Alliance Aviation Services Limited 1HFY2021 Results Presentation                                                                                  15
Darwin
                                                                   -   Crew
                                                                   -   Line Maintenance
                                                                   -   Operational base
                                                                                                                       Cairns
     Footprint
                                                                   -   Offices

                                                                                                                        -   Crew
                                                                                                                        -   Line Maintenance
                                                                                                                        -   Operational base
                                                                                                                        -   Offices

                                                                                                                                  Townsville
                                                                                                                                   -   Hangar
                                                                                                                                   -   Crew
                                                                                                                                   -   Line Maintenance
                                                                                                                                   -   Operational base
                                                                                                                                   -   Offices

                                                                                                                                                           Rockhampton
                                                                                                                                                       -   Crew
                                                                                                                                                       -   Line Maintenance
                                                                                                                                                       -   Operational base
                                                                                                                                                       -   Offices

                                                                                                                                               Brisbane
                                                                                                                                                  -   Hangar
                                                                                                                                                  -   Major crew base
                                                                                                                                                  -   Line Maintenance
                                            Perth                                                                                                 -
                                                                                                                                                  -
                                                                                                                                                      Operational base
                                                                                                                                                      Offices
                                                                                                                                                  -   Spares inventory
                                        -   Hangar
                                        -   Major crew base
                                        -
                                        -
                                            Line Maintenance
                                            Operational base
                                                                                          Adelaide
                                        -   Offices
                                                                                          -   Hangar
                                        -
                                        -
                                            Spares inventory
                                            Alliance T2 Facility
                                                                                          -   Major crew base    Melbourne
                                                                                          -   Line Maintenance
                                        -   FIFO Lounge
                                                                                          -   Operational base   - Operational base
                                                                                          -   Offices            - Offices

Alliance Aviation Services Limited 1HFY2021 Results Presentation                                                                                                              16
Forecast Fokker Fleet                        Forecast E190 Fleet                   Safety
                                                                 FY 2021                                     FY 2021                       Certifications

     Operational
     Excellence                                                    F100 – 100 Seat Jet
                                                                          Aircraft
                                                                                                      E190 – 94-114 Seat Jet Aircraft
                                                                                                         No. in operating fleet – 5
                                                                                                                                           Wyvern Wingman
                                                                                                                                             certification
                                                                     No. in fleet – 24                No. settled & not in service - 20
                                                                      (2 in storage)                   Remaining to be settled – 5

                                                                                                             Cruising speed
                                                                                                                 839 kph
                                                                                                                                            Renewed IOSA
                                                              F70 – 80 Seat Jet Aircraft                                                  certification in FY20
                                                                                    1
                                     O                            No. in fleet - 14                          Maximum range

             96%                     T
                                     P
                                                                                                                 4,445 km

                                                                                                                  Engine
               Alliance Airlines
                                                                                                              Two GE CF34-
         consistently achieved 96%                                                                                  10E5
          on time performance for                             F50 – 50 Seat Turbo-Prop                          (18,500 lb)
                                                                       Aircraft                                  turbo fans               BARS Gold standard
            the last 12 months.
                                                                   No. in fleet - 5                                                          maintained
                                                                   1. Including one leased aircraft
Alliance Aviation Services Limited 1HFY2021 Results Presentation                                                                                                  17
Disclaimer
Reliance on third party information
This presentation was prepared by Alliance Aviation Services Limited (ACN 153 361 525) (“Alliance”). Certain market and industry data used in this presentation may have been
obtained from research, surveys or studies conducted by third parties, including industry or general publications. Neither Alliance nor its representatives have independently verified any
such market or industry data provided by third parties or industry or general publications.

Presentation is summary only
This presentation is for information purposes only and is a summary only. It should be read in conjunction with Alliance’s Interim Report for the half year ended 31 December 2020 and
Alliance’s other periodic and continuous disclosure information lodged with the Australian Securities Exchange (ASX), which is available at www.asx.com.au. The content of this
presentation is provided as at the date of this presentation (unless otherwise stated). Reliance should not be placed on information or opinions contained in this presentation and, subject
only to any legal obligation to do so, Alliance does not have any obligation to correct or update the content of this presentation.

Not investment advice
This presentation does not and does not purport to contain all information necessary to make an investment decision, is not intended as investment or financial advice (nor tax,
accounting or legal advice), must not be relied upon as such and does not and will not form any part of any contract or commitment for the acquisition of shares in Alliance. Any
decision to buy or sell securities or other products should be made only after seeking appropriate financial advice. This presentation is of a general nature and does not take into
consideration the investment objectives, financial situation or particular needs of any particular investor. Alliance is not licensed to provide financial product advice in respect of its
shares.

No offer of securities
This presentation is for information purposes only and is not a prospectus, product disclosure statement or other offering document under Australian law or any other law (and will not be
lodged with the Australian Securities and Investments Commission (ASIC) or any other foreign regulator). This presentation is not, and does not constitute, an invitation or offer of
securities for subscription, purchase or sale in any jurisdiction.

Past Performance
Past performance, including past share price performance of Alliance and pro forma financial information given in this Presentation, is given for illustrative purposes only and should not
be relied upon as (and is not) an indication of Alliance’s views on its future financial performance or condition. Past performance of Alliance cannot be relied upon as an indicator of (and
provides no guidance as to) the future performance of Alliance. Nothing contained in this Presentation nor any information made available to you is, or shall be relied upon as, a promise,
representation, warranty or guarantee, whether as to the past, present or future.

                                                                                                                                                                                                18
Disclaimer (cont.)
Future performance and forward looking statements
This Presentation contains certain “forward-looking statements”. The words “expect”, “anticipate”, “estimate”, “intend”, “believe”, “guidance”, “should”, “could”, “may”, “will”, “predict”,
“plan” and other similar expressions are intended to identify forward-looking statements. Indications of, and guidance on, future earnings and financial position and performance are also
forward-looking statements. Forward-looking statements, opinions and estimates provided in this Presentation are based on assumptions and contingencies that are subject to change
without notice and involve known and unknown risks and uncertainties and other factors that are beyond the control of Alliance, its directors and management. This includes statements
about market and industry trends, which are based on interpretations of current market conditions.

No Liability
To the maximum extent permitted by law, neither Alliance or any of its shareholders, directors, officers, agents, employees or advisers accepts, and each expressly disclaims, any liability,
including without limitation any liability arising from fault or negligence, for any errors or misstatements in, or omissions from, this presentation or any direct, indirect or consequential loss
arising from the use of this presentation or its contents or otherwise arising in connection with it.

                                                                                                                                                                                                      19
You can also read