Internal Hospital Crises and Disasters in The Netherlands, 2000-2020
←
→
Page content transcription
If your browser does not render page correctly, please read the page content below
Internal Hospital Crises and Disasters in The
Netherlands, 2000-2020
Vincent Klokman
VieCuri Medisch Centrum https://orcid.org/0000-0002-2566-1230
Dennis G. Barten ( dbarten@viecuri.nl )
https://orcid.org/0000-0002-7185-9491
Nathalie A.L.R. Peters
VieCuri Medisch Centrum
Marieke G.J. Versteegen
VieCuri Medisch Centrum
Jaap J.J. Wijnands
GGD GHOR Nederland
Frits van Osch
VieCuri Medisch Centrum
Menno I. Gaakeer
Admiraal De Ruyter Ziekenhuis
Edward C.T.H. Tan
Radboudumc
Arjen Boin
Universiteit Leiden
Original research
Keywords: Internal hospital disaster, internal emergency, Emergency service, major incidents, disaster
medicine, disaster planning; hospital resilience, The Netherlands
DOI: https://doi.org/10.21203/rs.3.rs-31513/v1
License: This work is licensed under a Creative Commons Attribution 4.0 International License.
Read Full License
Page 1/15Abstract
Study Objective
Internal hospital crises and disasters (IHCDs) occur with regularity and require the attention of emergency
managers, hospital administrators, and physicians to prepare their hospitals accordingly. Information on
the frequency and types of IHCDs is limited and we aim to characterise the disasters that occurred in
Dutch hospitals from 2000 to 2020.
Methods
A retrospective search of news articles utilizing the LexisNexis database, Google, Google News, PubMed
and EMBASE between 2000 and 2020 was conducted. All articles mentioning the closure of a hospital
department in the Netherlands were analysed.
Results
A total of 134 IHCDs were identi ed in a 20-year time period. Of these IHCDs, there were 96 (71.6%)
emergency department (ED) closures, 76 (56.7%) operation room (OR) closures, 56 (41.8%) evacuations,
26 (17.9%) reports of injured persons, and 2 (1.5%) reported casualties. Cascading events of multiple
failures transpired in 39 (29.1%) IHCDs. The primary causes of IHCDs were Information and
Communication Technology (ICT) failures, technical failures, res, power failures, and hazardous material
danger. An average of 6.7 IHCDs occurred per year and a comparison between initial and latter decade
intervals showed an increasing trend with a rate ratio (RR) of 3.2. ICT failures have also signi cantly
increased in this same interval with a RR of 14.2.
Conclusion
IHCDs occur frequently in the Netherlands and have marked effects on hospital critical care departments;
EDs in particular. Signi cantly increasing numbers of IHCDs and ICT related IHCDs per year indicate a
worrying trend requiring attention by emergency managers and hospital administrators.
Introduction
Emergency medical services and the emergency departments (EDs) within hospitals are viewed as the
community based resources responsible for the initial response towards any type of disaster[1]. These
facilities are generally well prepared for community-based disasters. However, they are less prepared for
hospital based events that threaten the daily functioning of the organization. [2] Internal hospital crises
and/or disasters (IHCDs) combine two different concepts. An internal hospital disaster refers to a sudden
onset event that disrupts the everyday, routine services of a facility itself, and may or may not be
associated with an external, or community wide event[2]. An internal crisis refers to an urgent threat to the
wellbeing of patients, and/or the continuity of hospital services that must be addressed under conditions
of deep uncertainty[3–5]. Globally, IHCDs seem to occur with regularity with reported causes including
Page 2/15natural disasters[6, 7], toxic substances[8], structural failure[9], res[10, 11], ooding[12], and terrorist
threats[13].
The Netherlands has a modern healthcare system with effective primary care and specialized acute and
critical care facilities, that are highly ranked and analogous in quality and access to other western
countries [14]. The Netherlands has been assessed to be the 12th most exposed country in the world and
the most vulnerable country in Europe to natural disaster due to signi cant below sea-level land area and
an increasing prevalence of strong storms [15]. However, a sound infrastructure and healthy nances
offset these hazards making the effective rank 49th worldwide [15]. Between 2000 and 2020, the
Netherlands has suffered from 17 natural hazard-induced disasters and 5 technological-induced
disasters [16]. The most common disasters were storms (10), extreme temperature (7), re (2), explosion
(1), ooding (1), and railroad accidents (1). These events varied greatly in magnitude, but collectively
resulted in 2,439 deaths and substantial nancial losses[16].
Nonetheless, little is known about the impact of those widespread disasters on hospitals and healthcare
systems, and on and the frequency and type of IHCDs. Furthermore, IHCDs are scarcely reported in
medical literature as hospitals rarely report on single events. Contrastingly, newspapers, news press
releases and other grey literature often publish valuable information on these incidents. We have
reviewed the IHCDs from 2000 to 2020. Our analysis of these events aims to increase hospital disaster
preparedness and thus improve business continuity in times of crisis.
Materials And Methods
Setting:
The study took place in the Netherlands, a Western European country consisting of 17.4 million people
[17]. The Netherlands maintains a high standard of care with 83 hospitals with an ED and ICU, providing
24-hour emergency care and 4 additional locations open during the day/evening hours [18], affording a
total of 1,989,746 ED visits in 2012[19]. The hospital network is further subdivided into 8 academic
hospitals, 26 teaching hospitals that provide complex patient care[20], and 53 general peripheral
hospitals. Fourteen hospitals serve as level 1 trauma centres organized into 11 trauma regions [21]. The
total number of hospitals has decreased over the years due to mergers and centralization of emergency
care from 107 acute care hospitals in 2003 to the current 87 in 2020 [18]. Patients or the public were not
involved in the design, or conduct, or reporting, or dissemination plans of this study. The institutional
review board of VieCuri Medical Centre, Venlo, the Netherlands, approved this research project (#439).
Search:
Public search engines (PubMed, Medline, Google, Google News) and the LexisNexis database were used
to search for articles and press releases in the Netherlands between January 1, 2000 and December 31,
2019. The search terms “hospital,” “closed,” “ICU,” “ED,” “department,” “failure,” “ re,” and “evacuation” and
their synonyms were combined with Boolean operators resulting in around 50,000 headlines reviewed.
Page 3/15Articles were only included in this study if one or more Dutch hospital departments or intervention units
(ORs, diagnostic rooms/equipment) suddenly and unexpectedly had to be closed, were evacuated and/or
if injured persons needed treatment. Events were excluded if inpatient or critical care departments were
unaffected or if the event did not take place at a fully- edged hospital (containing an ED and ICU). Partial
closures or evacuations were excluded. Hospital or ED closures due to overcrowding, sta ng shortages,
staff strikes, nationwide epidemics, medical malpractice, and insect manifestations were also excluded.
Event Classi cations:
Each event was categorized based on cause of hospital department closure. In cascading events, the
events were sequentially noted with the initial instigating event considered the primary cause utilized in
our analysis. Each of the events were classi ed into technical failures, ICT failures, res (internal and
external), power failures (internal and external), hazardous materials, structural failures, utilities failures,
loss of medical gasses, hydrometeorological, and security and violence). Appendix 1 details exact
classi cation de nitions.
Analysis:
Data was extracted and independently characterised by 2 of the authors (V.W.K. and D.G.B.) When
discrepancies could not be resolved, 3 other reviewers made the nal judgement (M.G.J.V., N.A.L.R.P.,
M.I.G.). For each included “incident,” speci c searches utilising key terms from the included articles
resulted in 3,684 total articles. All possible data was extracted and aggregated into a database and
hospital demographics regarding bed size and trauma level were ascertained from the Dutch Public
Healthcare Database [18]. Fisher’s Exact Tests were performed for comparisons between the rst decade
(2000–2009) and latter decade (2010–2019) of the dataset. Statistical signi cance was represented by
the risk ratio (RR) and its 95% con dence interval (CI). Calculations were performed using a statistical
package program (SPSS version 24, IBM, Chicago, IL).
Results
During the study period from January 1, 2000 to December 31, 2019, 134 IHCDs were identi ed (mean
6.7/ year) in 61 different hospitals. Two IHCDs were found with the PubMed searches and all IHCDs were
found with media searches. Figure 1 depicts the number of incidents per year and risk of IHCD occurrence
per hospital, and shows an increasing trend. This resulted in an average risk of 6.9%, and ranged from
2.8% in 2000 to 16.1% in 2019. A linearly increasing trend in IHCDs was noted (Fig. 1) with a mean rate of
10.2 IHCDs per year in the latter 10 years (2010–2019), compared to 3.2 IHCDs per year in the initial
10 years (2000–2009) (RR = 3.2; 95%CI 2.1 to 4.9). Every Dutch province experienced an IHCD with the
majority of IHCDs occurring in the more populous regions of North Holland 33 (24.6%) and South Holland
32 (23.9%) with an average of > 10 hospitals within 20 km distance [22]. All types of hospitals were
affected by IHCDs including academic hospitals and level 1 trauma centres. The general hospital
characteristics are depicted in Table 1.
Page 4/15Table 1
Hospital characteristics of ICHDs occurring in Dutch hospitals,
2000–2020.
Characteristics and Categories Total number of Incidents, %,
N = 134
Type of Hospital
Academic 20 (14.9)
Teaching 68 (50.7)
peripheral 46 (34.3)
Trauma Level
1 31 (27.4)
2 74 (55.2)
3 29 (21.6)
Hospital Bed Size (No. of Beds)
< 400 34 (27.4)
400–600 39 (29.1)
> 600 61 (45.5)
Of the IHCDs, 108 (80.6%) were isolated internal IHCDs, while 26 (19.4%) were combined internal and
external events that eventually affected the internal functioning of the medical facility. The primary
causes of IHCDs were ICT failures (n = 33; 24.6%), technical failures (n = 29; 21.6%), res (n = 24; 17.9%),
power failures (n = 21; 15.7%), hazardous materials (n = 15; 11.2%), structural failures (n = 5; 3.7%),
meteorological (n = 4; 3.0%), and security and violence (n = 3; 2.2%).
Event cascades were prevalent in 39 (29.1%) IHCDs, resulting in multiple failure type classi cations being
applied to a single IHCD (Table 2). Often occurring cascades include internal power failures resulting
from technical failures after external power outages (9; 23.1%), ICT failures after power outages (6;
15.4%), technical failures leading to re (4; 10.3%), technical failures leading to internal power outages (4;
10.3) and technical failures leading to the release of hazardous materials (3; 9.0%). Cascading events
have resulted in a total of 193 failures which are summarised in Table 2. Cascading events were
especially evident in internal power failures as they accounted for 3.0% of primary failures, compared to
11.9% of total failures. Fire and power failure sources were also noted as they can either arise from within
the hospital terrain, or externally from an outside source or provider. Of the 29 res, 27 (93.1%) were
internal res and 2 (6.9%) were external res. Internal power failures affected 19 (51.4%) and external
power failures 18 (48.6%) events.
Page 5/15Table 2
Characteristics of IHCDs occurring in Dutch hospitals, 2000–2020.
Characteristics and Categories Primary Failures, %, N Total Failures, %, N
= 134 = 193
Technological Failure 29 (21.6) 45 (23.3)
ICT Failure 33 (24.6) 39 (20.2)
Internal Fire 22 (16.4) 27 (14.0)
External Fire 2 (1.5) 2 (1.0)
Internal Power Failure 4 (3.0) 23 (11.9)
External Power Failure 17 (12.7) 18 (9.3)
Hazardous Materials 15 (11.2) 19 (9.8)
Structural Failure 5 (3.7) 7 (3.6)
Utilities Failure 0 (0.0) 4 (2.1)
Loss of Medical Gasses 0 (0.0) 2 (1.0)
Meteorological 4 (3.0) 4 (2.1)
Security & Violence 3 (2.2) 3 (1.6)
Type of IHCD Count, %, N = 134 Count, %, N = 39
Internal 108 (80.6)
Combined 26 (19.4%)
Cascading Events 39 (29.1)
External Power Failure: Technical Failure : Internal 9 (23.1)
Power Failure
ICT Failure After Power Failure 6 (15.4)
Technical Failure leading to Fire 4 (10.3)
Technical Failure leading to Internal Power Failure 4 (10.3)
Technical Failure leading to Hazardous material 3 (9.0)
incident
Changes in the failure trend were compared between the initial and latter decade for each IHCD
classi cation. Primary ICT failures (2000–2009, n = 1, 2010–2019, n = 32) showed a signi cant trend (RR
= 14.2, p = 0.001, Fisher’s Exact Test), while all other failure types did not show signi cant differences.
Figure 1 shows the absolute number of IHCDs and the total number of ICT failures with linear regression.
The total number of IHCDs remains stable, whilst the addition of ICT failures explains the increasing rate
Page 6/15of IHCDs. The increase remained substantial even after correction for the association of cascading
events (RR of 14.2 versus 11.2). Out of 134 IHCDs, a total of 96 (71.6%) ED closures, 76 (56.5%)
operation room (OR) closures, and 56 (41.8%) evacuations (Table 3). Of the 56 total evacuations, in 37
(66.1%) patients/staff/visitors were displaced internally, 12 (21.4%) IHCDs caused the evacuation of
patients externally, and in 7 (12.5%) events patients were evacuated both internally and externally. These
IHCDs caused major disruptions in the hospital critical care departments, with 110 events (82.1%) having
ED involvement with either the ED directly being affected. Of these cases, the ED was directly affected by
the IHCD in 96 IHCDs (87.2%) and activated for the care of injured patients in 26 IHCDs (23.6%). Injured
persons occurred in 26 (17.9%) of the incidents and in 2 (1.5%) cases there were casualties (2 total
casualties).
Table 3
Departmental effects, evacuation locations and injuries of IHCDs
occurring in Dutch hospitals, 2000–2020.
Characteristics and Categories Total, %, N = 134 Total, %, N = 56
ED Involvement 110 (82.1)
ED Presentation Stop 96 (71.6)
OR Stop 76 (56.7)
Evacuations 56 (41.8)
- Internally 37 (66.1)
- Externally 12 (21.4)
- Combined 7 (12.5)
Injuries 24 (17.9)
Casualties 2 (1.5)
Discussion
Hospitals, and their EDs in particular, serve an important function in the community as wardens of public
health in times of crisis and disaster[23]. IHCDs can directly cause physical harm and the sudden closure
of a hospital or ED may force the diversion of patients to distant hospitals where patient records are
lacking [24]. We have shown that hospital and departmental closures have occurred 134 times in the
Netherlands with an increasing trend across a 20-year study period. Natural disasters rarely occur in the
Netherlands and did not cause an IHCD in our dataset, with the exception of 4 incidents caused by
inclement weather. Cascading events of multiple sequential failures occur 29.1% of the time where
ultimately a hospital or department becomes disabled. EDs are often involved both directly and indirectly
with 71% of IHCDs incurring an ED closure.
ICT Failures are an Increasing Trend:
Page 7/15The 20-year-period studied showed an average of 6.7 IHCDs per year. Alarmingly, we have shown that the
incidence of these events is increasing and are in large part explained by the increase in ICT failures. This
should not come as a surprise considering that the healthcare sector has seen increases in the use of
digital technologies in communication, diagnostics, and treatment applications[25]. The frequent
occurrence exposes a weakness in hospital preparedness and business continuity that must be
addressed. Malfunctioning of backup servers, impossibility of quickly reverting to paper dossiers at an
instant’s notice and general lack of training were problems mentioned in the news articles. While our
search did not uncover any reports of cyberattacks on hospital networks, there is previous experience with
ransomware affecting hospital networks in the United Kingdom resulting in multiple, prolonged ED
closures [26]. The increasing trend in ICT disturbances make cybersecurity and digital continuity issues
that should be prioritized in hospital disaster preparedness[27]. Furthermore, our data corroborates a
recent Dutch governmental report detailing an increasing trend of hospital ICT failures and their potential
impacts on patient safety[28].
Cascading Events
Hospitals are complex organisations and structures with convoluted interrelated systems [29]. Hospital
resilience in mitigating internal crises appears to be habitually challenged by multiple consecutive
failures in the form of cascading events. Nearly a third of IHCDs express this trend (Table 2). Hospitals
customarily seem to be able to absorb one “hit” to their internal infrastructure, such as a simple external
power failure where the auxiliary power seamlessly starts and the hospital continues to function.
Conversely, if somewhere in that succession of events an additional failure, such as a technological
failure (i.e. short circuit) occurs hindering the emergency power sources, a hospital fails to be able to
provide lifesaving services. Power outages often led to failures involving the computer networks, and
technological failures also tend to lead to equipment malfunctions that in turn lead to res and
hazardous material releases. Knowledge of these predominantly occurring sequential events are
bene cial for attenuation of safety checks in disaster preparation plans. Examples would include
frequent auxiliary power tests, training of personnel to bypass problems with power and the creation of
emergency procedure guides in the face of ICT failure.
Hazardous Materials
Hospitals are fertile grounds for disaster as they are packed with ammable gasses, toxic substances,
biological sources and radioactive materials. Patients injured by these same types of substances ideally
present to the ED in a decontaminated state. However, this is not always the case, endangering hospital
employees or prompting evacuation. Hospital evacuations occurring from both threatened and actual
hazardous material exposure, or release typically come with little warning or time to prepare, often
occurring in EDs [30]. Between 1971 and 1999, 18% of U.S. hospital evacuations were due to hazardous
materials[31]. Comparatively, we found 19 incidents occurring in the Netherlands in the past 20 years,
each necessitating evacuation (33.9% of total evacuations). High consequence infectious diseases and
emerging infectious diseases such as the 2019 Novel Coronavirus (COVID-19), also pose signi cant risks
Page 8/15to hospitals and EDs, where hospitals need be able to safely treat infected individuals while maintaining
surge capacity[32]. Unprepared hospitals receiving these types of patients lead to dangerous situations,
panic and eventual evacuations. Our dataset entails 2 ED closures lasting several hours due to possible
Ebola viral disease infection. Unpreparedness and no prior notice of patient arrival caused considerable
delay while the emergency services scrambled to collect appropriate protective equipment and protocols.
Hospital Characteristics
Our data has shown that hospitals in the Netherlands are susceptible to sudden closure due to IHCDs
irrespective of trauma level or academic specialties. The acute closure of academic hospitals and level 1
trauma centres places a large burden on emergency medical services by increasing the travel distance to
an appropriate medical centre, or the need to transport severely injured patients to underprepared centres.
Critical access hospital closures would exacerbate these problems in more rural settings. Closer hospital
proximities and multiple trauma centres in larger urban areas make this problem less evident.
Advice to ED and Hospital
Hospitals shelter a high number of vulnerable and dependent individuals, sustained by high densities of
medical and support staff. Risks and hazards to potential disasters must be made apparent and planned
for. As part of a hospital’s accreditation in the Netherlands, a hospital disaster plan must be available,
and the staff must be trained to act in extenuating circumstances to both external and internal sources of
disruption [33, 34]. The most common types of internal disaster plans only encompass computer system
failures, power failures, and res [35]. We have enumerated the possible types of IHCDs having transpired
in the Netherlands, which can be extrapolated and applied as potential hazards to the majority of modern
healthcare facilities in developed countries. If these internal disaster plans are revised in line with our
ndings, this will have the potential to improve hospital recovery in times and possibly prevent
unnecessary closure. Hospital management o cials and emergency physicians should attenuate their
hospital disaster plans based on the incidents we have enumerated to prevent future closure. Creation of
generic crisis response templates based on the most common disaster and cascading events will allow
hospital coordinators to create trainings to show employees how the various hospital systems are
organised and how to respond to speci c failures [29]. Training of hospital staff, notably ED staff, should
occur frequently to ensure seamless activation of disaster plans. Furthermore, a uni ed body that
registers IHCDs nationally and that acts as a hospital disaster preparedness expertise centre would be a
valuable medium where learned lessons can be shared with other medical centres.
Limitations:
There are several limitations in our search method that may have led to under ascertainment of total
incidents. Due to the subjective nature of press and news releases, bias towards sensationalistic and
newsworthy events may have arisen, leaving out smaller and less impactful incidents. However, we deem
it likely that events in which a department had to be closed urgently would have made the news.
Underreporting of incidents may have occurred in earlier years due to inaccessibility of articles and
Page 9/15decreased number of reporting news outlets (i.e. now more online news articles than print versions).
Furthermore, we have only included acute care hospitals and our results cannot be applied to specialised
clinics and hospitals. Potentially valuable information on the exact duration of department closure was
not available in all incidents. Nonetheless, the sources and databases used are the best available. This is
to our knowledge the rst study utilizing this search methodology to characterize IHCDs, but can be
applied to other regions in the world. Therefore, our classi cation system of IHCDs from news sources
has not been validated. This study was geographically limited to the Netherlands, though we believe that
the incidence and failure types to be applicable to all modern hospitals with the exception of natural
disasters more common in other regions of the world.
Conclusion
Healthcare Facilities are vulnerable with IHCDs regularly occurring in the Netherlands and have marked
effects on hospital critical care departments; EDs in particular. An increasing trend in incidence is seen,
explained by the signi cant increase of ICT failures. Cascading events of multiple failures transpire
nearly a third of the time, limiting the ability of a hospital to stave off closure due to failure. Emergency
managers should attenuate their hospital disaster plans based on the incidents we have enumerated to
prevent future closure. Hospital staff should receive regular training to respond to IHCDs.
Abbreviations
CI
Con dence Interval
COVID-19
2019 Novel Coronavirus
ED
Emergency Department
ICT
Information and Communications Technology
ICU
Intensive Care Unit
IHCD
Internal Hospital Crisis and Disaster
OR
Operating Room
RR
Rate Ratio
U.S.
United States
Page 10/15Declarations
ETHICS APPROVAL AND CONSENT TO PARTICIPATE
The institutional review board of VieCuri Medical Center, Venlo, the Netherlands, approved this study
(#439).
CONSENT FOR PUBLICATION
Not applicable.
AVAILABILITY OF DATA AND MATERIALS
Please contact author for data requests.
COMPETING INTERESTS
The authors declare that they have no competing interests.
FUNDING
This research was funded by the Acute Care Network of Limburg (Netwerk Acute Zorg Limburg; NAZL).
The funding body was not involved in the design of the study and collection, analysis, and interpretation
of data nor in writing the manuscript.
AUTHORS’ CONTRIBUTIONS
DGB conceived the study. DGB and VWK designed the study. FO provided statistical advice on the study
design; all authors approved the study protocol. Data was extracted and independently characterised by 2
of the authors (V.W.K. and D.G.B.) When discrepancies could not be resolved, 3 other reviewers made the
nal judgement (M.G.J.V., N.A.L.R.P., M.I.G.). Data were analyzed by VWK with the assistance of DGB and
FO. VWK drafted the manuscript, and all authors contributed substantially to its revisions. All authors
read and approved the nal version of the manuscript.
ACKNOWLEDGEMENTS
Not applicable.
AUTHORS’ INFORMATION
VWK is resident emergency medicine at VieCuri Medical Center (VCMC) in Venlo, the Netherlands. DGB is
emergency physician and residency program director at VCMC. Furthermore, he is a member of the
scienti c committee of the Netherlands Society of Emergency Physicians (NSEP). NALRP and MGJV are
emergency physicians at VCMC. JJJW is safety expert at the North-Limburg Safety Region. FO is a
clinical epidemiologist at VCMC. MIG is emergency physician at Admiraal de Ruyter Hospital, Goes, the
Page 11/15Netherlands. ECTHT is trauma surgeon and medical disaster preparedness o cer at Radboudumc
medical center in Nijmegen, the Netherlands. He also holds the position of HEMS physician. AB is
professor at the department of political science at Leiden University, Leiden, the Netherlands.
Dissemination declaration: These results will be shared with the Crisis coordinators of each hospital to
prevent further internal hospital disasters and/or crises.
References
1. Lewis CP, Aghababian RV. Disaster planning, part I: Overview of hospital and emergency department
planning for internal and external disasters. Emergency Medicine Clinics. 1996;14(2):439–52.
2. Aghababian R, et al. Disasters within hospitals. Ann Emerg Med. 1994;23(4):771–7.
3. Sternberg E. Planning for resilience in hospital internal disaster. Prehospital Disaster Med.
2003;18(4):291–9.
4. Rosenthal U, Charles MT, Hart Pt, Coping with crises: The management of disasters, riots, and
terrorism. 1989: Charles C Thomas Pub Limited.
5. Boin A, Stern E, Sundelius B, The politics of crisis management: Public leadership under pressure.
2016: Cambridge University Press.
6. Nates JL. Combined external and internal hospital disaster: impact and response in a Houston
trauma center intensive care unit. Critical care medicine. 2004;32(3):686–90.
7. Sheppa CM, et al. The effect of a class IV hurricane on emergency department operations. Am J
Emerg Med. 1993;11(5):464–7.
8. Oktay C, et al., Personnel Response during an Internal Emergency—Unexpected Release of an Irritant
Gas in a Hospital. Workplace health & safety, 2013. 61(9): p. 381–383.
9. Barten DG, Veltmeijer MT, Peters NA. Emergency Department Ceiling Collapse: Response to an
Internal Emergency. Disaster Med Pub Health Prep. 2019;13(4):829–30.
10. Sharma R, Kumar A, Koushal V. Response to a re incident in the operation room: a cautionary tale.
Disaster medicine and public health preparedness, 2019: p. 1–5.
11. Wapling A, et al., Review of ve London hospital res and their management: January 2008-February
2009, in Review of ve London hospital res and their management: January 2008-February 2009.
2009, National Health Service (NHS London).
12. Biesheuvel T, Brouwers C, Bloemers F, Lessons learned from the evacuation of the VU University
Medical Centre after ooding. Nederlands tijdschrift voor geneeskunde, 2017. 161: p. D861-D861.
13. Hojman H, et al., Securing the emergency department during terrorism incidents: lessons learned
from the Boston Marathon bombings. Disaster medicine and public health preparedness, 2019.
13(4): p. 791–798.
14. Fullman N, et al. Measuring performance on the Healthcare Access and Quality Index for 195
countries and territories and selected subnational locations: a systematic analysis from the Global
Page 12/15Burden of Disease Study 2016. The Lancet. 2018;391(10136):2236–71.
15. Garschagen M, et al., World risk report 2016. 2016.
16. CRED (Centre for Research on the Epidemiology of Disasters). 2010. EM-DAT. The International
Disaster Database. Universite´ catholique. http://emdat.be/. Accessed 19 Feb 2020.
17. Statistiek CB.v.d. Population Counter. 2020 25-02-2020 01-03-2020]; Available from:
https://www.cbs.nl/en-gb/visualisaties/population-counter.
18. Volksgezondheid.info. Ziekenhuiszorg→Regionaal & Internationaal→Locaties. 2019 [cited 2020 03-
03-2020]; Available from:
https://www.volksgezondheidenzorg.info/onderwerp/ziekenhuiszorg/regionaal-
internationaal/locaties - node-algemene-en-academische-ziekenhuizen.
19. Gaakeer MI, et al., Inventarisatie van SEH-bezoeken en zelfverwijzers. Ned Tijdschr Geneeskd, 2014:
p. A7128-A7128.
20. STZ B, Samenwerkende Topklinische opleidingsZiekenhuizen. 2020 01-03-2020]; Available from:
https://www.stz.nl/1087/over-ons/stzziekenhuizen.
21. Zorg LNA. Landelijk Netwerk Acute Zorg. 01-03-2020]; Available from: https://www.lnaz.nl/.
22. Statistiek CBv. Meeste Nederlanders wonen binnen 5 kilometer van ziekenhuis. 2009 12-8-2009 01-
04-2020]; Available from: https://www.cbs.nl/nl-nl/nieuws/2009/33/meeste-nederlanders-wonen-
binnen-5-kilometer-van-ziekenhuis.
23. Organization WH. Hospital emergency response checklist-An all-hazards tool for hospital
administrators and emergency managers. Copenhagen, Denmark: World Health Organization (WHO)
Regional O ce for Europe; 2011.
24. Lee DC, et al., Redistribution of emergency department patients after disaster-related closures of a
public versus private hospital in New York City. Disaster medicine and public health preparedness,
2015. 9(3): p. 256–264.
25. Buntin MB, et al. The bene ts of health information technology: a review of the recent literature
shows predominantly positive results. Health Aff. 2011;30(3):464–71.
26. Gordon WJ, Fairhall A, Landman A. Threats to Information security-public health implications. N Engl
J Med. 2017;377(8):707–9.
27. Dameff C, et al., Cyber Disaster Medicine: A New Frontier for Emergency Medicine. Annals of
emergency medicine, 2020.
28. Veiligheid Ov, Patiëntveiligheid bij ICT-uitval in ziekenhuizen. 2020: The Hague.
29. Klock AP Jr. Fires, Floods, and Hospital System Failures: Hazards and Disaster Preparedness. Asa
refresher courses in anesthesiology, 2000. 28: p. 81–97.
30. Burgess JL. Hospital evacuations due to hazardous materials incidents. Am J Emerg Med.
1999;17(1):50–2.
31. Sternberg E, Lee GC, Huard D. Counting crises: US hospital evacuations, 1971–1999. Prehospital
Disaster Medicine. 2004;19(2):150–7.
Page 13/1532. Sánchez SM, Shenoy ES, Biddinger PD. The indispensable role of emergency medicine in national
preparedness for high consequence infectious diseases (HCIDs). Journal of the American College of
Emergency Physicians Open.
33. Zorg NI.v.A.i.d. NIAZ. 2015 01-03-2020]; Available from: https://www.niaz.nl/.
34. International JC, Joint Commission International. 2020 01-03-2020]; Available from:
https://www.jointcomissioninternational.org/en/.
35. Lee C, et al. The preparedness of hospital health information services for system failures due to
internal disasters. Health Information Management Journal. 2009;38(2):18–26.
Figures
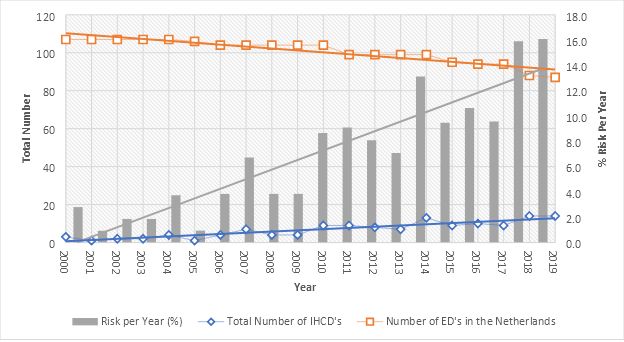
Figure 1
Number and risk of ICHDs plotted against the number of EDs in the Netherlands, 2000-2020. X-axis
depicts the years 2000-2020. Left Y-axis depicts the total number of ICHDs per year. Right Y-axis depicts
the calculated risk (percentage) per hospital per year to be confronted with an ICHD. Orange boxes depict
the number of EDs per year in the Netherlands. ABBREVIATIONS ICHDs: Internal Hospital Crises and
Disasters EDs: Emergency Departments
Page 14/15Figure 2
Per year trends of ICHDs and primary ICT failures with linear regression, 2000-2020. X-axis depicts the
years 2000-2020. Left Y-axis depicts the total number of ICHDs per year. ABBREVIATIONS ICHDs: Internal
Hospital Crises and Disasters ICT: Information and Communication Technology
Supplementary Files
This is a list of supplementary les associated with this preprint. Click to download.
ResearchChecklist.doc
APPENDIX1.docx
Page 15/15You can also read