Investigating Health Context Using a Spatial Data Analytical Tool: Development of a Geospatial Big Data Ecosystem
←
→
Page content transcription
If your browser does not render page correctly, please read the page content below

JMIR MEDICAL INFORMATICS                                                                                                           Haithcoat et al

     Original Paper

     Investigating Health Context Using a Spatial Data Analytical Tool:
     Development of a Geospatial Big Data Ecosystem

     Timothy Haithcoat, MS; Danlu Liu, MSc; Tiffany Young, MSc; Chi-Ren Shyu, PhD
     Institute for Data Science and Informatics, University of Missouri, Columbia, MO, United States

     Corresponding Author:
     Chi-Ren Shyu, PhD
     Institute for Data Science and Informatics
     University of Missouri
     22 Heinkel Building
     Columbia, MO, 65211
     United States
     Phone: 1 573 882 3884
     Fax: 1 573 884 8709
     Email: shyuc@missouri.edu

     Abstract
     Background: Enabling the use of spatial context is vital to understanding today’s digital health problems. Any given location
     is associated with many different contexts. The strategic transformation of population health, epidemiology, and eHealth studies
     requires vast amounts of integrated digital data. Needed is a novel analytical framework designed to leverage location to create
     new contextual knowledge. The Geospatial Analytical Research Knowledgebase (GeoARK), a web-based research resource has
     robust, locationally integrated, social, environmental, and infrastructural information to address today’s complex questions,
     investigate context, and spatially enable health investigations. GeoARK is different from other Geographic Information System
     (GIS) resources in that it has taken the layered world of the GIS and flattened it into a big data table that ties all the data and
     information together using location and developing its context.
     Objective: It is paramount to build a robust spatial data analytics framework that integrates social, environmental, and
     infrastructural knowledge to empower health researchers’ use of geospatial context to timely answer population health issues.
     The goal is twofold in that it embodies an innovative technological approach and serves to ease the educational burden for health
     researchers to think spatially about their problems.
     Methods: A unique analytical tool using location as the key was developed. It allows integration across source, geography, and
     time to create a geospatial big table with over 162 million individual locations (X-Y points that serve as rows) and 5549 attributes
     (represented as columns). The concept of context (adjacency, proximity, distance, etc) is quantified through geoanalytics and
     captured as new distance, density, or neighbor attributes within the system. Development of geospatial analytics permits contextual
     extraction and investigator-initiated eHealth and mobile health (mHealth) analysis across multiple attributes.
     Results: We built a unique geospatial big data ecosystem called GeoARK. Analytics on this big table occur across resolution
     groups, sources, and geographies for extraction and analysis of information to gain new insights. Case studies, including telehealth
     assessment in North Carolina, national income inequality and health outcome disparity, and a Missouri COVID-19 risk assessment,
     demonstrate the capability to support robust and efficient geospatial understanding of a wide spectrum of population health
     questions.
     Conclusions: This research identified, compiled, transformed, standardized, and integrated multifaceted data required to better
     understand the context of health events within a large location-enabled database. The GeoARK system empowers health
     professionals to engage more complex research where the synergisms of health and geospatial information will be robustly studied
     beyond what could be accomplished today. No longer is the need to know how to perform geospatial processing an impediment
     to the health researcher, but rather the development of how to think spatially becomes the greater challenge.

     (JMIR Med Inform 2022;10(4):e35073) doi: 10.2196/35073

     KEYWORDS
     context; Geographic Information System; big data; equity; population health; public health; digital health; eHealth; location;
     geospatial; data analytics; analytical framework; medical informatics; research knowledgebase
     https://medinform.jmir.org/2022/4/e35073                                                          JMIR Med Inform 2022 | vol. 10 | iss. 4 | e35073 | p. 1
                                                                                                                   (page number not for citation purposes)
XSL• FO
RenderX
JMIR MEDICAL INFORMATICS                                                                                                        Haithcoat et al

                                                                           geographies. Moreover, many health researchers “don’t know
     Introduction                                                          what they don’t know” with regard to geospatial data. The ability
     Health researchers need integrated social, environmental, and         to create new hypotheses is missed if researchers are not aware
     infrastructural information to extend the scope of health care        of the availability of data or the types of questions that could
     and address the complex questions and contextual relationships        be posed that could further expand their research. More
     surrounding health outcomes. Any given location is associated         importantly, development of contextual relationships among
     with different contexts—physical, biological, environmental,          variables could be discovered through spatial analytics. In
     infrastructural, economic, social, and cultural—all of which can      addition, the quantification of interactions of health,
     affect population health, disease risk, and access to health care.    demographics, infrastructure, and environmental elements in
     Geographic context plays a growing role in connecting                 terms of interplay and synergy remains elusive.
     heterogeneous geoenabled information, especially in health            Needed is a novel analytical framework designed to leverage
     research [1-4]. Spatial context includes elements and interactions    location to create new contextual knowledge and associations
     with both the societal and the physical infrastructures associated    among otherwise disjointed data. This would aid evidence-based
     with an individual’s daily activities. This includes accessibility,   exploration of relationships among layers, discover patterns of
     surrounding natural and built environments, social behaviors,         interaction, and support clinical sampling designs where
     and any related location-specific exposures, understanding that       quantification and location are interwoven. This paper outlines
     these elements change across geographic areas, scales, and time.      a new big data approach to building and evolving such a
     Impactful health research that can be applied to real-world issues    geoenabled health information system. The Geospatial
     and problems must be grounded within the context of place             Analytical Research Knowledgebase (GeoARK) is an
     [5-7]. Location and the location’s context both matter [8-10]!        informatics and data science solution that uses advanced
     The strategic transformation of population health, epidemiology,      complex contextual queries across multiresolution locational
     and eHealth studies require vast amounts of integrated digital        information to geoenable health research.
     data to create understanding that can then support decisions          The objective of GeoARK is to transform attitudes and empower
     [11]. Questions asked today are more complex than ever before,        health research where real-world problems are examined in
     implicitly tied to understanding context [12-18]. Health              geoenabled context. We can gain efficiencies through integrated
     researchers have used the Geographic Information System (GIS)         heterogeneous public information sources and the establishment
     to identify, mitigate, and address a myriad of factors affecting      of context through geospatial measures, such as proximity,
     health disparities [19-22], health assessments [23-26],               adjacency, network analysis, and spatial analysis. These then
     health-environment interactions [27-32], health-cultural              form a new complex of attributes within a single geoenabled
     interactions [33-35], and health service access [36-42]. GIS          knowledgebase. It can support a broad spectrum of health
     analysis is expanding within health analysis, but its use is often    research, including health disparities, telemedicine,
     focused on thematic single-variable maps and their visualization      communicable disease management, zoonotic disease
     [43-45]. Medical researchers who study health disparities tend        surveillance, environmental health, and health access policy
     to focus on demographic, social, or economic variables from           making. It enables eHealth researchers to bring their own
     local to national levels, both cross-sectional and over time, that    collection of eHealth or mobile health (mHealth) events and
     are available from the decennial census or the American               have user-selected attribute data compiled at those points or
     Community Survey (ACS). Although there are exceptions [46],           output artificial intelligence/machine learning (AI/ML)-friendly
     far fewer use variables related to the natural, physical, or built    databases for further analysis. The contextualization of existing
     environment, primarily because they are more challenging to           research would enhance the scope of that research.
     obtain.
     Although advancement is evident in the various web-mapping            Methods
     sites across the federal health realm (the Centers for Disease
     Control [CDC] and Prevention’s Heart Disease and Stroke Maps,
                                                                           GeoARK Design
     the National Institutes of Health [NIH] and National Cancer           This paper describes GeoARK and its potential to greatly extend
     Institute’s Cancer Atlas and state profiles, and the Environmental    eHealth research. It outlines how the system was designed and
     Protection Agency’s [EPA] EnviroAtlas), several issues persist.       demonstrates how its design leads to its potential within health
     Although integrated information sources available for                 research. The GeoARK system (Figure 1) comprises multiple
     researchers are growing [47-49], they each portray only a             components that interact to form a complete process for the
     specific view of that entity’s mandated purview. Most provide         integration, documentation, and spatial registration of data into
     visualization of singular attributes at a time and rely on the user   a single queryable big table that we call GeoARK-Big Table
     to mentally synthesize these pieces of information to generate        (GeoARK-BT) in this paper. It can be used by health researchers
     understanding. It remains a challenge for health researchers to       to accelerate the use of spatial data and exploit local context
     locate and evaluate what specific attributes exist and at what        within analyses.

     https://medinform.jmir.org/2022/4/e35073                                                       JMIR Med Inform 2022 | vol. 10 | iss. 4 | e35073 | p. 2
                                                                                                                (page number not for citation purposes)
XSL• FO
RenderX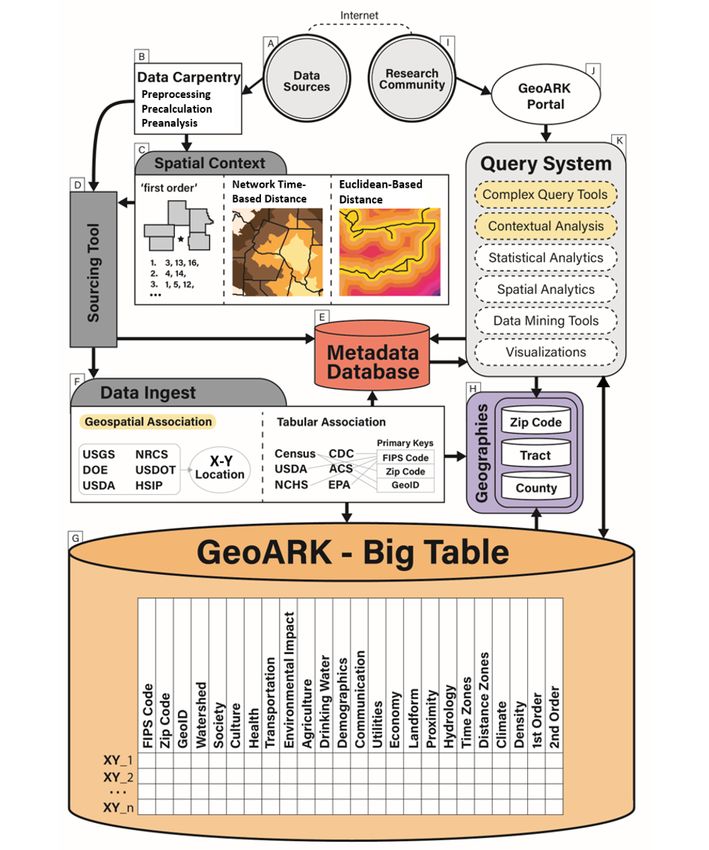
JMIR MEDICAL INFORMATICS                                                                                                         Haithcoat et al

     Figure 1. Geospatial Analytical Research Knowledgebase (GeoARK) System design.

     The actual spatial framework of GeoARK-BT is based on a               units form a coherent framework for cataloging data over
     dense distribution of points across the United States. The spatial    geographical space. The point locations create the sampling
     base is a hexagon tessellation of points blanketing the United        framework through which GeoARK captures and encodes the
     States at a spacing of 161 m (1/10th of a mile, or 528 ft).           locational variability that exists across the databases integrated.
     Centroids of census blocks with an area less than 67,261 m2           For the United States, there are 162 million points with basic
     (16.6 acres) are integrated into the tessellation to better capture   information (5549 attributes) in our current system. Each point
     features in more densely populated areas. Proximal polygons           is a row, with all attributes associated with that location
     are calculated for each point that allows for area totals as well     becoming columns in the database, while each attribute is a
     as aggregation into user-specified geographies to occur. These        column with 162 million rows, with each element of the column

     https://medinform.jmir.org/2022/4/e35073                                                        JMIR Med Inform 2022 | vol. 10 | iss. 4 | e35073 | p. 3
                                                                                                                 (page number not for citation purposes)
XSL• FO
RenderX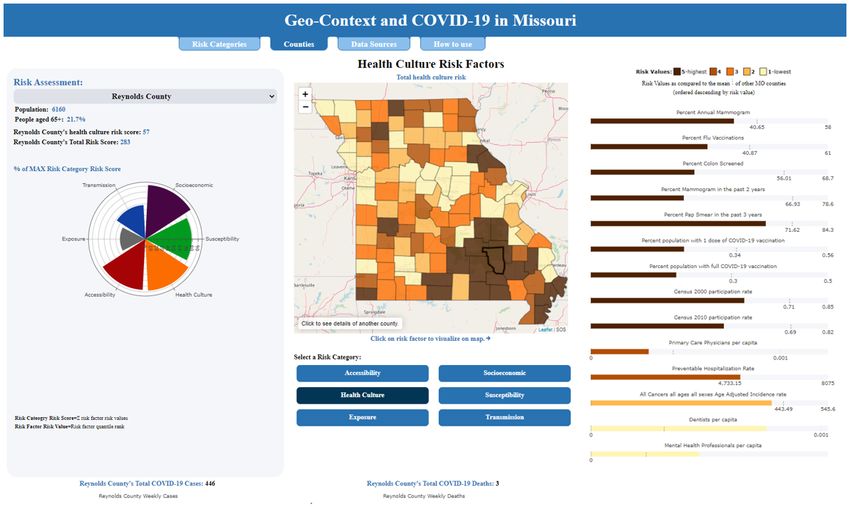
JMIR MEDICAL INFORMATICS                                                                                                          Haithcoat et al

     representing a specific location’s attribute. The points are stored    density per km2), we can then tally the points and their areas
     in a Hadoop Distributed File System (HDFS). The total size is          that are within the area of interest or meet a selection criterion,
     12.5 TB. The data loading process for all 5549 attributes across       and derive estimated values for these attributes. This can be
     the 50 states took 2585 min using a Dell PowerEdge                     accomplished without the need for standard spatial layer
     R740xdcompute node with a dual Intel(R) Xeon(R) Gold 6138              intersection procedures where calculation of crossing vectors
     CPU (80 cores) and 384 GB memory.                                      is required. The process is simply a point in polygon selection.
     Data Sourcing and Metadata                                             This process allows GeoARK great flexibility in context
                                                                            quantification for applied digital health research.
     The GeoARK system integrates interdisciplinary public data
     existing in a wide variety of formats (tabular, raster, point, line,   Tabular data linkage was obtained by a common attribute. Each
     and polygon). This increases the efficiency of research since          GeoARK-BT point has been identified as being within a specific
     many data elements and sources are challenging for researchers         Census 2010 block, Census 2020 block, 5-digit zip code, and
     to compile and uniformly integrate for analysis. The                   specific watershed code. Any data sharing a common key could
     GeoARK-BT includes demographic, social, economic,                      then be added. Data collected at a native geographic level, such
     educational, cultural, infrastructure, and environmental attributes    as county, zip code, or tract, are loaded directly. For information
     from a growing variety of sources, as listed in Multimedia             cataloged at finer units such as block groups and blocks, the
     Appendix 1.                                                            associated data are loaded into the GeoARK-BT using the
                                                                            appropriate census link for each point. Scripts for ingestion to,
     A sourcing tool was developed to standardize the collection,           or update of, the GeoARK-BT for recurring data sources (ie,
     documentation, and logging of each data source being added             ACS updates) include extract, transform, and load processes
     into the GeoARK-BT collection to ensure data quality and               for these sources. The data are synced with the GeoARK system
     integrity for long-term tracking and maintenance. Once a data          to add new, updated, or changed elements.
     source is identified, it is added to the GeoARK source table and
     then data set information is collected and compiled into the data      For geospatial data, linkage was obtained by the X-Y location.
     set descriptive listing (ie, data use agreements, constraints,         Line-based spatial data, such as road networks, and point-based
     URLs). The metadata database then catalogs and records                 data, such as hospitals, nursing homes, and public health clinics,
     individual attribute information from these data sets. The             have been integrated within the GeoARK-BT. To do so, these
     metadata database includes sources, metadata (for both data            files needed processing so as to align with the GeoARK points.
     sets and their associated attributes), and attribute links for the     Data that were spatially analyzed for contextual measures
     GeoARK-BT. The NIH’s Findable, Accessible, Interoperable,              (buffers, Euclidean distance, network time, etc) were converted
     Reusable (FAIR) initiative [50] provides a use area for this           into polygon form or a raster representation. These layers were
     metadata. Data added to the big table use the attribute lookup         then associated with each GeoARK-BT point and the travel
     table to set attribute field names. Data sources and attribute         time or distance for the feature assigned. Some data may be
     fields have also been assigned to an International Organization        categorical (ie, land cover or soils) or continuous in nature (ie,
     for Standardization (ISO) 19115 thematic category [51]. Natural        elevation or precipitation), further effecting ease of integration.
     language tags describing each attribute were also added. Once          Such files were directly assessed against the GeoARK-BT
     attributes are loaded, these metadata elements facilitate              proximal polygon representation to generate a series of attributes
     discovery, query, crediting, and reuse, with all metadata fields       that capture the values’ variability at that location for these data
     being searchable using MongoDB Query Language. Once                    types.
     attribute selection is performed by the researcher, and a data
                                                                            Context Measures
     extract is created, a report summarizing the data source
     information for all data elements contained in the selection is        An innovative aspect of GeoARK is that it has precalculated
     generated. This facilitates the methodological aspects of data         spatial context measures for many features. The simplest
     collection and documentation for researchers.                          contextual measure is presence within a geography or gridded
                                                                            cell. In another form, context is represented as proximity
     Data Ingestion                                                         between a location and features of interest (ie, distance from
     Relevant open data sources are ingested to the GeoARK system           the stroke unit). It can also take the form of a distance from a
     as tabular information or as relative geographic locations.            linear object (ie, power lines). Proximity can also be derived
     Although these data independently have great singular value,           from network modeling to obtain measures of remoteness,
     combining these data, using location as the linkage between            isolation, and accessibility (ie, time or distance).
     data sets, is the power of geospatial analysis and the                 Density measures utilize a grid or distance to tally the number
     underpinning for the GeoARK system. Data carpentry and                 of points, total length of lines, etc, to generate per area metrics.
     preprocessing are required for some data sources and elements.         Data such as block-level population, transmission lines,
     Attributes being used as links need to be standardized, and            railroads, confined animal feeding operations, and drinking
     categorical data need to be transformed. In some cases, new            water wells would be cataloged into artificial grids for this
     derived attributes are calculated through aggregation of existing      density mapping.
     attributes. Precalculations of percentages, densities, means,
     quantile breaks, and the results of spatial-based analyses further     Context is also quantified by identifying first- and second-order
     extend the database. By transforming the raw numeric counts            spatial relationships within geographic levels. These can be
     into density measures (ie, population, race, ethnicity, or other       thought of as adjacent neighbors and are identified using spatial

     https://medinform.jmir.org/2022/4/e35073                                                         JMIR Med Inform 2022 | vol. 10 | iss. 4 | e35073 | p. 4
                                                                                                                  (page number not for citation purposes)
XSL• FO
RenderX
JMIR MEDICAL INFORMATICS Haithcoat et al
analytics. For a given county, the first order is all counties attributes can be directly related using relational joins at a
adjacent to this base county. The second order for that same specific geographic level (county, tract, zip code), other
county is all the counties that are adjacent to the first-order attributes such as distance measures, land cover, elevation, and
counties. These attributes quantify geospatial adjacencies that climate need to be aggregated from the GeoARK-BT points to
health researchers can exploit. generate a summary attribute (ie, mean distance to parks) from
these features for any region (Figure 2).
Finally, geographic summary levels that are commonly used in
research and mapping are precompiled. Although many
Figure 2. This example shows how GeoARK point processing based on a single attribute (Distance to Parks) can be used to generate summaries at
various geographic levels. a) Shows GeoARK point layer with parks data superimposed. b) Shows GeoARK points colorized to show distance from
parks inherent in their attribution. c-e) Show dark outlines of tract, zip code, and user defined interest - voting wards (respectively) superimposed on
the colorized GeoARK points and below each is their resulting geographic summary for mean Distance to Parks. GeoARK: Geospatial Analytical
Research Knowledgebase.
factors that can affect disparities also exists [52]. In rural
GeoARK Utility contexts [19,36], aging populations, health care access [12,13],
The collection, integration, and use of diverse data are sparse populations, environmental exposures [14,15,28], and
foundational to answer today’s health problems. Significant infrastructure [20] are proven critical factors. In urban contexts,
disparities exist and can vary across scales from blocks to food-deserts [21], crime density and stress [53], and pollution
neighborhoods to regions [3]. In addition, a complex myriad of (air, water, light, and noise) [16,54] play possible roles. How
https://medinform.jmir.org/2022/4/e35073 JMIR Med Inform 2022 | vol. 10 | iss. 4 | e35073 | p. 5
(page number not for citation purposes)
XSL• FO
RenderXJMIR MEDICAL INFORMATICS Haithcoat et al
do these factors interact? At what scale are these associations targeted spatial analytical research as GeoARK matures. Points
important? Where are these findings located, and are they can be selected based on user-defined areas of interest and then
clustered? aggregated to create a surrogate representation of that area and
used to extract user-selected attributes from GeoARK to create
The proposed web portal will provide tools to enable and
a subset for further analysis. The design leverages a big data
catalyze a health researcher’s ability to move their question into
table where we can have high throughput for data transactions.
the spatial realm and analyze their area of interest against the
broad spectrum of data within the GeoARK-BT. An The 7 query types, listed in Table 1, range from simple attribute
investigator’s area of interest could be an actual physical area selection to queries that utilize the distance to or from a specific
(ie, neighborhood, zip code, place) or a collection of health feature type to those that require network travel time or distance.
events as X-Y coordinate pairs with which to associate GeoARK Others might include multitemporal queries concerning what
attributes. Complex queries can be used to create and refine has changed since a particular event or point in time. Still others
data extracts that focus on a researcher’s question of interest. inquire about features and elements around a particular place
or location and the associations found between those factors.
To support research, flexible access and powerful interrogation
Finally, other queries can be built to determine or assess how
of the GeoARK-BT are required. One of the major strengths of
scale or geographic extent may impact conclusions. Output from
GeoARK is the streamlining of access across data sources and
each of these types of queries can produce AI/ML-ready data
the provision of complex analytic query across multiple
sets leveraging GeoARK’s spatial bins and analytical
timestamps and sources. The query is simply a projection on
associations.
selected columns within the GeoARK-BT using MongoDB.
Indexes were built off-line on each attribute to allow for more There is no equivalent system currently available with which
efficient on-demand retrieval of information. A single-attribute to provide side-by-side analytics. When the times presented are
index takes 623 min to build, and a composite index with 5 compared to the time savings a researcher would obtain through
attributes takes 791 min. Each index, respectively, has, on the system’s integrated and spatially contextualized information,
average, a 0.66 and 1.05 GB memory footprint for a single and they provide great value. In addition, through further testing of
a composite index. Open source analytical tools are to be added indexing schemas and optimization of query and search designs,
to provide further analytical functionality to include descriptive, these times are expected to decrease.
exploratory, inferential, causal, and predictive approaches to
Table 1. Examples of query types and their run times when executed against the national GeoARKa database. These can range from national to local
studies. The first 3 query examples are standard selections based on attribute values or thresholds. The next 3 query examples illustrate the use of the
unique spatial dimensional attributes added through the GeoARK system to provide greater geoanalytical power to selections. The final example
demonstrates GeoARK’s ability to select contextual elements that surround another feature of interest.
Query type Query example Query time (min)
Simple geography Select all records for the state of Missouri, Federal Information Processing Standard (FIPS) code=29. 13.03
Simple variable Select all county records with a nonmetro flag (2013)=1 in Missouri. 5.81
Complex variable Black/African American % of total population of zip code >30% AND % total population in poverty 5.47
>15% AND % households with a single female head of household with children under 18 years of age
receiving food stamps >5%.
Density Select points with a road density greater than 1500 m (4921 ft) per square kilometer. 0.17
Proximity Select points with a distance to closest park greater than 400 m (1312 ft). 0.14
Travel time Select points having 15 min or less travel time to the nearest hospital. 0.07
Contextual Given a cluster of 3 counties with high cancer incidence, compile and extract all surrounding counties’ 1.23
exposome variables associated with those locations.
a
GeoARK: Geospatial Analytical Research Knowledgebase.
outcomes (blue), (2) telehealth program evaluation of both
Results growth and impact on rural health access and equity (green),
Case Studies and (3) the development of COVID-19 risk factor assessments
(orange). These examples demonstrate the GeoARK system’s
Results are presented as 3 case studies (Figure 3) utilizing the utility and practical application in support of health research
GeoARK system. The case studies cover (1) the development questions.
of new uniformity measures providing insight into health
https://medinform.jmir.org/2022/4/e35073 JMIR Med Inform 2022 | vol. 10 | iss. 4 | e35073 | p. 6
(page number not for citation purposes)
XSL• FO
RenderXJMIR MEDICAL INFORMATICS Haithcoat et al
Figure 3. Case study examples of GeoARK attributes, processes, and outcomes. Each case study is given a color. Attributes used in their respective
analyses are likewise color coded. Those attributes derived from spatial analytics are further noted. GeoARK: Geospatial Analytical Research
Knowledgebase.
This case study merged geospatial analytics with big data
Case Study 1: Associations - Gini Index Example - approaches to maximizing the use of the Behavioral Risk Factor
Geography: County and State Surveillance System (BRFSS) [55] and the ACS [56]. This
Complex questions: How do health outcomes relate to study examined the income inequality hypothesis using cluster
geographic clustering of income inequality within the United and outlier spatial analysis [57]. We applied this geospatial
States? Can a new spatial uniformity measure be created to aid approach to create 3 innovative measures that captured
understanding of income inequality? uniformity in income inequality. We examined the ways that
https://medinform.jmir.org/2022/4/e35073 JMIR Med Inform 2022 | vol. 10 | iss. 4 | e35073 | p. 7
(page number not for citation purposes)
XSL• FO
RenderXJMIR MEDICAL INFORMATICS Haithcoat et al
the Gini coefficient and 3 new spatial uniformity measures were Studies of this COVID-19 pandemic require vast amounts of
associated with health outcomes. Specifically, the uniformity integrated data to create understanding that can then support
measures capture the extent to which (1) inequality is uniformly decisions. We utilized GeoARK to extract and create 6 distinct
distributed spatially in states regardless of whether the level is thematic risk assessment databases for Missouri. The risk areas
high or low, (2) the extent to which states are more uniformly assessed included individual susceptibility or risk, potential
high in inequality across space, and (3) the extent to which they transmission or community risk, socioeconomic contextual risk,
are more uniformly low in inequality. We conclude that residents accessibility constraints, health culture risk, and, finally, the
of states that have more uniformly high inequality across space exposure risk based on current case loads of COVID-19 at the
are more likely to report worse outcomes across several health county level. The goal of this project is to support data-driven
measures. This case study showed that geospatial big data decision-making processes across levels of government and
approaches can extend research on public health topics involving health care providers to enable incorporation of significant risk
traditional survey data [58]. This also demonstrated how even factors associated with their specific populations and potential
1 variable (in this case the Gini index), when spatially analyzed, synergies and enable preparation for resilience and mitigation
can create new and useful insights into health investigations efforts across rural counties.
and their interpretation.
The GeoARK data extraction and build for these risk databases
Case Study 2: Health Equity - Telemedicine Program included a selection of 325 (5.91%) elements from the current
Reach - Geography (Zip Code Tabulation Areas) catalogue of 5500, integrating 35 different sources. A subset
(total of 91 [28%] across all 6 areas) were then selected for use
Complex questions: Who and where are the most vulnerable
in the calculation of total risk scores for each assessment area.
populations in terms of social inequity? Does the telehealth
More specifically, components included known and possible
program address these vulnerable populations?
comorbidities and age breaks; commuting, migration, worker
Utilizing aggregated telehealth use data, this case study types, group gatherings, and living situation; race, ethnicity,
evaluated a telehealth program’s reach, growth, and potential disability, insurance status, veteran status, and education level;
to address equity issues in rural areas. Significant inequities development and inclusion of various hospital, nursing homes,
exist and can vary across scales from blocks to neighborhoods and telehealth access measures; and broadband metrics. Ordinary
to regions [18]. From the occurrence data, the demand for least squares regression was used to evaluate combinations of
receiving care via the program steadily increased over the 4 explanatory variables. Selected variables within each risk
quarters, especially in rural areas. Three geospatially based category then had quintiles calculated to create comparative
health measures were created to assess and describe context: categorical groups for each risk variable, with higher values
the social inequity score, the access inequity score, and a assigned to worse risk. Cumulative risk scores were assembled
combined inequity score. In total, 11 measures, including social for each risk category, as well as an overall composite risk score.
determinants (n=7, 64%) and access measures (n=4, 36%), were These values were then analyzed using Local Moran’s I,
compiled from 5 sources and tabulated at the zip code level. similarity analysis, and spatially constrained multivariate
GeoARK permits selection of both social elements and clustering to inform regional grouping outcomes. Through
infrastructure-related accessibility elements. The social elements spatial analytics, differences in both the magnitude of risk and
were pulled from multiple census sources, while the accessibility the substance of that risk, among and between rural and urban
measures were created through geoanalytics and compiled into counties, were found. Missouri’s spatial diversity is evident in
zip code boundaries for comparison. To assess the overall the variability of overall risk across the 6 factor areas developed
context of the delineated reach of the program, a mean combined as well as the 6 region-based groups of counties sharing similar
inequity score was calculated for each zip code and for all zip risk traits. The results are queryable through the Geo-Context
codes. In zip codes where telemedicine encounters occurred, and COVID-19 website (Figure 4) [59].
the population served had higher levels of social inequity and
These research results enhance the understanding of COVID-19
lower access in comparison to both state and rural levels. This
behavior and enable preparation for resilience in rural
telehealth program assessment of health inequity and access in
populations. It is important to understand the context and
rural regions demonstrated the program’s promising reach to
interrelationships of various risk factors occurring within the
vulnerable populations, as associated with the social and
state in order to better understand the potential pathways for
accessibility factors measured. These results supported
disease as well as what nuances in mitigation strategies are
maintaining and continued development of policies for
needed to address specific populations. There is no 1-size-fits-all
affordable and on-demand telemedicine programs for providing
solution for the diversity found through spatial analysis of risk.
care to rural populations facing inequities [26].
The ability to address issues that are most influencing the health
Case Study 3: Population Health - COVID-19 Risk - of a particular region or population is paramount to equality in
Geography (County) care.
Complex questions: What are the magnitudes of select risk
factors, and where are they most prevalent in Missouri? What
are the areas of compounded impacts, and do they cluster?
https://medinform.jmir.org/2022/4/e35073 JMIR Med Inform 2022 | vol. 10 | iss. 4 | e35073 | p. 8
(page number not for citation purposes)
XSL• FO
RenderXJMIR MEDICAL INFORMATICS Haithcoat et al
Figure 4. Screen capture of the "Geo-Context and COVID-19 in Missouri" dashboard interface populated with GeoARK parameters. GeoARK:
Geospatial Analytical Research Knowledgebase.
of eHealth events. It is critically important that health research
Discussion be buoyed with access to the GeoARK system as it decreases
Principal Findings duplication of effort, allows comparisons across a much broader
set of potential variables, and extends the breadth and scope of
There are unique innovations interwoven within the design of investigations beyond the boundaries of conventional variable
the GeoARK system. It has taken the multilayered world of thematic mapping.
typical GIS analysis and flattened it. The incorporation at each
location of keys (ie, geographic-level Federal Information The linkage of results to a specific geographic scale, and the
Processing Standard [FIPS] code, zip code) creates bridges for concurrent interpretation of them in context, is a growing
associated attribution to be incorporated into the GeoARK-BT. requirement of sociological and health research. Because the
Other information is integrated through geospatial location, GeoARK system has precalculated and captured the
leveraging the fact that the information occupies the same distance-based relationships of neighbors, features, and other
location on the earth’s surface. For each point, the various scales, spatial context, the project will aid researchers in development
resolutions, information, and accuracies are captured as of comparable populations at varying scales. This could be
associated attributes of the particular data ingested. Through within a certain aspect of interest (rural-urban) or geography
the integrated data services and analytical tools of this project, (county, zip code, or tract).
complex queries can be posed and associations explored. This A focus of potential benefit will be the use of the GeoARK
is enabled only when spatial contexts have been quantified and system in research design. Meaningful health analytics typically
thousands of factors associated spatially. address developing and testing hypotheses to contrast and
The enhanced analytics can provide a catalyst for health compare 1 group (reference) to another (comparison). The ability
researchers to move beyond basic thematic mapping. In many, to “know” and possibly choose to control for “outside” variables
if not most, cases, the true benefit of using location is in the (eg, environmental, social, cultural, infrastructure, or other
creation of new associations between data elements and factors) during the design of a study or trial may provide a
subsequent creation of new information. The generation of this clearer picture of the health aspect under investigation. The
new quantified, tabular information is the real power of ability to tighten the research question or clinical trial, and its
geospatial information and GeoARK. reference groups, leads to higher potential to achieve significant
insights.
Benefits and Opportunities
The GeoARK system facilitates the use and integration of
Challenges and Limitations
geoinformatics within the broad health-based user community. The patient protections provided through the implementation
There is a high level of effort and expertise required to locate, and interpretation of the Health Insurance Portability and
compile, transform, standardize, and then integrate the Accountability Act of 1996 (HIPAA) impacts the geographic
multifaceted data required to adequately understand the context scales at which we can investigate the detailed distributions of
https://medinform.jmir.org/2022/4/e35073 JMIR Med Inform 2022 | vol. 10 | iss. 4 | e35073 | p. 9
(page number not for citation purposes)
XSL• FO
RenderXJMIR MEDICAL INFORMATICS Haithcoat et al
disease and health effects. Although all disease occurs as events, However, the biggest challenge remaining for health researchers
the way in which aggregation, compilation, and subsequent is to learn to think spatially about their problems and broaden
roll-up of these events into geographies has a dampening effect their research questions into the multifactor, multiscale arenas
on most, if not all, attempts to drill deeper into the spatial of investigation that the GeoARK system supports.
context and phenomenology of diseases.
Conclusion
Variability and uncertainty exist within all data collected by This paper describes and outlines the design, compilation, and
organizations as it was in the pursuit of a mandated purpose. assembly of the GeoARK system, a spatially referenced data
Biases, ethical issues, and errors complicate the systematic table that facilitates the integration and standardization of
integration of heterogeneous information into any database. By sociocultural, infrastructural, environmental, and health-related
using location, it is hoped that these biases and other issues will data into a common, extractable, and analytical framework.
be more clearly brought to light.
The GeoARK system provides the ability to identify, mitigate,
The modifiable areal unit problem has the potential to create and contextualize health disparities. It provides health
problems with representation of certain types of data. By researchers with an integrated big data repository that can be
assembling these data across a variety of raster resolutions, the searched to enable stronger research designs, for example,
scales of representation can be tested and understood so that develop sampling/surveillance approaches or clinical trial focus.
use of these data at any scale would be accompanied by a Using context across a broad range of data, research topics
“fitness of use” measure that can be presented to the user. surrounding avoidance, fairness, equity, justice, and
Because a range of geographies is captured upon integration acceptability within, or for, a given location can be pursued.
within the design of GeoARK, these comparisons can also be GeoARK supports user-based query, contextual analysis, and
tested for stability and significance across a range of scales. visualization to investigate relationships among the integrated
This allows researchers to evaluate at what level the component data layers as well as discover patterns of interest for health
of interest manifests itself and therefore permit identification research.
of the proper level for intervention (as well as what determinants
are amenable to this process) or information that can be used There are myriad ways that the GeoARK system, as a service,
for avoidance of a particular type of disparity in a particular can be used in future analyses in order to better understand
area. health disparities and other research issues. This system enables
researchers to draw deeper and more broadly applicable
The evolution of the GeoARK-BT to the fully envisioned system empirical evidence for health research and associated outcomes,
as a web-based portal with robust data and research services as well as supporting AI/ML-friendly data extracts that can then
has many hurdles to overcome. These include data usage leverage new spatial associations.
agreements, compute scaling, cloud service strategy,
data-as-a-service management strategy, security and compliance This framework provides benefit to eHealth-related research,
adjustments, performance tuning, build out of analytics, and applications, and policy evaluation by the broader health
cost constraints. community and has the potential to transform health research
from a layer-based mentality to an interactive integrated
contextual knowledge platform.
Acknowledgments
The authors thank Katrina Boles, Kao Yang, Sam Spell, and Rebecca Shyu at the University of Missouri for their support and
assistance with initial development phases. We also acknowledge our case study collaborators, Dr Saif Khairat, Dr Eileen Avery,
and Dr Richard Hammer, for their research utilizing the Geospatial Analytical Research Knowledgebase (GeoARK) system and
providing feedback on the development and usability of the system.
TH was supported by the National Institutes of Health (NIH-5T32LM012410). CRS was supported by the National Science
Foundation (NSF) Division Information and Intelligent Systems (Award IIS-2027891) and the University of Missouri System
Research and Creative Works Strategic Investment Program. The cyber infrastructure hosting the geospatial big table was supported
in part by the NSF Computer and Network Systems (CNS-1429294). This paper’s content is solely the responsibility of the
authors and does not represent the official views of the NIH or the NSF.
Data Availability
The data underlying this paper will be shared through the Geospatial Analytical Research Knowledgebase (GeoARK) service.
Questions can be sent to the corresponding author.
Authors' Contributions
TH and CRS designed the Geospatial Analytical Research Knowledgebase (GeoARK) system and contributed to the design and
conduct of the case studies. TH led the writing of the manuscript. DL implemented and indexed NoSQL databases, performed
https://medinform.jmir.org/2022/4/e35073 JMIR Med Inform 2022 | vol. 10 | iss. 4 | e35073 | p. 10
(page number not for citation purposes)
XSL• FO
RenderXJMIR MEDICAL INFORMATICS Haithcoat et al
data loads, and assessed query efficiencies. TY provided support and assistance with metadata processes and web portal interface
development. CRS oversaw the project and obtained research funding.
Conflicts of Interest
None declared.
Multimedia Appendix 1
Supplementary File providing 3 pages of both the tabular data source listing and the geospatial source listing of files integrated
or being integrated into the GeoARK-BT and available through the GeoARK system for support of complex queries and data
selection in support of the health research community. GeoARK: Geospatial Analytical Research Knowledgebase; GeoARK-BT:
GeoARK-Big Table.
[PDF File (Adobe PDF File), 841 KB-Multimedia Appendix 1]
References
1. Sun W, Gong F, Xu J. Individual and contextual correlates of cardiovascular diseases among adults in the United States:
a geospatial and multilevel analysis. GeoJournal 2019 Jul 25;85(6):1685-1700. [doi: 10.1007/s10708-019-10049-7]
2. Robles B, Thomas CS, Lai ES, Kuo T. A geospatial analysis of health, mental health, and stressful community contexts in
Los Angeles County. Prev Chronic Dis 2019 Nov 07;16:E150 [FREE Full text] [doi: 10.5888/pcd16.190138] [Medline:
31701869]
3. Graham H. Social determinants and their unequal distribution: clarifying policy understandings. Milbank Q 2004
Mar;82(1):101-124 [FREE Full text] [doi: 10.1111/j.0887-378x.2004.00303.x] [Medline: 15016245]
4. Richardson DB, Volkow ND, Kwan M, Kaplan RM, Goodchild MF, Croyle RT. Medicine. Spatial turn in health research.
Science 2013 Mar 22;339(6126):1390-1392 [FREE Full text] [doi: 10.1126/science.1232257] [Medline: 23520099]
5. Wong MS, Ho HC, Tse A. Geospatial context of social and environmental factors associated with health risk during
temperature extremes: review and discussion. Geospat Health 2020 Jun 22;15(1):168-173 [FREE Full text] [doi:
10.4081/gh.2020.814] [Medline: 32575974]
6. Phillips IG, McCuskey DJ, Felt D, Raman AB, Hayford CS, Pickett J, et al. Geospatial perspectives on health: the PrEP4Love
campaign and the role of local context in health promotion messaging. Soc Sci Med 2020 Nov;265:113497 [FREE Full
text] [doi: 10.1016/j.socscimed.2020.113497] [Medline: 33187750]
7. Eberhardt MS, Pamuk ER. The importance of place of residence: examining health in rural and nonrural areas. Am J Public
Health 2004 Oct;94(10):1682-1686. [doi: 10.2105/ajph.94.10.1682] [Medline: 15451731]
8. LaVeist T, Pollack K, Thorpe R, Fesahazion R, Gaskin D. Place, not race: disparities dissipate in southwest Baltimore
when blacks and whites live under similar conditions. Health Aff (Millwood) 2011 Oct;30(10):1880-1887 [FREE Full text]
[doi: 10.1377/hlthaff.2011.0640] [Medline: 21976330]
9. Arcaya MC, Tucker-Seeley RD, Kim R, Schnake-Mahl A, So M, Subramanian S. Research on neighborhood effects on
health in the United States: a systematic review of study characteristics. Soc Sci Med 2016 Nov;168:16-29 [FREE Full
text] [doi: 10.1016/j.socscimed.2016.08.047] [Medline: 27637089]
10. Scribner RA, Simonsen NR, Leonardi C. The social determinants of health core: taking a place-based approach. Am J Prev
Med 2017 Jan;52(1S1):S13-S19 [FREE Full text] [doi: 10.1016/j.amepre.2016.09.025] [Medline: 27989288]
11. Estima J, Painho M. User generated spatial content-integrator: conceptual model to integrate data from diverse sources of
user generated spatial content. IJGI 2016 Oct 09;5(10):183. [doi: 10.3390/ijgi5100183]
12. Wong ST, Regan S. Patient perspectives on primary health care in rural communities: effects of geography on access,
continuity and efficiency. RRH 2009 Mar 18;9(1):1142. [doi: 10.22605/rrh1142]
13. Bissonnette L, Wilson K, Bell S, Shah TI. Neighbourhoods and potential access to health care: the role of spatial and aspatial
factors. Health Place 2012 Jul;18(4):841-853 [FREE Full text] [doi: 10.1016/j.healthplace.2012.03.007] [Medline: 22503565]
14. Stingone JA, Buck Louis GM, Nakayama SF, Vermeulen RC, Kwok RK, Cui Y, et al. Toward greater implementation of
the exposome research paradigm within environmental epidemiology. Annu Rev Public Health 2017 Mar 20;38(1):315-327
[FREE Full text] [doi: 10.1146/annurev-publhealth-082516-012750] [Medline: 28125387]
15. Guthman J, Mansfield B. The implications of environmental epigenetics: a new direction for geographic inquiry on health,
space, and nature-society relations. Prog Hum Geogr 2012 Nov 26;37(4):486-504. [doi: 10.1177/0309132512463258]
16. Keet CA, McCormack MC, Pollack CE, Peng RD, McGowan E, Matsui EC. Neighborhood poverty, urban residence,
race/ethnicity, and asthma: rethinking the inner-city asthma epidemic. J Allergy Clin Immunol 2015 Mar;135(3):655-662
[FREE Full text] [doi: 10.1016/j.jaci.2014.11.022] [Medline: 25617226]
17. Greenough PG, Nelson EL. Beyond mapping: a case for geospatial analytics in humanitarian health. Confl Health 2019
Nov 08;13(1):50 [FREE Full text] [doi: 10.1186/s13031-019-0234-9] [Medline: 31719842]
18. Towne SD. Socioeconomic, geospatial, and geopolitical disparities in access to health care in the US 2011-2015. Int J
Environ Res Public Health 2017 May 29;14(6):573 [FREE Full text] [doi: 10.3390/ijerph14060573] [Medline: 28555045]
https://medinform.jmir.org/2022/4/e35073 JMIR Med Inform 2022 | vol. 10 | iss. 4 | e35073 | p. 11
(page number not for citation purposes)
XSL• FO
RenderXJMIR MEDICAL INFORMATICS Haithcoat et al
19. Downey LH. Rural populations and health: determinants, disparities, and solutions. Prev Chronic Dis 2013 Jun 27;10:E104.
[doi: 10.5888/pcd10.130097]
20. Marcin JP, Shaikh U, Steinhorn RH. Addressing health disparities in rural communities using telehealth. Pediatr Res 2016
Jan 14;79(1-2):169-176 [FREE Full text] [doi: 10.1038/pr.2015.192] [Medline: 26466080]
21. Cannuscio CC, Weiss EE, Asch DA. The contribution of urban foodways to health disparities. J Urban Health 2010 May
31;87(3):381-393 [FREE Full text] [doi: 10.1007/s11524-010-9441-9] [Medline: 20354910]
22. Turner N, Pan W, Martinez-Bianchi V, Panayotti G, Planey A, Woods C, et al. Racial, ethnic, and geographic disparities
in novel coronavirus (severe acute respiratory syndrome coronavirus 2) test positivity in North Carolina. Open Forum Infect
Dis 2021 Jan;8(1):ofaa413 [FREE Full text] [doi: 10.1093/ofid/ofaa413] [Medline: 33575416]
23. Shakoor H, Jehan N, Khan S, Khattak NU. Investigation of radon sources, health hazard and risks assessment for children
using analytical and geospatial techniques in District Bannu (Pakistan). Int J Radiat Biol 2021 Mar 15:1-9. [doi:
10.1080/09553002.2021.1872817] [Medline: 33428859]
24. Long X, Liu F, Zhou X, Pi J, Yin W, Li F, et al. Estimation of spatial distribution and health risk by arsenic and heavy
metals in shallow groundwater around Dongting Lake plain using GIS mapping. Chemosphere 2021 May;269:128698.
[doi: 10.1016/j.chemosphere.2020.128698] [Medline: 33121802]
25. Adimalla N, Qian H. Geospatial distribution and potential noncarcinogenic health risk assessment of nitrate contaminated
groundwater in southern India: a case study. Arch Environ Contam Toxicol 2020 Oct 03;80(1):107-119. [doi:
10.1007/s00244-020-00762-7]
26. Khairat S, Haithcoat T, Liu S, Zaman T, Edson B, Gianforcaro R, et al. Advancing health equity and access using
telemedicine: a geospatial assessment. J Am Med Inform Assoc 2019 Aug 01;26(8-9):796-805 [FREE Full text] [doi:
10.1093/jamia/ocz108] [Medline: 31340022]
27. Downey L, Van Willigen M. Environmental stressors: the mental health impacts of living near industrial activity. J Health
Soc Behav 2005 Oct 24;46(3):289-305 [FREE Full text] [doi: 10.1177/002214650504600306] [Medline: 16259150]
28. Shrestha R, Flacke J, Martinez J, van Maarseveen M. Environmental health related socio-spatial inequalities: identifying
"hotspots" of environmental burdens and social vulnerability. Int J Environ Res Public Health 2016 Jul 09;13(7):691 [FREE
Full text] [doi: 10.3390/ijerph13070691] [Medline: 27409625]
29. Wilhelm M, Qian L, Ritz B. Outdoor air pollution, family and neighborhood environment, and asthma in LA FANS children.
Health Place 2009 Mar;15(1):25-36 [FREE Full text] [doi: 10.1016/j.healthplace.2008.02.002] [Medline: 18373944]
30. Jerrett M, Burnett RT, Beckerman BS, Turner MC, Krewski D, Thurston G, et al. Spatial analysis of air pollution and
mortality in California. Am J Respir Crit Care Med 2013 Sep;188(5):593-599. [doi: 10.1164/rccm.201303-0609oc]
31. Ruiz MO, Tedesco C, McTighe TJ, Austin C, Kitron U. Environmental and social determinants of human risk during a
West Nile virus outbreak in the Greater Chicago area. Int J Health Geogr 2002;3(1):8. [doi: 10.1186/1476-072x-3-8]
32. Pearce J, Richardson E, Mitchell R, Shortt N. Environmental justice and health: the implications of the socio-spatial
distribution of multiple environmental deprivation for health inequalities in the United Kingdom. Trans Inst Br Geogr
2010;35(4):522-539. [doi: 10.1111/j.1475-5661.2010.00399.x]
33. Pearce J, Cherrie M, Shortt N, Deary I, Ward Thompson C. Life course of place: a longitudinal study of mental health and
place. Trans Inst Br Geogr 2018 May 02;43(4):555-572. [doi: 10.1111/tran.12246]
34. Shortt NK, Rind E, Pearce J, Mitchell R, Curtis S. Alcohol risk environments, vulnerability and social inequalities in alcohol
consumption. Ann Am Assoc Geogr 2018 Mar 21;108(5):1210-1227 [FREE Full text] [doi: 10.1080/24694452.2018.1431105]
[Medline: 32154488]
35. Johnston R, Poulsen M, Forrest J. Research note—measuring ethnic residential segregation: putting some more geography
in. Urban Geogr 2013 May 16;30(1):91-109. [doi: 10.2747/0272-3638.30.1.91]
36. Bull CN, Krout JA, Rathbone-McCuan E, Shreffler MJ. Access and issues of equity in remote/rural areas. J Rural Health
2001 Sep;17(4):356-359. [doi: 10.1111/j.1748-0361.2001.tb00288.x] [Medline: 12071561]
37. Luo W, Qi Y. An enhanced two-step floating catchment area (E2SFCA) method for measuring spatial accessibility to
primary care physicians. Health Place 2009 Dec;15(4):1100-1107. [doi: 10.1016/j.healthplace.2009.06.002] [Medline:
19576837]
38. Amstislavski P, Matthews A, Sheffield S, Maroko AR, Weedon J. Medication deserts: survey of neighborhood disparities
in availability of prescription medications. Int J Health Geogr 2012;11(1):48. [doi: 10.1186/1476-072x-11-48]
39. Chakraborty J, Maantay J. Proximity analysis for exposure assessment in environmental health justice research. In: Maantay
JA, McLafferty S, editors. Geospatial Analysis of Environmental Health. The Netherlands: Springer; 2011:111-138.
40. Lynch SM, Wiese D, Ortiz A, Sorice KA, Nguyen M, González ET, et al. Towards precision public health: geospatial
analytics and sensitivity/specificity assessments to inform liver cancer prevention. SSM Popul Health 2020 Dec;12:100640
[FREE Full text] [doi: 10.1016/j.ssmph.2020.100640] [Medline: 32885020]
41. Gilliland JA, Shah TI, Clark A, Sibbald S, Seabrook JA. A geospatial approach to understanding inequalities in accessibility
to primary care among vulnerable populations. PLoS One 2019 Jan 7;14(1):e0210113 [FREE Full text] [doi:
10.1371/journal.pone.0210113] [Medline: 30615678]
42. Planey AM. Audiologist availability and supply in the United States: a multi-scale spatial and political economic analysis.
Soc Sci Med 2019 Feb;222:216-224. [doi: 10.1016/j.socscimed.2019.01.015] [Medline: 30660682]
https://medinform.jmir.org/2022/4/e35073 JMIR Med Inform 2022 | vol. 10 | iss. 4 | e35073 | p. 12
(page number not for citation purposes)
XSL• FO
RenderXJMIR MEDICAL INFORMATICS Haithcoat et al
43. Biggeri A, Barbone F, Lagazio C, Bovenzi M, Stanta G. Air pollution and lung cancer in Trieste, Italy: spatial analysis of
risk as a function of distance from sources. Environ Health Perspect 1996 Jul;104(7):750-754 [FREE Full text] [doi:
10.1289/ehp.96104750] [Medline: 8841761]
44. Schuurman N, Peters PA, Oliver LN. Are obesity and physical activity clustered? A spatial analysis linked to residential
density. Obesity (Silver Spring) 2009 Dec;17(12):2202-2209 [FREE Full text] [doi: 10.1038/oby.2009.119] [Medline:
19390521]
45. Chandra S, Kassens-Noor E, Kuljanin G, Vertalka J. A geographic analysis of population density thresholds in the influenza
pandemic of 1918–19. Int J Health Geogr 2013;12(1):9. [doi: 10.1186/1476-072x-12-9]
46. Mizen A, Fry R, Rodgers S. GIS-modelled built-environment exposures reflecting daily mobility for applications in child
health research. Int J Health Geogr 2020 Apr 10;19(1):12 [FREE Full text] [doi: 10.1186/s12942-020-00208-2] [Medline:
32276644]
47. Centers for Disease Control and Prevention. Interactive Atlas of Heart Disease and Stroke. URL: http://nccd.cdc.gov/
DHDSPAtlas [accessed 2022-03-31]
48. United States Geological Survey. The National Map. URL: https://www.usgs.gov/core-science-systems/
national-geospatial-program/national-map [accessed 2022-03-31]
49. United States Department of Agriculture. Atlas of Rural and Small-Town America. URL: https://www.ers.usda.gov/
data-products/atlas-of-rural-and-small-town-america/ [accessed 2022-03-31]
50. Wilkinson MD, Dumontier M, Aalbersberg IJ, Appleton G, Axton M, Baak A, et al. The FAIR Guiding Principles for
scientific data management and stewardship. Sci Data 2016 Mar 15;3(1):160018 [FREE Full text] [doi: 10.1038/sdata.2016.18]
[Medline: 26978244]
51. Danko D. ISO/TC211: geographic information – metadata ISO 19115. In: Moellering H, Aalders HJGL, Crane A, editors.
World Spatial Metadata Standards. Oxford: Elsevier Science; 2005:535-555.
52. Bambra C, Gibson M, Sowden A, Wright K, Whitehead M, Petticrew M. Tackling the wider social determinants of health
and health inequalities: evidence from systematic reviews. J Epidemiol Community Health 2010 May 19;64(4):284-291
[FREE Full text] [doi: 10.1136/jech.2008.082743] [Medline: 19692738]
53. Egerter S, Barclay C, Grossman-Kahn R, Braveman P. Exploring the social determinants of health. Violence, Social
Disadvantage and Health, Robert Wood Johnson Foundation. In: The Foundation for Vulnerable Population’s. NJ: Princeton;
2011:1-9.
54. Kyle AD, Woodruff TJ, Buffler PA, Davis DL. Use of an index to reflect the aggregate burden of long-term exposure to
criteria air pollutants in the United States. Environ Health Perspect 2002 Mar;110 Suppl 1(suppl 1):95-102 [FREE Full
text] [doi: 10.1289/ehp.02110s195] [Medline: 11834467]
55. Centers for Disease Control and Prevention. Behavioral Risk Factor Surveillance System Survey Data. URL: https://www.
cdc.gov/brfss/data_documentation/index.htm [accessed 2022-03-30]
56. United States Census Bureau. Explore Census Data. URL: https://data.census.gov/cedsci/ [accessed 2022-03-31]
57. Anselin L, Sridharan S, Gholston S. Using exploratory spatial data analysis to leverage social indicator databases: the
discovery of interesting patterns. Soc Indic Res 2006 Nov 15;82(2):287-309. [doi: 10.1007/s11205-006-9034-x]
58. Haithcoat TL, Avery EE, Bowers KA, Hammer RD, Shyu C. Income inequality and health: expanding our understanding
of state-level effects by using a geospatial big data approach. Soc Sci Comput Rev 2019 Sep 03;39(4):543-561. [doi:
10.1177/0894439319872991]
59. University of Missouri, IDAS Lab. Geo-Context and COVID-19 in Missouri. URL: https://geoark.missouri.edu/counties
[accessed 2022-03-31]
Abbreviations
ACS: American Community Survey
AI: artificial intelligence
FIPS: Federal Information Processing Standard
GeoARK: Geospatial Analytical Research Knowledgebase
GeoARK-BT: GeoARK-Big Table
GIS: Geographic Information System
ML: machine learning
NIH: National Institutes of Health
https://medinform.jmir.org/2022/4/e35073 JMIR Med Inform 2022 | vol. 10 | iss. 4 | e35073 | p. 13
(page number not for citation purposes)
XSL• FO
RenderXYou can also read


