Investor Deck September 2022

Page created by Pedro Bell
 
CONTINUE READING
Investor Deck September 2022
Investor Deck
September 2022
Investor Deck September 2022
Safe Harbor statements
The presentation is dated as of September 8, 2022 and speaks as of the date unless otherwise specified.

Forward-Looking Statements
This presentation contains statements that may constitute forward-looking statements within the meaning of the Private Securities Litigation Reform Act of 1995, including those related to
expectations for future periods, possible or assumed future results of operations, financial conditions, liquidity and related sources or needs, the Company’s supply chain, business and
integration strategies, plans and synergies, growth opportunities, performance at our stores, and the potential effects of COVID-19. There are a number of known and unknown risks,
uncertainties and other factors that may cause our actual results to differ materially from any future results expressed or implied by those forward-looking statements, including but not
limited to the integration of the recent acquisitions, our ability to execute on our strategic plan or to realize benefits from the strategic plan, the impact and duration of the conflict in
Ukraine and related governmental actions, as well as other risks, uncertainties and factors which are described in our most recent Annual Report on Form 10-K and Quarterly Reports on
Form 10-Q as filed with the SEC and available on our website. Any forward-looking statements made during this presentation reflect our current views as of today with respect to future
events, and Casey's disclaims any intention or obligation to update or revise forward-looking statements, whether as a result of new information, future events or otherwise.

Use of Non-GAAP Measures
This presentation includes references to "EBITDA," which we define as net income before net interest expense, depreciation and amortization, and income taxes. EBITDA is not
presented in accordance with accounting principles generally accepted in the United States ("GAAP"). We believe EBITDA is useful to investors in evaluating our operating performance
because securities analysts and other interested parties use such calculations as a measure of financial performance and debt service capabilities, and it is regularly used by
management for internal purposes including our capital budgeting process, evaluating acquisition targets, and assessing store performance. EBITDA is not a recognized term under
GAAP and should not be considered a substitute for net income, cash flows from operating activities or other income or cash flow statement data. EBITDA has limitations as an analytical
tool, and should not be considered in isolation or as a substitute for analysis of our results as reported under GAAP. We strongly encourage investors to review our financial statements
and publicly filed reports in their entirety and not to rely on any single financial measure. Because non-GAAP financial measures are not standardized, EBITDA, as defined by us, may not
be comparable to similarly titled measures reported by other companies. It therefore may not be possible to compare our use of this non-GAAP financial measure with those used by
other companies. Reconciliations of EBITDA to GAAP net income for the completed fiscal quarter can be found in our quarterly report on Form 10-Q, filed with the SEC1.

      2      1 GAAP reconciliation in the appendix.
Investor Deck September 2022
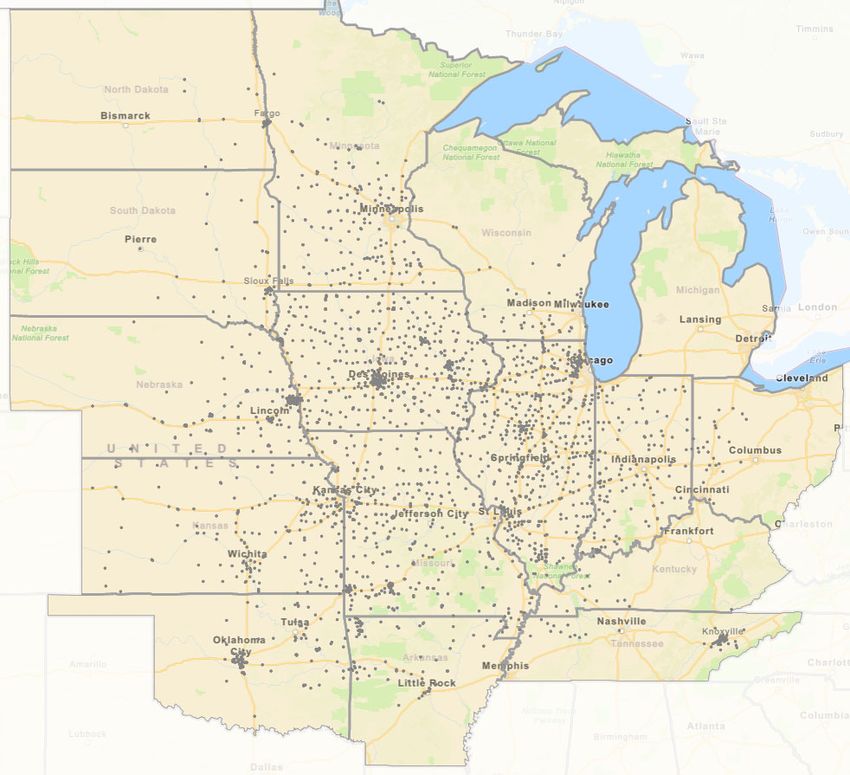
Convenience store industry dynamics
• Highly fragmented market                                                      U.S. Convenience Store Count2
      • ~65% of stores are run by operators that                                # of Stores       2021       2020      Unit Δ     % Δ
        own 10 or less stores                                                   1-10               93,994     96,963   (2,969)   -3.1%
                                                                                11-50               9,296      9,704     (408)   -4.2%
• Designated essential during the                                               51-200              8,051      8,063      (12)   -0.1%
  COVID-19 pandemic                                                             201-500             5,795      5,257      538    10.2%
                                                                                501+               30,890     30,287      603     2.0%
• Expansion outside of fuel and tobacco
                                                                                Total             148,026    150,274   (2,248)   -1.5%
      • Food service increased 280 basis points,
        as a percentage of inside sales, in the
        industry from 2018 to 20191
                                                                                                             21%
                                                                                        1-10
                                                                                        11-50
                                                                                                      4%
                                                                                        51-200
                                                                                                                         63%
                                                                                        201-500       5%
                                                                                        501+
                                                                                                        6%

  3    1 Source: NACS: Convenience Stores Pivot to Food Sales During Pandemic
       2 Source: 2022 NACS/NielsenIQ Convenience Industry Store Count
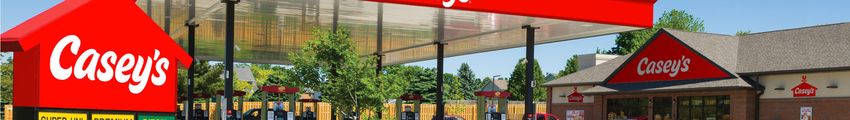
Investor Deck September 2022
Casey’s overview
3rd largest convenience store, 5th largest pizza chain business in the United States1,2

              ~$9.0B                                                                2,400+                                                                690M+                                                       43,000+
     Total Enterprise Value                                             Locations in 16 States                                          Guests Transactions per Year                                               Total Team Members

Casey’s Footprint                                                                                                                          Stock Information
                                                                                                                                            NASDAQ: CASY
                                                                                                                                            Common Shares: ~37 million
                                                                                                                                            Avg. Daily Volume: ~308,000 shares
                                                                                                                                           Investor Relations Contact:
                                                                                                                                           Brian Johnson, Sr. VP Investor Relations
                                                                                                                                           (515) 965 – 6587
                                                                                                                                           Brian.Johnson@caseys.com
                                                                                                                                                      14%

           Note: Market data, number of locations, transactions, team members as of July 31, 2022 and the FQE July 31, 2022. Average daily volume defined as average of last 30 trading days as of July 31, 2022
       4   1 By number of store in North America (post 7/11 acquisition of Speedway), source Convenience Store News & Petroleum Top 202 Convenience Stores 2020
           2 5th largest pizza chain business by number of kitchens in United States
Investor Deck September 2022
Casey’s history of success
• 50+ year legacy of serving
  Midwestern communities
• Strong and recognizable brand
• Rooted in the communities we
  serve
• Have generated consistent returns
  to shareholders

  5
Investor Deck September 2022
What makes Casey’s different
                                                                                            Differentiators

                    Rural footprint                                                       Prepared food                                 Vertical integration
        ~50% of stores in towns of 5k people                                      Over-indexed in prepared food, as a              Self-distribute ~90% of products
        or fewer                                                                  % of inside sales mix, due to Casey’s            inside store from three owned
                                                                                  pizza program, which is the 5th largest          distribution centers.
                                                                                  pizza chain in the U.S.1
                                                                                                                                   Deliver ~75% of fuel from owned
                                                                                                                                   tanker fleet

                                                                         Scale                                          Technology
                                          ~65% of convenience stores are owned by                        Casey’s has a best-in-class Digital
                                          operators that own 10 or fewer stores. With                    Rewards platform, with 5.5 million users.
                                          over 2,400 stores, Casey’s has the ability
                                          to leverage its scale across each of the
                                          three business segments.
  6   1 5th largest pizza chain business by number of kitchens in United States
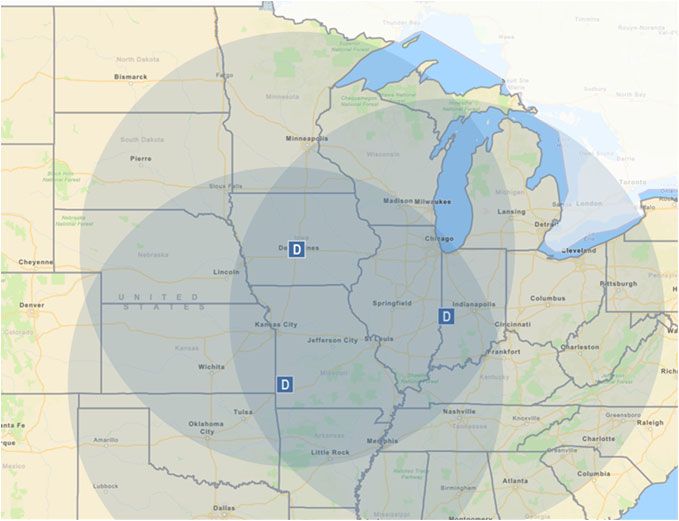
Investor Deck September 2022
Rural footprint
Significant growth opportunity in white space in the existing footprint. Additionally, the Joplin, MO distribution
center provides for a larger geographic footprint within the distribution network.
                                                                                                                                                    2
                            City/Town by State                                                                          CASY stores by population
                                       1
                                                    With          W/out1 W/out
           State                    Total CASY1                   CASY CASY %
                                                                                                           2
           AR                        186     34                     152  81.7%
           IA                        254    234                      20   7.9%
                                                                                                                           25%
           IL                        556    312                     244  43.9%
           IN                        285     89                     196  68.8%
           KS                        175    107                      68  38.9%
           KY                        222     11                     211  95.0%
                                                                                                                                                    51%
           MI                        987      1                     986  99.9%
           MN                        296    120                     176  59.5%                                       11%
           MO                        331    186                     145  43.8%
           ND                         51     11                      40  78.4%
           NE                        109     58                      51  46.8%                         2
                                                                                                                                 13%
           OH                        551     22                     529  96.0%
           OK                        210     36                     174  82.9%
           SD                         73     27                      46  63.0%
           TN                        253     19                     234  92.5%                                       Under 5,000        5,000 to 10,000
           WI                        342     35                     307  89.8%                                       10,000 to 20,000   Over 20,000
           Total                   4,881 1,302                    3,579  73.3%

       7    1 Total cities/towns with 1,000 – 20,000 people by state. Source: Demographics by Cubit.
            2 Population as of store opening.
Investor Deck September 2022
High concentration of prepared food
                                                                                                        Inside Sales

                               Fuel                                   Grocery & General Merchandise               Prepared Food & Dispensed Beverage
 • Gasoline, diesel, and bio-diesel                                   •   Grocery                                    • Whole pizza pies
 • Key metrics:                                                       •   Tobacco                                    • Pizza by-the-slice
                                                                      •   Alcoholic Beverages                        • Other hot and cold food
         • Volume: gallons
                                                                      •   Non-Alcoholic Beverages                    • Bakery
         • Margin: cents per gallon
                                                                      •   National brands and private                • Hot and cold dispensed beverages
           (CPG)
                                                                          label products

                                                  Revenue                                                           Gross Profit
                               Fuel                                                                     Fuel
                                                            9% 2%                                                                    3%
                               Grocery & General                                                        Grocery & General    26%           34%
                               Merchandise        24%                                                   Merchandise
                               Prepared Food &                      64%                                 Prepared Food &
                               Dispensed Beverage                                                       Dispensed Beverage
                               Other                                                                    Other                        37%

                                                  $13.0 billion                                                       $2.8 billion
  8   Note: Financial information from FY 2022.
Investor Deck September 2022
Vertical integration
                               Self-distribution                                              Benefits
                                                   DC #1 - Ankeny, IA
                                                                             • Enables best-in-class inside
Fuel Distribution – Owned Fleet of Fuel Trucks

                                                                               gross profit margin
                                                                             • Deal directly with vendors
500 Mile Distribution Radius

                                                   DC #2 – Terre Haute, IN   • Less reliance on third parties
                                                                             • Efficient distribution to rural
                                                                               markets
                                                   DC #3 – Joplin, MO
                                                                             • Haul ~75% of fuel gallons sold
                                         2

     9
Investor Deck September 2022
Our strategy
                                       Deliver top quintile EBITDA growth (8-10% EBITDA CAGR FY21-FY23)1

                 Reinvent the                            Create capacity through                          Accelerate unit growth
               guest experience                                efficiencies
       Contemporize our food proposition,                  Drive efficiencies to improve the            Accelerate our new store builds and
       optimize & localize assortment ,and               shape of the business and fund future           acquisitions, including market and
         deliver compelling experiences                                  growth                               store format expansion

                       Invest in our talent                    Create a culture that drives performance and exceeds guests’ expectations

  10 1 Investor Day, January 9, 2020
Casey’s Investor Day Commitment1

                                       EBITDA % Growth             8% to 10% CAGR through FY2023

                                                               345 additional new and acquired stores by
                                        Store Growth
                                                                                FY2023
                                                                  Fuel gallons: flat-to-low single digit
                                       Same-store sales
                                                                  Inside sales: low-to-mid single digit

                                  Gross profit margin %      Margin expansion inside and outside the store

                                                            Operational expense % growth below EBITDA %
                                 Operational efficiencies
                                                                               growth
                                                            Cash flows from operating activities greater than
                                         Cash flows
                                                                          capital expenditures

  11 1 Investor Day, January 9, 2020
Reinvent the guest experience
• Contemporize food proposition
       •   Experienced restaurant talent
       •   Culinary innovation process & pipeline
       •   Refreshed/expanded dispensed
           beverage and breakfast menu
• Investment in Digital capabilities for a
  modern - digitally-enabled, connected
  experience
       •   Stress-tested by COVID-19
                                                                         • Rolled out ~285 Casey’s branded products through July 2022
       •   Over 5.5M users as of Sept. 2022
                                                                         • Casey’s had been underpenetrated in private label
       •   Insight-driven engagement
                                                                         • Inside Sales
       •   Data driven decision-making
       •   Partner with DoorDash and UberEats
                                                                             • Industry average ~10%
                                                                             • Beginning of FY21 had ~1% private label mix in inside sales
  Digital Guest Evolution Example:                                           • By the end of FY 2022, inside sales surpassed 5% private
       Current Guest Type            Evolves To                                  label sales, exceeding internal expectations
        Fuel only                     Merchandise and food                   • Goal to approach industry average in 2-3 years from launch
        Weekday pizza slice           Friday whole pizza
        Tobacco-centric               Access to manufacturer discounts

  12
Create capacity through efficiencies
• Business optimization and cost reduction
       • Fuel capabilities
       • Merchandise and food
       • Supply chain
• Human capital
       •   Improved field capabilities
       •   Utilize technology for simple or automated tasks
       •   Merchandising personnel in the field
       •   New field organizational structure
       •   Schedule optimization
• Asset protection/Loss prevention
• Procurement

  13
Accelerate unit growth
Stated goal is 345 unit expansion, approximately 5% CAGR, beginning in FY21 to be
completed by FY23.

  • First available dollar to new units                                                                                 Historical Growth
           • Opportunistic between organic and M&A growth
                                                                                    # of units by fiscal year
           • Accretive to:
                                                                                            New builds              Acquisitions              Store Count
                  •    EBITDA
                                                                                                                                                                                      2,452
                  •    ROIC                                                         1,531    1,637   1,699   1,749    1,808   1,878   1,931   1,978   2,073   2,146   2,207   2,243

  • Optimized network plans
  • Corporate operated, no franchising
  • Dedicated real estate and M&A teams
  • 3 large acquisitions in FY22                                                                                                                                                      207
      • Buchanan Energy, over 90 retail locations                                                                                                      26
         and 80 dealer sites                                                                                                                                   24      18
                                                                                              89                               36
      • 48 Circle-K stores primarily in Oklahoma                                     37
                                                                                                      35      26
                                                                                                                       28
                                                                                                                                       5
                                                                                                                                               22
                                                                                                                                                       85                      5
                                                                                                                                                                       60
         City                                                                        18       20      30      31
                                                                                                                       44      45      51      48              56
                                                                                                                                                                               40
                                                                                                                                                                                       21
      • 40 Pilot stores primarily in Knoxville, TN                                  2010     2011    2012    2013     2014    2015    2016    2017    2018    2019    2020    2021    2022

         market
  • In-house construction team
      14
Network footprint
• Ample white space within the
  existing footprint
• Joplin, MO distribution center
  expands the distribution
  network

  15
Invest in our talent
• Strong blend of new and tenured
  CASY leadership
• Strengthened, diverse team
• Focused development programs
• Increased engagement to make life
  better for guests and communities

  16
Board of Directors
The board of directors at CASY includes members of diverse backgrounds with significant leadership and industry experience. Recognized by the
Women’s Forum of New York for gender diversity.

                          Darren Rebelez           H. Lynn Horak            Diane Bridgewater           Sri Donthi              Donald Frieson           Cara Heiden
                          President & CEO of       Board Chair, Past        EVP, Chief Financial and    EVP & Chief Technology EVP Supply Chain,         Retired Co-President of
                          Casey’s General Stores   Regional Chairman with   Administrative Officer of   Officer of Advance Auto Lowe’s Companies         Wells Fargo Home
                                                   Wells Fargo Regional     LCS                         Parts, Inc.                                      Mortgage
                                                   Banking

                          David Lenhardt           Larree Renda               Judy Schmeling            Mike Spanos             Gregory Trojan           Allison Wing
                          Former President and     Retired Executive Vice     Former COO of HSN,        Former President &      Former Chief Executive   CEO of Joywell Foods,
                          CEO of PetSmart, Inc.    President of Safeway, Inc. Inc. and former           CEO of Six Flags        Officer of BJ’s          Inc.
                                                                              President of              Entertainment and       Restaurants, Inc.
                                                                              Cornerstone Brands        former CEO of PepsiCO
                                                                                                        Asia, Middle East and
                                                                                                        North Africa
       17
Progress on Environmental, Social, Governance (ESG)
In July, we were proud to share our 2022 ESG Report. For more information, please visit https://investor.caseys.com/sustainability/default.aspx

  Our Approach to ESG                                                               2022 ESG Report Highlights

          Here for Good                ESG Materiality              Community                   Expanded                 Strengthened             Grew
 • Our purpose remains making           Assessment                   Support                   ESG Metrics               DEI Strategy         Environmental
   life better for our communities   • Advanced our             • Enabled $4.7 million     • Engaged in               • Established DEI        Stewardship
   and guests every day                understanding and          in charitable giving       comprehensive              Committee to        • Launched inaugural
 • Our ESG principles are              prioritization of ESG      alongside our guests,      identification and         further advance       energy and
   embedded in how we operate,         topics most relevant       supplier partners and      collection of relevant     CARES values in       greenhouse gas
   one store at a time, one            to our long-term           team members to            ESG metrics                building diverse,     (GHG) assessment
   hometown to the next                value creation and         support hunger relief,   • Added summary              inclusive culture   • Plan to disclose
 • Comprised of cross-functional       financial success          educational needs          table to back of         • Continued to add      Scope 1 and 2
   leaders, Casey’s ESG              • Applied to inform and      and community              report for easy            diverse talent to     GHG emissions data
   Committee plays a key role          guide our ESG              servant initiatives        referance                  our Board of          beginning in calendar
   in developing and driving           strategy and                                                                     Directors and         2023 and material
   the implementation of               resource allocation to                                                           leadership teams      Scope
   our enterprise-wide                 areas that matter                                                                                      3 emissions data
   sustainability efforts              most to Casey’s                                                                                        in calendar 2024
                                       stakeholders

     18
Appendix

 19
Same store & gross margin trends
                                       Fuel                                                                                   Inside
                                                      34.9                  36.0                                                                           6.6%
                                        26.8                                               41.0%            41.5%              40.8%
        18.5        20.3                                                                                                                       40.0%       40.0%

                                                                           4.4%
       2.3%                                                                                                                                     4.0%
                                                                                                             3.0%

                   -1.7%                                                                   1.8%
                                       -5.1%                                                                                   0.8%
                                                     -8.1%
       2018        2019                 2020         2021                  2022            2018              2019              2020             2021       2022

               Same-Store Sales (gallons)      Margin (cents per gallon)                                             Same-Store Sales         Margin

                    Grocery & General Merchandise                                                          Prepared Food & Dispensed Beverage
                                                                           32.7%                                    62.2%
                   32.1%                                                                           61.0%                            60.9%          60.1%
       31.8%                           32.0%         32.0%                         8.5%                                                                     7.4%

                                                                                   6.5%                                                                     59.2%
                                                     6.6%                  6.3%
                                                                                   4.5%
                                                                                   2.5%            1.7%             1.9%
                   3.6%
                                                                                   0.5%
       1.9%                             1.9%
                                                                                   -1.5%
                                                                                                                                      -1.5%
                                                                                                                                                   -2.1%
                                                                                   -3.5%
       2018        2019                 2020         2021                  2022                    2018             2019              2020          2021    2022

                            Same-Store Sales      Margin                                                             Same-Store Sales         Margin
  20
Earnings and leverage trends
$ in millions except per share
                                           EBITDA                                     Diluted Earnings per Share

                                                                $801
                                             13%                                                2%
                                            CAGR                                               CAGR
                                                         $719
                                                                                                                          $9.10
                                             $647                      $8.34                                   $8.38

                                 $563
                                                                                                 $7.10
                     $486

                                                                               $5.51

                     2018        2019        2020        2021   2022   2018    2019              2020          2021       2022

                                        Free Cash Flow                                      Debt:EBITDA
                                                                $462
                                                                       2.8x
                                                         $363
                                                                               2.4x
                                                                                                 2.2x                     2.1x
                                                                                                                   1.9x
                                 $136
                                             $65

                    ($158)
                     2018        2019        2020        2021   2022   2018    2019              2020          2021       2022
      21
Reconciliation of non-GAAP to GAAP
$ in thousands

                                                                     Fiscal years ended April 30,
                                                           2018      2019        2020       2021    2022
             Net income                                  $ 317,903 $ 203,886 $ 263,846 $ 312,900 $ 339,700
             Interest, net                                  50,940    55,656      53,419    46,679  56,972
             Federal and state income taxes               (103,466)   59,516      78,202    94,470 100,938
             Depreciation and amortization                 220,970   244,387 251,174 265,195 303,541
             EBITDA                                      $ 486,347 $ 563,445 $ 646,641 $ 719,244 $ 801,151
                                                                       Fiscal years ended April 30,
                                                            2018       2019        2020       2021   2022
             Net cash provided by operating activities   $ 419,797 $ 530,614 $ 504,314 $ 804,088 $ 788,741
             Purchase of property and equipment            (577,421) (394,699) (438,977) (441,252) (326,475)
             Free cash flow                              $ (157,624) $ 135,915 $ 65,337 $ 362,836 $ 462,266

     22
You can also read