INVESTOR PRESENTATION - March 2020 - eDreams ODIGEO
←
→
Page content transcription
If your browser does not render page correctly, please read the page content below

March 2020

  INVESTOR
PRESENTATION

Disclaimer
1
    This presentation is to be read as an introduction to the unaudited condensed consolidated interim financial statements of the Group and contains key information presented in a
    concise manner on the Group and its financial condition. The information contained in this presentations is extracted from the unaudited condensed consolidated interim financial
    statements of the Group and is qualified in its entirety by the additional information contained in the unaudited condensed consolidated interim financial statements of the Group.
    This presentation should only be read in conjunction with the condensed consolidated interim financial statements of the Group. Copies of the condensed consolidated interim financial
    statements of the Group are available under http://www.edreamsodigeo.com/category/investors/quarterly-edreams-odigeo/.

2   Certain statements included or incorporated by reference within this presentation may constitute “forward-looking statements” in respect of the Group’s operations, performance,
    prospects and/or financial condition, the industry in which the Group operates and the Group’s intentions as to its financial policy. By their nature, forward-looking statements involve a
    number of risks, uncertainties and assumptions and actual results or events may differ materially from those expressed or implied by those statements. Accordingly, no assurance can
    be given that any particular expectation will be met and reliance should not be placed on any forward-looking statement. Additionally, forward-looking statements regarding past
    trends or activities should not be taken as a representation that such trends or activities will continue in the future. Statements in this presentation reflect the knowledge and
    information available at the time of its preparation. The Group does not undertake any responsibility or obligation to update the information in this presentation, including any forward-
    looking statement resulting from new information, future events or otherwise. Nothing in this presentation should be construed as a profit forecast.

3   This presentation does not constitute or form part of, and should not be construed as, an offer or invitation to sell, or a solicitation of any offer to purchase or acquire any securities or
    related financial instruments of the company, nor shall it or any part of it or the fact of its distribution form the basis of, or be relied on in connection with, any contract or commitment
    or investment decisions relating thereto, nor does it constitute a recommendation regarding the securities of the company. No securities of eDreams ODIGEO have been or will be
    registered under the U.S. Securities Act of 1933, as amended (the “Securities Act”) and may not be offered or sold in the United States absent registration or an exemption from
    registration under the Securities Act. Past performance cannot be relied upon as a guide to future performance and persons needing advice should consult an independent financial
    adviser.

4
    This presentation has been sent to you in an electronic form. You are reminded that documents transmitted via this medium may be altered or changed during the process of
    transmission and, consequently, neither eDreams ODIGEO nor any of its subsidiaries, nor any director, officer, employer, employee or agent of theirs, or affiliate of any such person,
    accepts any liability or responsibility whatsoever in respect of any difference between the presentation distributed to you in electronic format and the hard copy version available to you
    on request.

5
    In the United Kingdom, this presentation is directed only at persons who (i) fall within Article 43(2) of the Financial Services and Markets Act 2000 (Financial Promotion) Order 2005, as
    amended (the “Order”), (ii) are persons having professional experience in matters relating to investments who fall within the definition of “investment professionals” in Article 19(5) of
    the Order, or (iii) are persons who are high net worth entities falling within Article 49(2)(a) to (d) of the Order, and other persons to whom it may lawfully be communicated (together
    “Relevant Persons”). Under no circumstances should persons who are not Relevant Persons rely or act upon the contents of this presentation. Any investment or investment activity to
    which this presentation relates in the United Kingdom is available only to, and will be engaged only with, Relevant Persons.

6
    The financial information included in this presentation includes certain non-GAAP measures, including “Bookings”, “Gross Bookings”, “EBITDA”, “Adjusted EBITDA”, “Revenue Margin” and
    “Variable Costs”, which are not accounting measures as defined by IFRS. We have presented these measures because we believe that they are useful indicators of our financial
    performance and our ability to incur and service our indebtedness and can assist analysts, investors and other parties to evaluate our business. However, these measures should not be
    used instead of, or considered as alternatives to, the condensed consolidated interim financial statements for the Group based on IFRS. Further, these measures may not be comparable
    to similarly titled measures disclosed by other companies.

                                                                                                2                                                                       INVESTOR PRESENTATION
eDREAMS ODIGEO, A GLOBAL ONLINE TRAVEL COMPANY
One of the largest e-commerce businesses in Europe

261 Websites
and Apps in
20 languages
and 30 different
currencies on one
central platform

        Strong presence in 46 markets, covering 80% of total market with 5 leading brands

                                                     3                              INVESTOR PRESENTATION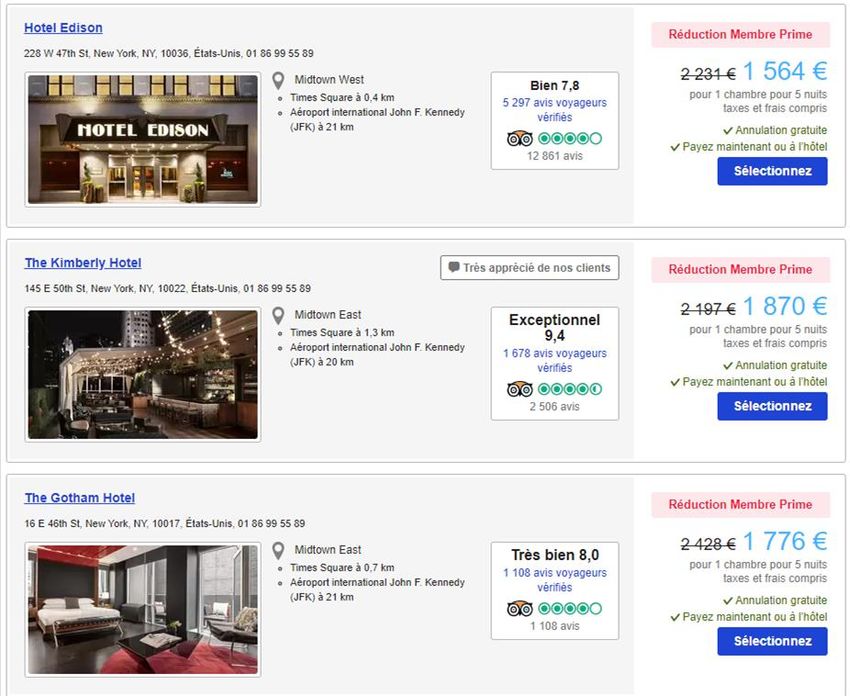
Why eDREAMS ODIGEO?
Investment Highlights
1 Global OTA in attractive market, with leading position in flights
2 Sustainable scale advantages relative to competition
3 Large growth opportunities capitalizing on position
4 Proven high-margin, FCF-generating business model
5 Resilient business model

                                            4                         INVESTOR PRESENTATION
THE SCALE PLAYER IN FLIGHTS FOR EUROPE, AND ONE OF THE LARGEST WORLDWIDE
 1
1.1

       ONLY 3 BIG GLOBAL PLAYERS IN FLIGHTS                          eDO UNRIVALLED SCALE WITH 1.8X MORE
       WITH EXPEDIA AND CTRIP, VERY LARGE                           EUROPEAN FLIGHT REVENUE THAN THE #2
                IN THE US AND CHINA                                                PLAYER

                         GLOBAL FLIGHT REVENUE                         EUROPEAN FLIGHT REVENUE ESTIMATED, LATEST FY (€M)
                         Estimated, latest FY (€m)
                                                                         343
            Ctrip                                  1,646
                                                           #1                      1.8X

        Expedia                      770
                                              #2                                       190
                                                                                                     150
                                                                                                                   100
                                    #3
       eDreams
        ODIGEO             421

Source: Phocuswright, Company data, eDO analysis

                                                                5                                           INVESTOR PRESENTATION
STRATEGICALLY             POSITIONED           IN  ENORMOUS              ONLINE        TRAVEL        MARKET
 1 eDO’s leadership in the €15B European online flight sector positions it strongly for growth in the €1.2T global travel market
1.2

                            WORLDWIDE TRAVEL MARKET (GROSS BOOKINGS, 2019 – 2022, €B)
         EUROPE
                                                  4.8%
                                                                                  6.7%                  4.0%
                                 1,2%

                               €15B               €63B                €181B                    €361B
                               €59B              €167B                €391B                    €834B

         REST OF
         WORLD
                                5.9%                                                                               2019   Primary Focus

                                                   10.1%                          8.8%                             2019   Secondary Focus

                                                                                                         5.4%
                                                                                                                   2022 CAGR 19-22

                           FLIGHTS                OTAS              ONLINE               ALL
                                                           MOST COMMONLY
      70% OF TRAVELLERS
                                                           USED INTERMEDIARY IN
       BOOK FLIGHT FIRST
                                                           ONLINE TRAVEL

                     Source: Phocuswright, eDO analysis
                                                                              6                                    INVESTOR PRESENTATION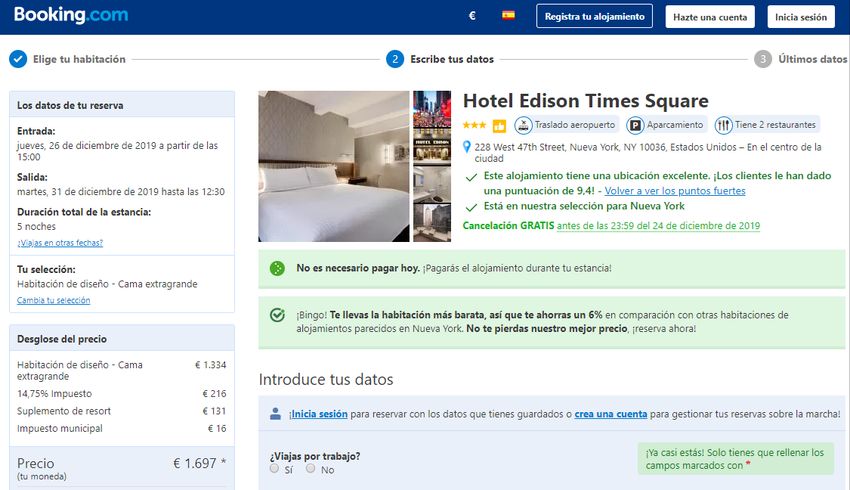
2
1.1   SUSTAINABLE SCALE ADVANTAGES RELATIVE TO COMPETITION
      DRIVING GROWTH IN CLASSIC FLIGHTS AND DIVERSIFICATION

           1                                      2
               CLASSIC FLIGHTS                           DIVERSIFICATION
               WINNING CONTENT                           RICHER PRODUCT PORTFOLIO
               BETTER PRICE AND MARGIN                   SUNK MARKETING COSTS AT LOWER COST POINT
               BETTER PRODUCT                            CAN TRANSFER BENEFIT TO CONSUMER
               AND CUSTOMER EXPERIENCE                   INCREASED LEVEL OF DATA FOR TARGETING

                                      PRODUCT DEVELOPMENT STRENGTH

                                       END TO END JOURNEY EXPERIENCE

                                               BRAND STRENGTH

                                AI/ML INDIVIDUALISED MODELS & EXPERIENCES

                                                        7                               INVESTOR PRESENTATION
2   CLASSIC FLIGHTS: LEVERAGING SCALE & POSITION TO DELIVER
    PRICING SUPERIORITY & BETTER CONTENT QUALITY

                               % OF TIMES eDO                                                                        MORE FLIGHT COMBINATIONS
                              HAS A LOWER PRICE                                                                     ON METAS THAN ANY OTHER OTA
                                                                                                                        OR AIRLINE (INDEXED)
         97%                                                                                              100%
                                     96%
                                                                 95%
                       93%                                                                                           83%
                                                   91%
                                                                               90%                                               75%

                                                                                                                                            57%

                                                                                             82%                                                        45%
                                                                                                                                                                    41%

                                                                                                                                                                               29%

                                                                                                                                                                                           6%           5%

      Airline A     Airline B      Airline C     Average        OTA A         OTA B        Average        eDO        OTA A      OTA B       OTA C      OTA D       OTA E      OTA F AIRLINE AIRLINE
                                                   Top                                      Metas                                                                                      A       B
                                                 Airlines
                                                                                                          Source: eDO analysis based on +40,000 data points across FR, ES, IT, DE & UK markets for top 200
    Source: based on 25k datapoints collected between October 10th and October 26th 2019 on France,       routes collected between April and October 2019 in metasearch Idealo, Jetcost, Skyscanner,
    Germany, Italy & Spain. Comparison made on exact same content with airlines on their websites,        KayakGroup & Liligo
    other OTAs on their website and cheapest option available on Skyscanner & Kayak.

                                                                                                      8                                                                     INVESTOR PRESENTATION
2
1.1        CLASSIC FLIGHTS:
           BEST END-TO-END (MOBILE) EXPERIENCE

                                      RETURN SINGLE CARRIER                              TIME TO COMPLETE BOOKING
                                                                                         RETURN MULTIPLE AIRLINES

                                                                                                                          9m
                                                                                                                          36s

                                                                                                        7m       7m
                         PENDING           4m       4m                                                  07s      26s
                                                                                     PENDING
                       CONFIRMATION        01s      06s                            CONFIRMATION
                        OF BOOKING
                                                                                    OF BOOKING

                              3m                             3m        3m
                              05s                            12s       21s                 4m
                                                                                           10s                                      3m
                                                                                 1m                                                 58s
                                                                                 40s
                 1m
                 38s

                  eDO      Meta (direct)   Meta 1   Meta 2   Airline   OTA       eDO    Meta (direct)   Meta 1   Meta 2   Airline   OTA

                               Additional 20-25s can be saved if card payment details are stored
Source: eDO Analysis

                                                                             9                                            INVESTOR PRESENTATION
2        DIVERSIFICATION: OUR CUSTOMERS SAVE MONEY ON FLIGHT+HOTEL

                                          DYNAMIC PACKAGES                           TOP AIRLINES                                    TOP AIRLINES                            AVERAGE
                                             TOP 4 OTAS                            + TOP HOTELIERS                                + TOP HOTEL OTAS

                                                                                                                                 85%             90%         88%                83%
                                                   80%            75%                            80%

            % OF
            TIMES eDO
            IS CHEAPER
                                                                                                 €194                            €184
                                                                                                   19%
                                                                                                                                                 €179
                                                                                                                                  18%
                                                                                                                                                   17%
                                                                                                                                                             €153               €153
             Average saving                                       €123                                                                                         15%                15%
               value (*) ( €)
                                                                   12%
            % OF AVG.                              €61
            SAVING                                  6%
            AT eDO
                                                                                                                               OTA A              OTA B       OTA C
                                                 OTA A           OTA B                    Airline + Hotelier
                                                                                                                              + Airline          + Airline   + Airline
 Source: Benchmark performed on November 5th in eDO websites for each market vs. the competitors and / or providers airlines and hotel website
(*) Saving value estimated based on average gross booking value of our Dynamic Packages

                                                                                                         10                                                              INVESTOR PRESENTATION
3
1.3 LARGE GROWTH OPPORTUNITIES CAPITALIZE ON
OUR SCALE ADVANTAGES
Vision “YOUR TRUSTED TRAVEL COMPANION”
Strengthen and grow online Leverage strong travel
Goals flights offering to build strong
travel relationships
relationships to serve
customers’ full travel needs
#1 #2 #3 #4
Growth Expand Prime Deliver most Diversify and Reinvest strong
membership innovative, grow revenue / FCF in M&A
Opportunities subscription end-to-end products sold & growth
program experience around flights opportunities
11 INVESTOR PRESENTATION3.1 PRIME: OUR GOAL TO GROW TO 2M MEMBERS
1.3 We have reached ~555k members since launching 2 years ago IN 2023
Launch of Launch Launch of 555k 2M
1st pilot in of Prime Spain and MEMBERS MEMBERS
France in Italy Germany
2017 2018 2019 2020 2023
1st renewals
France
Launch
of Hotels
in France
2 YEARS +27,000 Continuous 100s Variations
of testing and customer
+1,000 display of discounts in membership
AB tests and pricing duration
learnings interviews iterations & pricing
optimizations
12 INVESTOR PRESENTATION3.1 PRIME: GREAT FOR OUR CUSTOMERS AND GREAT FOR
1.3 Strong and unique value proposition for customers, with beneficial impact for our businessUS!
GREAT FOR OUR GREAT FOR
CUSTOMER
Great flight prices:
we are the cheapest in
the market 90%+ of the times
Great hotel prices: Members
now also save on all hotels. NEW
Priority customer service line:
faster pick-up time and best
agents on call
RESULTING IN HIGHER NPS (*) RESULTING IN HIGHER LIFETIME VALUE
(*) NPS = Net Promoter Score Source: internal data, 24 month extrapolation based on 18 month historical datapoints for France
(**) CVR = Conversion Rate
13 INVESTOR PRESENTATION3.2
1.3 INNOVATIVE END-TO-END MOBILE EXPERIENCE: PROVIDING
COMPREHENSIVE MOBILE SOLUTION FOR CUSTOMER PAIN POINTS
MOBILE OUTGROWS DESKTOP BY 6.5X WITH
A CAGR OF 20% FY16-22 VS. 3% IN DESKTOP
European Online Travel Market gross
APP RATINGS
bookings (€ Bn) growth by device
Booking.com 4,6 Lufthansa 2,7
Opodo 4,5 Omio 2,7
CAGR
+20%
GoVoyages 4,5 Vueling 2,5
eDreams 4,4 Kiwi 2,3
Kayak 4,3 Ryanair 2,2
Lastminute 3,7 British Airways 2,0
Easyjet 3,5 Air France 1,8
CAGR
+3%
Expedia 3,0
Skyscanner 2,9
Iberia 2,7
Desktop Mobile Source: App Rating Average for the Reviews (Aug to Oct 2019)
Source: Phocuswright, Phocalpoint
14 INVESTOR PRESENTATION3.2
1.3 INNOVATIVE END-TO-END MOBILE EXPERIENCE: COVERING THE
WHOLE CUSTOMER JOURNEY AS ONLINE TRAVEL GOES MOBILE
PROVIDE INNOVATIVE MOBILE LEADING SEARCH EXPERIENCE
PROVIDE
SOLUTION INNOVATIVE
FOR CUSTOMER PAIN COVER ALL PRODUCT LEADING
AND SEARCH
COVERSION
PROVIDE INNOVATIVE
PROVIDE INNOVATIVE COVER ALL PRODUCT
RELATED NEEDS LEADING SEARCH
LEADING AND
SEARCH
POINTS FOR
MOBILE SOLUTION FOR COVER ALL PRODUCT
COVER ALL PRODUCT EXPERIENCE
MOBILE SOLUTION
MOBILEPAIN
SOLUTION FOR RELATED NEEDS EXPERIENCE AND AND
EXPERIENCE
CUSTOMER POINTS RELATED NEEDS
RELATED NEEDS CONVERSION
CUSTOMER PAINPAIN
CUSTOMER POINTS
POINTS CONVERSION
CONVERSION
FLIGHT
FLIGHTFLIGHT
TRACKING
TRACKING
TRACKING BAG
BAG BAG
CHECKER GOING
CHECKER
CHECKER GOINGGOING
BEYOND
BEYONDBEYOND
FLIGHT ONLY
FLIGHTFLIG
ONLY
RELATEDHT ONLY
RELATED
RELATED
FEATURES
FEATURES
FEATURES
ENSUREOUR
ENSURE OUR
ENSURE
USERSCAN EASILYOUR
USERSUSERS
CAN EASILY
CTAN EASILY
SELEC AND
SELECSELEC
T ANDT AND
MOBILE PURCHASE THE
PURCHASE THE
MOBILEMOBILE
BOARDING MOSTPURC HASETHE
RELEVANT
BOARDING MOSTMOST
RELEVANT
RELEVANT
CBOARDING
ARDS CONTENT
CARDSCARDS CONTENTCONTENT
WHOLE CUSTOMER JOURNEY PLAN – BOOK – PREPARE – TRAVEL
15 INVESTOR PRESENTATION3.3
1.2 LEVERAGING STRONG FLIGHT POSITION TO GAIN LARGE SHARE OF TOTAL
CONSUMER TRAVEL SPEND
Leisure travelers typically begin their travel planning process with the most time sensitive element
– flights – and book other items around this
FIRST PURCHASE IN TRAVEL GLOBAL SEARCH CPC PER PRODUCT
PLANNING PROCESS (INDEXED 1x)
FLIGHTS
2.3-4x
70%
2-3x
30% 1x
Flight Others Air Accommodation Car Rental
Source: Industry data
Source: Survey conducted in 5 countries (Fr, It, UK, De, Es). n = 2,080
16 INVESTOR PRESENTATION3.3
1.1 DIVERSIFICATION: LEVERAGING SCALE AND POSITION TO GROW INTO FULL-
SERVICE TRAVEL PROVIDER
NUMBER OF PRODUCTS SOLD ADDITIONAL PRODUCTS SOLD DIVERSIFICATION REVENUE
(NUMBER OFFERED) (PER 100 FLIGHTS) (€ IN MILLIONS)
237
16 72
23% 24%
CAGR
CAGR 56 179
59%
CAGR 146
10 45
39 124
6
4
FY16 FY17 FY18 FY19 FY16 FY17 FY18 FY19 FY16 FY17 FY18 FY19
Source: eDO BI and consolidated financial statements
Note: CAGR FY16-FY19
17 INVESTOR PRESENTATION3.3 DIVERSIFICATION: WE HAVE A VERY MEANINGFUL OPPORTUNITY
TO GROW DYNAMIC PACKAGES
We have grown significantly our Dynamic Packages
business over the past years and we will grow
it further in coming years.
We have an opportunity to grow our Dynamic
Packages revenue margin by 10x in coming years,
driven by an increase in attachment rate. Customers that book
a hotel after booking
a flight with us
+28%
Total opportunity to grow our
Dynamic Packages
attachment if all our
+24% customers booking
a hotel book it with us
x10
FY18 FY19 FY20
Source: eDO Analysis
18 INVESTOR PRESENTATION3.3
1.3 DIVERSIFICATION: WE HAVE SUBSTANTIAL OPPORTUNITIES TO EXPAND
ANCILLARY REVENUE ACROSS ADDITIONAL TOUCHPOINTS
ANCILLARY PRODUCTS BOOKING PATH POST-BOOKING CHECK-IN AT-DESTINATION
Baggage OPPORTUNITY -
Seats -
Car hire OPPORTUNITY
Transfers, Taxis & VTC OPPORTUNITY OPPORTUNITY
Cancellation insurance - - -
Cancellation & medical assistance OPPORTUNITY -
Customers premium service OPPORTUNITY OPPORTUNITY -
Lost baggage assistance OPPORTUNITY OPPORTUNITY -
Flight delay compensation OPPORTUNITY OPPORTUNITY OPPORTUNITY
Medical assistance OPPORTUNITY -
SMS flight confirmation & details OPPORTUNITY OPPORTUNITY -
Posted tickets OPPORTUNITY OPPORTUNITY -
Visas OPPORTUNITY -
Restaurants OPPORTUNITY OPPORTUNITY OPPORTUNITY
Tours Events & Activities OPPORTUNITY OPPORTUNITY
Cancel for any reason - - -
Flexible flight dates - - -
Automated check-in & mobile pass OPPORTUNITY -
Airport Parking OPPORTUNITY OPPORTUNITY OPPORTUNITY
Airport Lounges OPPORTUNITY OPPORTUNITY OPPORTUNITY OPPORTUNITY
19 INVESTOR PRESENTATION3.4
1.3 STRONG GROWTH POTENTIAL FROM
STRATEGIC M&A: SCALE AND PRODUCT
SEVERAL TARGETS WOULD SELECTED POTENTIAL
ALLOW US TO FURTHER TARGETS WOULD ALLOW
INCREASE OUR SCALE US TO GATHER GROWTH
THROUGH NEW
We have identified many
potential targets that PRODUCTS
would allow us to reach There are currently large
more customers than number of startups we are
we do today considering for strategic
These targets would allow M&A to further enhance
us to grow through TRAVEL TECH CONTINUES TO BE A VERY our platform with new
additional brands and FERTILE GROUND FOR INNOVATION AND types of contents for our
content in more locations INVESTMENT customers, as well as
in regions across Europe, technological innovations
the Americas, the Middle In the last 5 years, >1000 travel startups leveraging machine-based
East and Africa, or Asia founded, and $16bn were funded to these learning, messaging, and
Pacific travel tech startups other innovations in
e-commerce
Travel tech is truly global with significant
funding across geographies (Europe, APAC,
Americas, Middle East and Africa)
20 INVESTOR PRESENTATION4
1.4 PROVEN HIGH-MARGIN, FCF-GENERATING BUSINESS MODEL
Solid Revenue, EBITDA and FCF Generation
REVENUE MARGIN ADJUSTED EBITDA Recurring FCF (*)
(€ in millions) (€ in millions) (€ in millions)
5% +4-7% +9-12% 35%
CAGR 7% 65.5 CAGR
CAGR
533
509 118.3 119.6
487 55.3
463 107.3
436 49.3
95.8
90.5
17.9
14.7
FY15 FY16 FY17 FY18 FY19 FY20 FY15 FY16 FY17 FY18 FY19 FY20 FY15 FY16 FY17 FY18 FY19
Note: CAGR FY15 – FY19 Outlook Outlook
Source: eDO Financial Statements
(*) Please refer to page 37 for the calculation of Recurring Free Cash Flow (FCF)
21 INVESTOR PRESENTATION5 WE HAVE A RESILIENT BUSINESS MODEL
WHY BUSINESS MODEL RESILIENT
1. The majority of our costs are Variable Cost Economic crisis
(circa 80%) China devaluates
currency Air Berlin
Rusia intervenes Syria bankruptcy
2. The business is diversified by geography.
Arab Spring ISIS 4 Terrorist Attacks
We do not have high exposure to a single Greece
Economic
Malaysia Airlines Flight 370
Disappears
destination. For example Italy as a Crisis and
Bailout by EU Oil Price Crisis
Terrorist Yihadist attacks
ISIS Declares an Islamic Caliphate
destination only represents 7% of our
Lehman Spanair
total Bookings Tsunami Brothers Volcano Fukushima bankruptcy Brexit
3. We have current availability in our RCF of 509
533
€170 million, which could be used if REVENUE MARGIN (*) 430 436
463
487
needed in periods of slowing demand (€ in millions) 373
320
4. Ample headroom vs our 6x Gross Leverage CAGR 06-11: +38% CAGR 12-19: +8%
Covenant
36 100
5. No short term financial debt payments. 20 51 65 75
Our Senior Notes are due in 2023 2006 2007 2008 2009 2010 2011 2012 2013 2014 2015 2016 2017 2018 2019
Source: Company data (*) From 2006 to 2011 eDreams standalone, and from 2012 eDreams ODIGEO
22 INVESTOR PRESENTATIONWHY INVEST IN eDREAMS ODIGEO?
GLOBAL OTA IN LARGE GROWTH
SUSTAINABLE SCALE
ATTRACTIVE MARKET, OPPORTUNITIES
ADVANTAGES RELATIVE
WITH LEADING CAPITALIZING ON
TO COMPETITION
POSITION IN FLIGHTS POSITION
PROVEN HIGH-MARGIN, RESILIENT
FCF-GENERATING BUSINESS MODEL
BUSINESS MODEL
23 INVESTOR PRESENTATIONAPPENDIX 24
1
1.2 EUROPEAN        FLIGHT    MARKET  ESPECIALLY ATTRACTIVE FOR OTAS
    Highly fragmented European market

                      US                                                                                                                             224                       EUROPE
                                                                                     60                  58
                                                                                                                                         208
                      NUMBER OF                                                                                                                                                  NUMBER OF
                      AIRLINES1                                                     2016               2019                              2016        2019                          AIRLINES1
    Supply

                      MARKET SHARE OF                                                                                                                                      MARKET SHARE OF
                                                                                            US 81%                                         EUROPE 29%
                      TOP 4 AIRLINES2                                                                                                                                        TOP 4 AIRLINES2

                                                                                          HIGH
                      AIRLINE BRAND                                                                                                                                           AIRLINE BRAND
                      RECOGNITION                                                                                                               LOW                             RECOGNITION

                                                                                                         International          Domestic
                                                                                                             23%                                      International
                                                                                                                                  20%
                      PROPORTION OF                                       Domestic
                                                                            77%
                                                                                                                                                          80%                PROPORTION OF
                      DOMESTIC VS.                                                             US                                           Europe                             DOMESTIC VS.
    Customer habits

                      INTERNATIONAL TRAVEL1                                                                                                                           INTERNATIONAL TRAVEL1

                      CONCENTRATION                                                                                                                                          CONCENTRATION
                                                                                              24%                                               6%
                      OF FLIGHT ROUTES 1,3                                                                                                                               OF FLIGHT ROUTES 1,3

                      MULTI-LEGGED
                      SEGMENTS                                                       FEWER                                                  MANY                              MULTI-LEGGED
                                                                                                                                                                                 SEGMENTS
    Source: 1 Industry research 2 OAG Analyser, based on number of seats for 2019; 3 Top 10 from-to city pairs - % of total passengers

                                                                                                                       25                                                       INVESTOR PRESENTATION
2 SUSTAINABLE SCALE: INDUSTRY-LEADING TECHNOLOGY
POWERFUL, … ARE POWERING REAL
REUSABLE PLATFORM... SCALE ADVANTAGES
1 platform
261
websites / apps
1.7 BILLION
monthly searches
340,000 PEAK
searches per second
160 MILLION Working with
supplier searches 660 AIRLINES
per day
… AND INDUSTRY LEADING TEAM ...
36 BILLION
DEVELOPMENT TEAM SIZE pricing calculations
per hour
eDO OTA A OTA B OTA C OTA D OTA E OTA F OTA G
Source: Development Team Sizes researched via LinkedIn, Data pulled 21.10.2019, “Developer” or “Engineer” profiles at the most relevant European flight-centric OTAs.
26 INVESTOR PRESENTATION2 BRAND STRENGTH REDUCES RELIANCE ON SEARCH & META-SEARCH
Our scale advantages make us both a better partner to and less reliant
long-term on the metas versus competition, especially fragile tier 2 OTAS
eDO IS THE OTA WITH THE HIGHEST AVERAGE MONTHLY META DEPENDENCY BY
BRANDED QUERIES IN GOOGLE IN ALL EUROPEAN COUNTRIES MARKET, INDEXED
4
3
BRAND QUERIES FOR EXPEDIA
BLEND CUSTOMERS LOOKING 3
FOR HOTELS AND FOR FLIGHTS
1 1 1
eDO Expedia Lastminute Logitravel Atrapalo Kiwi Travelgenio ETI UK Germany France
Top 4 competitor eDreams ODIGEO leading local brand
Source: webceo October 2019 Source: Industry data
27 INVESTOR PRESENTATION3
1.3 eDO’S ACCELERATING GROWTH STRATEGY
FROM TO VISION
Flight-centric, Flight-centric, “Your Trusted
Transactional Service Travel Relationships Travel Companion”
Excel in online flights with best Leverage strategic flights position Leverage customers relationships
prices and flight options to engage with customers through and best E2E mobile exp to address
full travel journey complete leisure travel needs
Significant customer needs
/ pain points unaddressed Build long-term customer Reinvest strong FCF to grow Ebitda
relationships with Prime through M&A and organically
subscription membership program
To continue to innovate and be best-in-class in online flights and leverage that strategic
position to grow organically and through M&A, driving strong profitable growth in the medium
term (three years), while creating an option for substantial long-term growth
28 INVESTOR PRESENTATION3.1 PRIME IS DRIVING SUSTAINABLE LONG-TERM IMPACT
1.3 It is not a self-selection of existing heavy users, it generates incremental bookings for every cohort
UPLIFT IN 12 MONTH REPEAT BOOKINGS - COHORT ANALYSIS (INDEXED TO 1x)
NEW USERS LIGHT USERS HEAVY USERS
NO PURCHASES OF ANY KIND IN THE ONE NON PRIME PURCHASE IN THE +1 NON PRIME PURCHASES IN THE
11 MONTHS BEFORE CONTROL PURCHASE 11 MONTHS BEFORE CONTROL PURCHASE 11 MONTHS BEFORE CONTROL PURCHASE
2.65x
+165%
+95% 1.95x +45%
1.45x
1x 1x 1x
Non Prime Prime Non Prime Prime Non Prime Prime
Source: Data Science analysis, France
29 INVESTOR PRESENTATION3.1 OVERWHELMING RESPONSE
1.3 Strong performance of the main KPIs FROM CUSTOMERS IN OUR KEY MARKETS
SHARE OF VOLUNTARY REVENUE RENEWAL
22% BOOKINGS
Prime has become
2% CHURN RATE
Very few customers 65% RATE
Percentage of
3% 64%
requested to subscriptions renewed
26%
a high share of the
total bookings made unsubscribe and collected after
in the main markets from Prime 12 month
NET PROMOTER SHARE OF REPEAT
+16%
SCORE (NPS)
NPS of Prime
3.7x BOOKINGS IN APP
Higher share of app
1.7x
bookings for Prime vs.
+24%
members is higher
than for non-prime non-Prime members
Notes: Share of bookings and App repeat share refer to current KPIs as of mid-October; Renewal Rate if FY to date Apr-Oct; NPS is last 3 month average
30 INVESTOR PRESENTATION3.2
1.3 COVERING THE WHOLE CUSTOMER JOURNEY:
CUSTOMER PAIN POINTS AND NEEDS
After the booking,
we manage
the check in:
Planning the
Convenient fast booking
perfect trip:
process and receive all
Price alerts, week-
your boarding passes in
end deals, travel Book one place independent of
anniversary, etc...
airline, they automatically
appears in the App and
sent via email
CUSTOMER
Plan Prepare
JOURNEY
Exclusive deals
on other products:
Real time information ● Post-booking:
about the flight & in- Hotel, Car
Travel
destination activities ● Travel preparation:
All flights status Bag, Seat
available in the APP, ● In destination:
Push notifications sent Ground Transport,
when status changes, Activities, Restaurants
access to boarding
passes...
31 INVESTOR PRESENTATION3.3
1.3 INCREASING OUR COMPETITIVENESS IN FLIGHT
REVENUE DISTRIBUTION ON A € PER BOOKING BASIS
1.8
2.4
Over the recent years we have
7.6 focused on providing more and
3.0 2.1 6.6 better product / service to our
2.7
6.2 6.6 customers.
5.8
14.1 This has been instrumented
17.4 through strong investments in
19.3
revenue diversification which
22.6 20.7 have resulted in i) an improvement
-38% of our competitiveness in flights
FY16- via reduction of services fees and
9MFY20 ii) higher value for our customers
26.2
21.2 as the increase in the RM per
15.2 booking (+€5) proves.
11.6 12.6
+126%
FY16- 9MFY20
FY16 FY17 FY18 FY19 9M FY20
Diversification revenue Classical Revenue - customer Classical revenue-supplier Advertising & Meta clicks-outs
Source: eDO Financial Statements
32 INVESTOR PRESENTATION3.3
1.3 REVENUE DIVERSIFICATION:
SUBSTANTIAL MARKET OPPORTUNITY
GLOBAL FLIGHT ANCILLARIES MARKET GLOBAL PACKAGES MARKET
Gross sales in 2018 13% increase over 2017 Gross sales in 2018 4-5% CAGR expected 2018-22
€81Bn €185Bn
FLIGHT ANCILLARIES DYNAMIC PACKAGES (DP)
MARKET Large and fast growing market Fast growing market with lower
SIZE Help us to differentiate vs airlines online penetration vs. flight
and increase customer ownership Our scale in flight provides us
with a large advantage
Still some ample room for us to
grow our ancillaries revenue over Fragmented market with many players
coming years with new products focused on capturing demand
and customers touchpoints in mostly one single market
Growing vs Hotels and traditional
Tour Operators
Source: IdeaWorksCompany.com Source: Statista
33 INVESTOR PRESENTATION3.3 EXAMPLE OF A HOTEL SEARCH IN NYC
Members will have special Member-only deals, as well as always-on vouchers
SEARCH PAYMENT PAGE LEADING HOTEL OTA PRICE
RESULTS PAGE AFTER APPLYING PRIME10 VOUCHER
(10% EXTRA DISCOUNT)
SAME DATES, SAME HOTEL,
SAME ROOM… WE ARE 275€ CHEAPER
XXX OTA
34 INVESTOR PRESENTATION3.3 HOTELIERS ARE WILLING TO INCENTIVISE
US FOR HIGH VALUE CUSTOMERS
Our Dynamic Packages customers
book more in advance and drive
low cancelation...
52%
Book with Cancel their
more than 31 4% Dynamic Package
days in advance booking
VS
… compared with
the average in 35%
Book with
the hotel industry 19% more than 31 Cancel their
days in advance hotel booking
Source: Phocuswright
35 INVESTOR PRESENTATION3.3 WE HAVE SUCCESSFULLY GROWN
SHARE OF HOTELS SOURCED DIRECTLY
Since the launch In only 2 years, our hotel Increasing the share of own inventory hotels has allowed
of our own inventory, inventory has grown us to significantly increase our price
we have signed to represent ~30% competitiveness in Dynamic Packages
>54k hotels of DP bookings
28% ...by
reducing
24%
23% our service 36%
28%
20% fees in 27% 19% 17% 11%
Dynamic 11% 5%
17%
Packages
14% Q3 Q4 Q1 Q2 Q3 Q4 Q1 Q2
FY18 FY19 FY20
6%
...While
growing
3% +6% YoY our +6%
Revenue
Margin per
Q3 Q4 Q1 Q2 Q3 Q4 Q1 Q2 booking at
the same time
FY18 FY19 FY20 FY19 FY20
Source: eDO BI and internal analysis
36 INVESTOR PRESENTATION4
1.3 A BUSINESS MODEL THAT HAS PROVEN
A STRONG CASH GENERATION
(IN EUROS MILLION) FY15 FY16 FY17 FY18 FY19 1. EBITDA - Capex annual cash flow improved by
RECURRING EBITDA 90,5 95,8 107,3 118,3 119,6 €36m between FY15 and FY19 from €55m to
€91m.
CAPEX (35,2) (30,5) (29,5) (28,9) (28,8)
REC. EBITDA - CAPEX 55,3 65,3 77,8 89,4 90,8 2. WC items have contributed to generate cash,
on average €14 million annually in the four
NWC (*) 8,5 (2,3) 36,0 14,4 -
years up to FY18. In FY19 WC absorbed the one-
TAXES (6,0) (4,8) (7,4) (8,1) (13,8) off impact of accelerating the change in the
FINANCIAL EXPENSES (43,1) (40,3) (40,9) (40,4) (27,7) business model.
RECURRING FCF 14,7 17,9 65,5 55,3 49,3 3. The successful refinancing has allowed us to
WC INVES. IN CHANGE improve the recurring FCF by c.€13m per year.
- - - - (30.0)
OF REVENUE MODEL
DEBT REPAYMENTS 0,1 (0,7) (52,7) (10,9) (7,1)
4. A significant amount of that recurring FCF
has been reinvested into different initiatives to
REFINANCING / IPO (18,1) - - - (33,7) improve the robustness of our business in the
RESTRUCTURING (8,6) (2,5) (1,0) (13,1) - long term.
OTHER NON RECURRING (12,3) (4,5) (0,3) (3,3) (1,2) 5. Despite those investments and the significant
NON- RECURRING FCF (38,9) (7,7) (54,0) (27,3) (42,0) FY19 WC headwinds total cash has increased
CASH VARIATION (24,2) 10,2 11,5 28,0 (22,7)
by €30m between FY15 and FY19.
TOTAL CASH 121,8 132,0 143,5 171,5 148,8 6. Recurring FCF to EBITDA above 40%
RECURRING FCF TO EBITDA 16% 19% 61% 47% 41% the last three years
(*) Includes operating NWC variation as well as non cash items impact to show actual cash variation.
Source: eDO Financial Statements
37 INVESTOR PRESENTATION4
1.3 STRONG BALANCE SHEET AND RETURNS
Net leverage reduced by 30% and Adj. Net Income doubled in only 3 years
ROBUST DELEVERAGING PROFILE … AND DELIVERING STRONG RESULTS (**)
NET DEBT (€M) ADJUSTED NET INCOME (€M)
329.1
-13%
+100%
285.3 282.7 40.2
253.8
FY16 FY17 FY18 FY19 31.6 32.3
NET LEVERAGE RATIO (*)
20.1
-30%
3.4
2.7
2.4
2.1
FY16 FY17 FY18 FY19 FY16 FY17 FY18 FY19
Source: eDO Financial Statements
(*) Net Leverage Ratio: means the total amount of outstanding Net Financial Debt on a consolidated basis divided by “Adjusted EBITDA”. This measure offers to the reader a view about the capacity of the Group to generate enough resources to repay the Gross Financial Debt, also considering the
available cash in the Group.
(**) Adjusted Net Income: means our IFRS net income less certain share-based compensation, restructuring expenses and other income and expense items which are considered by management to not be reflective of our ongoing operations. Adjusted Net Income provides to the reader a better view
about the ongoing results generated by the Group.
38 INVESTOR PRESENTATION5
1.3 SUBSTANTIAL GROWTH UPSIDE AND OPTIONALITY TO BASE CASE
OUR PLAN DRIVERS OPTIONALITY
Taking advantage of a growing market.
Strong position in Metas. Increase in offer of in-destination services
Bookings Virtual interlining (VIN) development with in-house resources. Further VIN investment
Investments in cheap channels materialising
Further technical conversion improvements
Continuous investments in reduction of Classical Customer Revenues
to keep driving value for both customers and eDO and increasing M&A
competitive pressure to sub-scale competitors
Revenue diversification keeps being a key driver.
Current Prime model further penetration in Spain and Germany,
New Prime features launched
and rollout in the UK. in all markets.
Revenue Continuous investments in reduction of Classical Customer Revenues Further DP and other
margin to keep driving value for both customers and eDO and increasing product developments
competitive pressure to sub-scale competitors.
Doubling Dynamic Packages (DP) attachment rate
M&A
Improvement of acquisition cost per booking index following cheap
channels focus and effect of Prime .
All of the above will have a positive
EBITDA Decrease of other variable costs following cost optimisation measures impact on EBITDA
(e.g. CS outsourcing).
Fixed cost control.
Given our business model, most improvements at EBITDA level drop New refinancing if market conditions are
Recurring straight to Free Cash Flow as relevant cash out flows grow less favourable
FCF (CapEx) or have room to decrease depending on market conditions
M&A
(Interest)
39 INVESTOR PRESENTATION5
1.3 MORE DETAIL ON GROWTH MODEL
DRIVER KPI FY21 FY22 FY23
Market growth
Basis for growth is an OTA flights
Volume market growing at 1-2% plus our
own growth on top of that based on
eDO growth market share gains within OTAs
(superior end-to-end customer
Revenue experience, more loyalty and repeat
driven by Prime), and growing
Revenue diversification
outside of the pure flights market as
Margin we sell a more diversified basket of
Prime
products
Classical business EBITDA expected to grow very
healthily broadly in line with FY20
Variable costs guidance but less than volumes, as
Cost base we prioritise the strategic objective
Fixed costs
of continuing to grow scale and
dominate the market, and therefore
meaningfully reduce service fees on
EBITDA the flight intermediation.
40 INVESTOR PRESENTATIONYou can also read