Investor Presentation Winter 2022 - Freehold Royalties Ltd
←
→
Page content transcription
If your browser does not render page correctly, please read the page content below

Investor
         Presentation
         Winter 2022

freeholdroyalties.com   TSX FRU   Quality Assets • Sustainable Dividends
The Freehold Advantage
                                     Proven Production Platform               A North American Royalty Company                                                             Strong Revenue
                                    15,000
                                               Growth driven by                                                                                                           Well above 5-year
                                              organic drilling and                                          Freehold Canadian Assets                          $300
       Royalty Production (boe/d)

                                                                                                                                                                         historical revenue of
                                             accretive acquisitions                                       2022E production ~9,400 boe/d                                         $130mm

                                    10,000

                                                                                                                                                        $mm
                                                                                                                 Freehold US Assets
                                                                                                          2022E production ~4,900 boe/d

                                     5,000
                                                                                                                                                                $0
                                                                                                                                                                                       Royalty Revenue
                                                                                                                                                                            US$60 WTI      US$70 WTI     US$80 WTI

      Top Tier North American Portfolio                                                      Near Term Catalysts                                                     Strong Financial Position

                                                                              Consistent dividend growth                                                  Meaningful cash returns
                                                Freehold Core Areas
                                                                                  ▪ Increased dividend past five consecutive                                   ▪ Dividend yield 6.2%
       PV10 Half-Cycle Breakeven

                                      $50
                                                                                    quarters; >220% increase in 12 months
                                      $40                                                                                                                 Conservative use of leverage
                                                                               Growing top tier U.S. production base
              (US$/bbl)

                                                                                                                                                               ▪ Debt to 12-month trailing funds from
                                      $30                                         ▪ 35% of total corporate volumes expected in                                   operations of
Pro Forma Corporate Profile
          Delivering shareholder value from a well positioned royalty portfolio

            2022E revenue and production from Oil & NGL(1)                                                      83% revenue / 60% production

            Q4 2021E production(1)                                                                                  13,500-13,750 boe/d

            2022E production(1)                                                                                     13,750-14,750 boe/d

            Annualized dividend(2) ($0.06 per month)                                                                    $0.72/share

            Dividend yield(2)(3)                                                                                            6.2%

            Enterprise Value(3)(4)(5)                                                                                    $1.9 billion

                                                                                                                                        Winter 2022 | 3

Based on guidance as of November 10, 2021, monthly dividend of $0.06 per share, FRU year end closing price of
$11.65/share, 150.6 million shares out standing, and pro forma long term debt as of September 30, 2021.
Not The Same Old Freehold

                                                                                                                                                                                         2022E
             Increasing Production
             Bringing Revenues      to Time
                                to All Record Levels
                                            Highs                                                                                                                                     14,300 boe/d
                                                                                                                                                                         2018
             ▪    2022E production forecast to be ~14,300 boe/d, higher than                                                                                         11,400 boe/d
                  any period in Freehold’s history                                                                                      2012
             ▪    Organic drilling and bespoke royalty optimization efforts are                                                      7,600 boe/d

                  directing capital to Freehold lands

                                                                              2024E
            Q3-2021                                                       ~14,800 boe/d             Increasing
                                                                                                    IntroducingProduction to Record Levels
                                                                                                                Organic Growth
          11,900 boe/d                                                                              ▪     Without any further M&A, Freehold’s production is forecast to
                                                                                                          generate modest growth over the next several years
                                                                                                    ▪     Freehold can be patient looking for exceptional opportunities to
                               Guidance past 2022 is the average of published analyst estimates           add to our portfolio, or return excess cash flow to shareholders

             Reducing Cash Costs to Historic Lows                                                                                       2012
                                                                                                                                                                         2018
                                                                                                                                      $5.21/boe
                                                                                                                                                                       $5.12/boe         YTD 2021
             ▪    Increased production, and exit from working interest
                                                                                                                                                                                        ~$3.80/boe
                  business, have significantly reduced cash costs
             ▪    Further acquisitions within existing framework, allow us to
                  grow our business with minimal added costs

                                                                                                                                                                                    Winter 2022 | 4

For illustrative purposes and should not be relied on as indicative of future results, assumes midpoint of FRU 2022E production guidance, US$75/bbl WTI, US$13/bbl
heavy oil differentials, US$3/bbl light oil differentials, US$4/mcf NYMEX, $4/mcf AECO. 2021 forecasts assume mid point of FRU 2021 production guidance
Sustainable Production Base & Dividend

            Improving Royalty Netbacks                                                                                                YTD 2021 Realized Price
            ▪     US transactions have added higher value barrels                                                                         OneMap Acq. Pricing
            ▪     Realized price improves materially with recently                                                                      Sep-2021 Acq. Pricing
                  completed US acquisitions
                                                                                                                                                                C$40/boe               C$50/boe      C$60/boe

                                                                                 2022E
                                                                                ~$250mm             Bringing Revenues
                                                                                                    Increasing         to All
                                                                                                               Production  to Time Highs
                                                                                                                              Record Levels
            2012
          $161.7mm
                                                          2018                                      ▪    Corporate revenues more robust than ever, providing exceptional
                                                        $144.5mm                                         optionality to drive shareholder returns
                                                                                                    ▪    With increased oil weighting, Freehold provides significant upside
                                                                                                         to strong commodity price environment

            Introducing
            Dividend    Organic Growth
                     Sustainability and Growth                                                                                                                                                      Nov-2021
                                                                                                                                        2016                                                       72¢ annually
            ▪     Freeholdany
                  Without  hasfurther
                               increased
                                      M&A,its Freehold’s
                                               dividend 5production
                                                          times sinceislate
                                                                        forecast
                                                                            2020 to
                                                                                                                                     54¢ annually
            ▪     generate modest growth
                  Dividend increases reflectover   the next several
                                              improvement           years prices,
                                                             in commodity
            ▪     increasedcan
                  Freehold  capital
                               be patient
                                    spendinglooking
                                               on our
                                                    forroyalty
                                                        exceptional
                                                               lands,opportunities
                                                                      and            to
                  add to our portfolio,
                  enhancements   we haveor continue
                                            made withto return
                                                        North American
                                                                capital to acquisitions
                                                                           shareholders

                                                                                                                                                                                                  Winter 2022 | 5

For illustrative purposes and should not be relied on as indicative of future results, assumes midpoint of FRU 2022E production guidance, US$75/bbl WTI, US$13/bbl heavy oil
differentials, US$3/bbl light oil differentials, US$4/mcf NYMEX, $4/mcf AECO. 2021 forecasts assume mid point of FRU 2021 production guidance. YTD values reflect data as of Q3-2021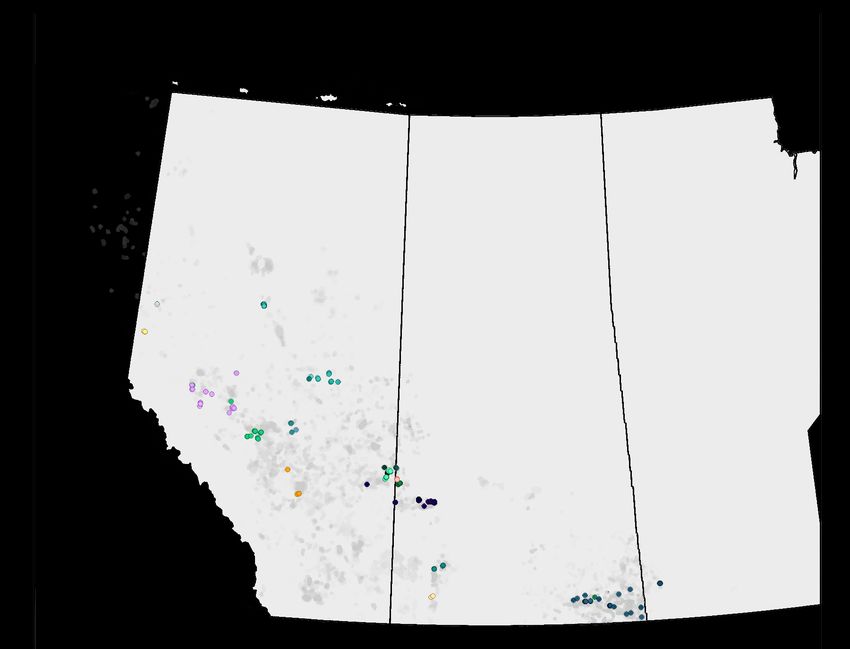
Why the US?
          The rationale behind recent acquisitions

          More Opportunity                                                                          Future Upside – Remaining Drilling Inventory
           ▪ 70% of US land in major oil and gas
             producing states¹ is privately owned vs.
                                                                                                                                                                      20,000     Bubble size represents total
             only ~25% in Canada (WCSB)                                                                                                                              locations   remaining drilling inventory

           ▪ 650 million acres of mineral title in the
             US¹ vs. 270 million in Canada (WCSB)

                      Canada Land                                   US Land
                      Composition                                 Composition¹
                                                                                                                                   Permian
                                                                                                                                    Basin

                                                                                                                                                                                       Montney
                                                                                                                                                   Eagle                         Cardium
                                                                                                                                                   Ford                                     Clearwater

                 Mineral Title (25%)                            Mineral Title (70%)                    N. Dakota Bakken
                 Federal/Provincial (75%)                       Federal/State (30%)

                                                                                                                                                                                              Winter 2022 | 6

¹included states are those with significant proved oil reserves; Texas, Oklahoma, Louisiana, Nevada, North Dakota, Colorado, Wyoming, Pennsylvania, Ohio & West Virginia
Source: Company Reports, Enverus, Wood Mackenzie and Freehold internal estimates
Why the US?
          The rationale behind recent acquisitions

          More Capital Spending                                                                                       More Production
           ▪ Over last 10 years, 8 times the capital spending                                                           ▪ US oil production is almost 3 times, and gas
             in the US vs. Canadian upstream                                                                              production is almost 5 times Canada’s

                    $350                                                                                                        14                                                       140

                    $300                                                                                                        12                                                       120

                    $250                                                                                                        10                                                       100

                    $200                                                                                                         8                                                       80

                                                                                                                       mbbl/d

                                                                                                                                                                                               bcf/d
           US$bln

                    $150                                                                                                         6                                                       60

                    $100                                                                                                         4                                                       40

                     $50                                                                                                         2                                                       20

                      $0                                                                                                         0                                                       0
                           2011 2012 2013 2014 2015 2016 2017 2018 2019 2020 2021                                                    2011 2012 2013 2014 2015 2016 2017 2018 2019 2020
                                                                                                                        Source: EIA
                           U.S. Capital Spending              Canadian Capital Spending                                               US Oil      Canadian Oil     US Gas       Canadian Gas

                                                                                                                                                                                 Winter 2022 | 7

Source: IHS and Canadian Association of Petroleum Producers. Canadian capital spending includes oil sands spending, Company Reports
US Expansion – a Measured Approach
                                                                                                  Acres    Value                                                          Realized
                                                             Purchase       Gross       % Min.                       2021E     2022E      CF        Prod.
                                               Acquisition                                        Core     Future                                               Liquids    Pricing
                                                             (C$mm)         Acres        Title                      (boe/d)   (boe/d)    Mult.    (C$k/boe/d)
                                                                                                 /Tier 1    Dev.                                                          (C$/boe)

                                               Pre-2021 &
                       North                                   $13          65,000      100%       95%      42%        160      175      6.0x        $74         75%         $56
                                               Tuck-Ins
                       Dakota                  Jan-2021
                                                               $73         400,000       90%       39%      48%       1,150    1,500     6.3x        $64         55%         $47
                                               Diversified
                                               Jul-2021
                                                               $19          63,000       92%       54%      64%        100      150      7.2x       $127         76%         $57
                                               Diversified
                                               OneMap          $68         166,000       99%       76%      77%        375      575      7.7x       $118         76%         $59

                                               Sep-2021
                                                               $227         92,000       0%        100%     48%       2,250    2,500     5.0x        $91         77%         $55
                                               Eagle Ford
                                               Total          $400         786,000      82%        73%      54%      4,035     4,900     5.7x        $92         76%         $55

                                                                        5,000

                                                                        4,000
                                       Texas
                                                                boe/d
                                                                        3,000

                                                                        2,000

                                                                        1,000

 Note: Freehold has royalty exposure                                       0
 in 6 other states (Colorado,                                              Jan-19         Jan-20         Jan-21      Jan-22     Jan-23           Jan-24         Jan-25
 Louisiana, New Mexico, Oklahoma,
 Pennsylvania, Wyoming)                                                         Other   Jan. 2021 Acq.       Jul. 2021 Acq.   OneMap (Oct. 2021)           Sept. 2021 Acq.

                                                                                                                                                                  Winter 2022 | 8

Source: Company Reports
Overview of US Portfolio
         Production forecasts for 2022

                                                               Marathon (52%)        ▪ 2021E production of 2,100 boe/d (68% liquids)
                                                               Pioneer (6%)
                                                               ConocoPhillips (4%)   ▪ Growth to 4,900 boe/d in 2022E (70% liquids)
                       ~4,900                                  Exxon Mobil (4%)
                                                                                     ▪ Portfolio represents ~35% and ~40% of total
                       boe/d                                   EOG Res. (4%)
                                                               Petro-Hunt (3%)
                                                                                       production and funds flow, respectively
                                                               Whiting Pet. (2%)
                                                                                     ▪ Exposure to 5,500 producing wells and 100 royalty
                                                               Other (25%)
                                                                                       payors, comprised of well capitalized producers
                                                                                       – Permian (Delaware/Midland) and Eagle Ford basins
                                                              Eagle Ford (58%)
                                                                                         represent 90% of the total value of the US

                                                              Midland (16%)          ▪ 70% of production is from investment grade payors,
                        US                                    Delaware (14%)           and 10% is from private payors
                       Basins                                 Bakken (7%)
                                                                                     ▪ 18 rigs active in November 2021 on Freehold’s US
                                                              Haynesville (2%)
                                                                                       royalty acreage
                                                              Other (3%)
                                                                                       –   3.1% of the active horizontal rigs operating onshore US

                                                                                                                                         Winter 2022 | 9

Source: Baker Hughes North American Rotary Rig Count as of November 24, 2021
North American 6.2 mm gross royalty acres
Portfolio Overview 2022E production ~9,400 boe/d
▪ Over the last 12-months, Freehold has grown
its US portfolio from 200 boe/d to 4,900 boe/d
in 2022E ▪ Entered the US in 2019 with
transactions in North Dakota
▪ North American portfolio provides diversity to ▪ Expanded footprint into Eagle
Realized pricing Ford, Permian, Haynesville &
nine other basins in Jan-2021
US benchmarks & Gulf Coast pricing provide
significant upside to Freehold’s netback ▪ Three transactions in Q3 & Q4
2021 adding 3,225 boe/d in
Royalty payors
Eagle Ford & Permian basins
350 industry payors across Canada and the US
with no material concentration risk
Commodity pricing
60% oil/liquids and 40% natural gas (production)
Exposure to diverse oil and gas basins
No material concentration risk associated with
one specific payor or oil and gas play
(five provinces & eight states)
0.8mm gross drilling unit acres
2022E production ~4,900 boe/d
Winter 2022 | 10
Source: Company Reports. 3,225 boe/d is 2022E estimate for Q3 & Q4-2021 transactions.North American Portfolio Overview
US Production CAN Production Summary Statistics
100% 100% Canada US Total
Top 4 areas ~90%
Gross Acres (mm) 6.2 0.8 6.9
80% 80% 2022E Production (boe/d) 9,400 4,900 14,300
Top 6 areas ~70%
2022E Production (%) 65% 35% 100%
60% 60% Natural gas (%) 46% 30% 40%
% Inv. Grade ~15% ~70% ~35%
% Private ~45% ~10% ~35%
40% 40%
# of Payors 250 100 350
Current # of Rigs on Assets 7 18 25
20% 20% # of Producing Wells 11,000 5,500 16,500
Average Realized Price (YTD 2021, C$) % Change
Oil ($/bbl) $70 $84 +20%
0% 0%
Liquids ($/bbl) $45 $32 (40%)
Natural Gas ($/mcf) $2.85 $4.30 +53%
Total ($/boe) $44 $56 +27%
Winter 2022 | 11
Source: Company Reports. Investment grade revenue only accounts for public payors. YTD assumes prices as of
October 31, 2021. Table columns may not add due to rounding. Rig counts are current as of December 6 th, 2021.Improved Economics
Freehold’s business remains robust across a broad price range
Post Dividend
~$30mm Free Cashflow ~$150mm ▪ At current commodity price levels,
Freehold able to deliver returns to
shareholders several ways
US$40WTI Oil Price US$90WTI
▪ US$1/bbl change in WTI
represents ~$2.5mm in funds from
operations
~75% Payout Ratio ~40%
▪ $0.25/mcf change in AECO
represents ~$1.6mm in funds from
US$40WTI Oil Price US$90WTI
operations
▪ At forecasted commodity price
assumptions dividend remains
0.5x 2022E Exit Net Debt Cash Surplus below low end of 60% dividend
target with upside in 2022
Oil Price
▪ Net debt levels well belowStrong ESG Performance
ESG values continue to remain integral to Freehold’s business
Environmental Social Governance
Emissions Equity, Diversity & Inclusion Board of Directors
▪ Factoring emissions intensity into ▪ Focus on training and awareness ▪ 75% of directors are independent
acquisition candidates for leadership and employees
▪ 30% gender diversity by 2025
▪ Top ESG rating amongst E&P ▪ Full audit of HR policies and
procedures to ensure best ED&I ▪ Board diversity target in line with
companies by Sustainalytics practices are implemented peer group
▪ 2021 acquisitions ESG accretive ▪ Developing internal committee to
▪ Completed analysis of emissions of further develop ED&I strategy
3rd party producers
Community Support Compensation
▪ Achieved net zero Scope 1 and 2
emissions through purchase of ▪ Robust community support ▪ 97% approval of ‘say on pay’
program in 2021 focusing on
carbon offsets mental health ▪ Newly adopted compensation
measures linked to ESG
Diversification ▪ Multi-year focused community performance
support strategy moving forward
▪ Hired new VP of Diversified Royalties
▪ Thematic programs allow Freehold ▪ 67% of annual compensation at risk
to identify and act on low-carbon
to target initiatives both internally for CEO
opportunities and position for the
future of energy and externally
Winter 2022 | 13Multi-Year Changes to Portfolio
Freehold’s Evolution 2022E Production Breakdown
▪ Canadian portfolio has been energized with Eagle Ford (20%)
a return of 3rd party capital with production Permian (10%)
growth to largely offset declines Bakken (2%)
▪ Build-out of the US portfolio adds improved Viking (10%)
netbacks and growth profile, and Freehold SE Sask. (8%)
has seen material improvements in several Mannville Oil (9%)
key operating metrics Cardium (8%)
▪ Freehold has transitioned its portfolio to Clearwater (2%)
effectively 100% mineral title and royalty Deep Basin (11%)
production Other (20%)
3 Year Average 2022E % Change
(2017 – 2019)
Royalty Interest Production (boe/d) 10,650 14,300 +34%
Working Interest Production (boe/d) 826 57 (93%)
US Production Weighting (%) 2% 35% +1,650%
Winter 2022 | 14
For illustrative purposes and should not be relied on as indicative of future results, 2022E forecasts assumes midpoint of FRU 2022E production
guidance, US$75/bbl WTI, US$13/bbl heavy oil differentials, US$3/bbl light oil differentials, US$4/mcf NYMEX, $4/mcf AECO.Why Own Freehold
Strong Balance Quality Long
High Margins Sustainable Sheet, Low Risk Duration Assets,
Business Multi-year Upside
▪ Greater than 97% ▪ Dividend increased five ▪ Q3-2021 net debt to ▪ Positioned in the top tier
operating margin provides times in last 12 months trailing funds from oil plays – Eagle Ford,
Freehold the ability to pay reflecting improved operations 0.5x and Permian, Clearwater,
a meaningful dividend commodity prices and target net debt to funds Viking and Bakken
across all commodity confidence in our from operations ofContinued Strategy Execution
We remain committed to executing our North American strategy
Continue to maintain
Bigger, better Acquisition environment
low-risk identity.
Freehold. Royalty remains robust,
Sustainable debt,
portfolio positioned to improved portfolio
dividend levels enables
generate record allows Freehold to
Freehold the ability to
volumes and funds flow remain patient and
provide immediate
in Q4-2021 and beyond opportunistic
returns to shareholders
Remain in early stages Valuation remains
of Freehold’s North compelling. Believe
American execution. current share price
Multiple near-term levels offer an attractive
catalysts expected in entry point for
2022 shareholders
Winter 2022 | 16Supplemental
Information
freeholdroyalties.com TSX FRU Quality Assets • Sustainable DividendsThe Royalty Advantage
Freehold provides a lower risk/return proposition than traditional E&P’s
Environmental, Social,
Financial Strength, Low Risk Diversified Royalty Portfolio
Governance
▪ Strong operating margins, enable ▪ Diversified North American ▪ Our approach to ESG is rooted in
lower breakeven commodity portfolio with exposure to our collective desire to provide a
prices, enhancing the Permian, Eagle Ford, Viking, long-term value proposition to
sustainability of payout Clearwater, Bakken, Mississippian, our shareholders
▪ Q3-2021 corporate netback and Cardium oil plays plus natural ▪ Royalties offer no exposure to
higher than $46/boe, >97% gas plays targeting the Spirit environmental pressures
operating margin River, Montney and Haynesville ▪ Expect to update our ESG
▪ Ability to grow the dividend, and via well funded producers strategy through a sustainability
generate meaningful free funds ▪ 6.2 million royalty acres in report later in 2021
flow at in the current commodity Canada, 0.8 million gross drilling ▪ Freehold has strong leadership,
price environment units in the U.S. an engaged and idea rich
▪ Financial flexibility with debt to ▪ Diversified payors provides workforce, and a supportive and
funds from operationsRoyalties vs. Exploration and Production Companies
Royalties provide lower costs and higher returns to shareholders
A Working Interest Barrel A Royalty Interest Barrel
Operating netback Operating netback
▪ The royalty model maintains a ~ 60% of gross revenue ~ 100% of gross revenue
material operating netback
advantage over traditional
E&P’s 100%
15 %
▪ Able to generate free funds flow Royalties Paid 80%
at lower commodity prices
25 %
Operating Costs
60%
▪ Q3-2021 corporate netback Operating
$46.60/boe Netback 40%
▪ Freehold maintains a >95%
60%
Operating Netback
100% 20%
operating margin enabling more (60% of gross revenue) of gross revenue
return to shareholders 0%
Winter 2022 | 19Dividend Sustainability
Freehold has paid out $1.7 billion in dividends since initial IPO
▪ Freehold announced a 20% dividend 100%
increase from $0.05 to $0.06 per 90%
month as part of Q3-2021 results 80%
▪ Forecast funds from operation in 2022 70% Stated Payout Range
has our dividend positioned slightly
Payout %
60%
below 60% payout range 50%
40%
▪ At current commodity price levels,
Freehold is able to pay a meaningful 30%
dividend with potential to grow as 20%
funds from operations improve 10%
▪ Freehold has increased its monthly 0%
Q3-18
Q4-18
Q1-19
Q2-19
Q3-19
Q4-19
Q1-20
Q2-20
Q3-20
Q4-20
Q1-21
Q2-21
Q3-21
dividend the last five quarters from
$0.015/share to $0.06/share
Winter 2022 | 20Strong Balance Sheet
Freehold remains committed to
maintaining leverage at levels
well below 1.5x debt to FFO
▪ Freehold exited Q3-2021 with 5.0x
Net Debt to Funds from Operations
net debt to trailing funds from 4.5x
operations of 0.5x 4.0x
3.5x
▪ At current commodity price
levels and the revised dividend 3.0x
level, Freehold still able to pay 2.5x
down debt or pursue 2.0x
acquisitions with free funds 1.5x
▪ Freehold recently amended its 1.0x
credit facility with an 0.5x
unchanged committed 0.0x
revolving 3-year facility at
F9-2021
2019
2010
2011
2012
2013
2014
2015
2016
2017
2018
2020
$285 million
Sector Average Freehold
Winter 2022 | 21
Sector average sourced from Research estimates
Sector average reflects Canadian upstream producersHistorical Canadian Drilling Results
Drilling (gross wells)
YTD-2021 2020 2019 3rd party spending split
Teine Energy 38 77 108 relatively evenly between
Alberta and Saskatchewan
Tamarack Valley 31 15 n/a
Bonterra Energy 30 17 19
2019 Drilling
Surge Energy 30 26 26
Deep 2020 Drilling
Tourmaline Oil 18 n/a n/a YTD 2021 Drilling
Basin Clearwater Freehold Lands
Crescent Point 13 18 25 Play Outlines
Whitecap Resources 13 12 26
Mannville
Karve Energy 11 5 n/a Oil
% of Total 46 46 32
3rd Party
Development YTD-2021 2020 2019 2018
FRU lands Viking
FRU Drilling Cardium
650 685 1,100 1,300
Capital ($mm) S.E. Sask.
% of Total WCSB
7% 7% 7% 8%
Drilling Capital
Shaunavon
Winter 2022 | 22
Source: Company Reports, CAPP. 3rd party capital development estimates assume average exploration and
development well costs per play times number of locations drilled. YTD values reflect data as of Q3-20212021 Q3 Royalty Drilling Results
Top Canadian Drillers
Gross Wells Net Wells
Teine Energy 17 1.8
Tourmaline Oil 15 0.8
Bonterra Energy 13 0.3
Tamarack Valley 12 0.4
Non-Unit Total 134 5.7
Unit Wells 11 0.1
Total Canadian Wells 145 5.8
Top US Drillers
Gross Wells Net Wells
Marathon 8 0.2
ConocoPhillips 7Industry Drilling vs. Freehold
Freehold’s royalty portfolio has outperformed
the broader Western Canadian Sedimentary
basin as a percent of activity
▪ Despite a slowdown in activity in
western Canada, Freehold has 18,000 25
historically achieved growth in net 16,000
Gross Wells Western Canada
drilling on its royalty lands 20
14,000
Freehold net Wells
▪ Approximately 6% of all spending 12,000
15
in Western Canada has occurred on 10,000
Freehold lands over the past five
8,000
years 10
6,000
▪ Freehold’s royalty portfolio has 4,000 5
materially outperformed the 2,000
broader Western Canadian
0 0
Sedimentary Basin
2010
2011
2012
2013
2014
2015
2016
2017
2018
2019
2020
2021E
▪ Growth in net wells reflects the
Western Canadian Drilling Freehold Net Drilling
quality of Freehold’s underlying
royalty portfolio
Winter 2022 | 24
Source: Canadian Association of Energy Contractors
Forecast based on Petroleum Services Association of Canada, and Freehold Q3-2021 results.Viking Dodsland
12 years of inventory, with steady production
Freehold Viking Drilling Activity
▪ Initial entrance in 2015 with 8.5% 50%
GORR across 76,000 acres
▪ 12+ years of remaining inventory
– 916 gross future drilling locations, with 25%
756 gross booked at year end 2020
Freehold Lands
– Average drilling pace of 75 wells per year Play Fairway
0%
▪ Royalty Optimization efforts with 2017 2018 2019 2020 2021E
principal operator has resulted in FRU % of Principal Operator FRU % of Industry
increasing market share, including
100% allocation of Q4-2021 budget Viking Net Production (boe/d)
1,500
to Freehold lands
– Expected to add additional 100 net boe/d
by early 2022 1,000
▪ Improved well results due to longer
laterals, in addition to targeting areas 500
with less depletion Jan-2017 Jan-2019 Jan-2021
Actuals Forecast
Winter 2022 | 25Clearwater
160,000 acres of exposure to the top growth areas in Canada
2018 2021
▪ Initial entrance in 2018 with a GORR Nipisi &
2018 2019
Figure
Total/
Ukalta Craigend Average
across 109,000 acres in the Nipisi and Jarvie Lake
Nipisi
Jarvie areas for $12 million Deal size
$12.0 $1.3 $1.3 $7.9 $22.5
Ukalta
(mm) Jarvie, Figure Lake
and Craigend
– Early development was backstopped GORR size 4.0% 5.0% 4.0% 4.5% 4.2% Freehold Land
through a drilling commitment
Total acreage 109,440 5,120 17,280 28,480 160,000
– Asset was acquired by well funded operator
in late 2020, and has seen a significant Clearwater Net Production (boe/d)
increase in capital spending
▪ Freehold added an additional 51,000 600
acres to our royalty position through
acquisitions in the Ukalta, Craigend and 400
Figure Lake areas
▪ Expected to represent a top area of 200
conventional oil growth in the portfolio
0
▪ Freehold sees 600 gross locations within Jan-2019 Jan-2021 Jan-2023 Jan-2025
the play, which translates to more than
10 years of future development Actuals Forecast FRU Evaluation
Winter 2022 | 26
Source: Company Reports, production estimates include Freehold’s internal analysis along with public
operator disclosures. Years of future development assumes current pace of 50 wells drilled per year2021 & 2022E Guidance
Guidance Date
Q4-2021 Annual Average November 10,
2021
▪ Q4-2021 production guidance of Average production boe/d 13,500-13,750
13,500-13,750 boe/d West Texas Intermediate crude oil US$/bbl $82.00
▪ Increased monthly dividend from Edmonton Light Sweet crude oil Cdn$/bbl $95.00
$0.05 to $0.06/share AECO natural gas Cdn$/mcf $5.00
NYMEX natural gas US$/mmbtu $5.00
▪ 2022E production guidance of
Exchange rate US$/Cdn$ 0.80
13,750-14,750 boe/d
Guidance Date
▪ 2022 WTI price forecast 2022E Annual Average November 10,
US$75.00/bbl 2021
Average production boe/d 13,750-14,750
▪ 2022 NYMEX natural gas
West Texas Intermediate crude oil US$/bbl $75.00
US$4.00/mcf
Edmonton Light Sweet crude oil Cdn$/bbl $88.00
▪ 2022 AECO natural gas $4.00/mcf AECO natural gas Cdn$/mcf $4.00
NYMEX natural gas US$/mmbtu $4.00
Exchange rate US$/Cdn$ 0.80
Winter 2022 | 27
Source: Company Reports.Safe, Lower Risk Asset Base
2018 2019 2020 F9-2021
Royalty Production (boe/d) 10,718 10,229 9,605 11,118
Acquisitions (millions) $62 $49 $7 $309
Royalty acres (millions) 6.2 6.7 6.3 6.2
U.S. gross drilling unit acres (millions) 0.8
Tax pools (millions) $905 $838 $775
Net debt/funds from operations 0.7x 0.8x 0.9x 0.5x
Winter 2022 | 28Consistent Income Provider
Freehold has provided almost
$33/share over its history to its
shareholders through dividend
payments
$2.50 $50
Cumulative Dividends Per Share
$2.00 $40
Dividends per share
$1.50 $30
$1.00 $20
$0.50 $10
$0.00 $0
2018
2021E
2022E
2000
2001
2002
2003
2004
2005
2006
2007
2008
2009
2010
2011
2012
2013
2014
2015
2016
2017
2019
2020
Annual Dividend Per Share Cumulative Dividend Per Share
Winter 2022 | 29Cash Costs
Freehold has shown a strong trending down in cash costs in 2021
$7.00
▪ Q3-2021 cash costs of $6.00
$2.49/boe facilitate a
strong corporate netback $5.00
for Freehold
Cash Costs ($/boe)
$4.00
▪ Q3-2021 cash costs the
lowest in Freehold’s $3.00
history
$2.00
▪ Reduction in costs reflect
$1.00
disposition of working
interest, lower lending
$0.00
costs and a focus on G&A Q3-19 Q4-19 Q1-20 Q2-20 Q3-20 Q4-20 Q1-21 Q2-21 Q3-21
Operating Costs ($/boe) Interest Expense ($/boe) General & Administrative ($/boe)
Winter 2022 | 30
Cash costs are equal to operating costs + interest expense + G&A costs + share based compensation payments (see non-GAAP Financial Measures)Royalty Production History
Freehold’s royalty production
increased 1% q/q in Q3-2021
with volumes forecast to
increase in Q4-2021
16,000
14,250
14,000 13,625
Royalty Production (boe/d)
12,000 11,137 11,265
10,618 10,946
10,322 10,312 10,139 10,311 10,149 10,315
10,000 9,605
9,150 9,096
8,000
6,000
4,000
2,000
0
Q4-21E
2022E
Q3-18
Q4-18
Q1-19
Q2-19
Q3-19
Q4-19
Q1-20
Q2-20
Q3-20
Q4-20
Q1-21
Q2-21
Q3-21
Winter 2022 | 31
Assumes the midpoint of Q4-2021E production guidance, and the midpoint of 2022E production guidance.Diversified Royalty Payors
Our top payors remain well financed with no significant concentration risk
Winter 2022 | 32Disciplined Acquirer
Freehold will continue to look for opportunities that enhance the resiliency
and durability of our portfolio across all commodity price cycles
Cost Initial Production
Year Area ($ millions) Acquired (boe/d)
2012 AB, SK and BC 60 600
2013 Numerous small acquisitions 10 30
2014 SK/MB/AB 248 1,500
2015 SK/AB/BC 410 2,100
2016 SK/AB 162 1,700
2017 SK/AB 87 420
2018 SK/AB 62 275
2019 SK/AB, US 50 410
2020 US 8 -
YTD 2021 US 400 4,400
TOTAL $1,500 10,895
Winter 2022 | 33Advisories
Forward-Looking Statements
This presentation offers our assessment of Freehold’s future plans and operations as at November 10, 2021 and contains forward-looking information including, without limitation, forward-looking information with regards to the expected terms
and conditions of the proposed acquisition of royalty assets (the "Acquired Assets") in the United States (the "U.S. Royalty Transaction"); the expected timing for closing of the U.S. Royalty Transaction; expected Freehold average net daily
production (including commodity weighting) in the second half of 2021 and for the full year in 2022; expected average net daily production (including the commodity weighting of such production) in the second half of 2021 and for the full year
in 2022 from the Acquired Assets; expected 2021 funds from operations from the Acquired Assets; the number of potential drilling locations associated with the Acquired Assets; the expectation that wells associated with the Acquired Assets
will be economic at US$30/bbl WTI pricing; the expectation that Freehold's U.S. assets will contribute 35% of total production in 2022; the expectation that the Acquired Assets will enhance the sustainability and resiliency of Freehold’s
portfolio; the expectation that following Freehold can deliver production stability, without requiring further acquisitions, providing for increased option value to shareholders in future years; the expectation that Freehold's diversified portfolio
ensures meaningful dividend even in a sub - US$40/bbl WTI environment; the expectation that growing funds flow provides Freehold the flexibility to grow dividend, pay down debt or pursue further value enhancing acquisitions; Freehold's
estimated U.S. 2021 and 2022 average daily production (including commodity weightings and by play); the expected attributes and benefits to be derived by Freehold pursuant to the U.S. Royalty Transaction including the expected enhancing
of Freehold's growth profile, netbacks, free cash flow, liquids weighting, sustainability of Freehold's dividend and environmental, social and governance profile; the expectation that the U.S. Royalty Transaction will be accretive to Freehold's
sustainability and operating margin; Freehold’s intent to return 60-80% of funds from operations to shareholders; Freehold's intent to target debt to funds from operations of less than 1.5x; Freehold's 2021 forecast U.S. average net daily
production; and Freehold's expectation of years of drilling inventory.
This forward-looking information is provided to allow readers to better understand our business and prospects and may not be suitable for other purposes. By its nature, forward-looking information is subject to numerous risks and
uncertainties, some of which are beyond our control, including the impact of the COVID-19 pandemic on economic activity and demand for oil and natural gas, general economic conditions, industry conditions, volatility of commodity prices,
currency fluctuations, imprecision of reserve estimates, royalties, environmental risks, taxation, regulation, changes in tax or other legislation, competition from other industry participants, the lack of availability of qualified personnel or
management, stock market volatility, our ability to access sufficient capital from internal and external sources. The closing of the U.S. Royalty Transaction and the intended public offering of subscription receipts of Freehold could be delayed if
Freehold or the other parties are not able to obtain the necessary regulatory and stock exchange approvals on the timelines anticipated. The U.S. Royalty Transaction and the intended public offering of subscription receipts of Freehold may not
be completed if these approvals are not obtained or some other condition to the closing of the U.S. Royalty Transaction is not satisfied. Accordingly, there is a risk that the U.S. Royalty Transaction the intended public offering of subscription
receipts of Freehold will not be completed within the anticipated time or at all. Risks are described in more detail in Freehold’s annual information form for the year ended December 31, 2020 which is available under Freehold’s profile on
SEDAR at www.sedar.com.
With respect to forward looking information contained in this presentation relating to the H2 2021 and 2022 forecast production and 2021 forecast funds from operations from the Acquired Assets, we have made assumptions regarding, among
other things; future oil and natural gas prices (for the purposes of the estimates in this presentation we have assumed a West Texas Intermediate price of US$65/barrel of oil and a NYMEX natural gas price of U.S.$3.00/MMbtu); future
exchange rates (for the purposes of the estimates in this presentation we have assumed an exchange rate of US$0.78 for every CDN$1.00); that DUCs will be completed in the short term and brought on production; that wells that have been
permitted will be drilling and completed within a customary timeframe; expectations as to additional wells to be permitted, drilled, completed and brought on production in 2021 and 2022 based on Freehold's review of the geology and
economics of the plays associated with the Acquired Assets; expected production performance of wells to be drilled and/or brought on production in 2021 and 2022; the ability of our royalty payors to obtain equipment in a timely manner to
carry out development activities; the ability and willingness of royalty payors to fund development activities relating to the Acquired Assets; and such other assumptions as are identified herein.
You are cautioned that the assumptions used in the preparation of such information, although considered reasonable at the time of preparation, may prove to be imprecise and, as such, undue reliance should not be placed on forward looking
information. We can give no assurance that any of the events anticipated will transpire or occur, or if any of them do, what benefits we will derive from them. The forward-looking information contained herein is expressly qualified by this
cautionary statement. To the extent any guidance or forward looking statements herein constitute a financial outlook, they are included herein to provide readers with an understanding of management's plans and assumptions for budgeting
purposes and readers are cautioned that the information may not be appropriate for other purposes. Our policy for updating forward-looking statements is to update our key operating assumptions quarterly and, except as required by law, we
do not undertake to update any other forward-looking statements.
You are further cautioned that the preparation of financial statements in accordance with International Financial Reporting Standards requires management to make certain judgments and estimates that affect the reported amounts of assets,
liabilities, revenues, and expenses. These estimates may change, having either a positive or negative effect on net income, as further information becomes available and as the economic environment changes.
Winter 2022 | 34Advisories continued
Forward-Looking Statements Continued
You are cautioned that the assumptions used in the preparation of such information, although considered reasonable at the time of preparation, may prove to be imprecise and, as such, undue reliance should not be placed on forward looking
information. We can give no assurance that any of the events anticipated will transpire or occur, or if any of them do, what benefits we will derive from them. The forward-looking information contained herein is expressly qualified by this
cautionary statement. To the extent any guidance or forward-looking statements herein constitute a financial outlook, they are included herein to provide readers with an understanding of management's plans and assumptions for budgeting
purposes and readers are cautioned that the information may not be appropriate for other purposes. Our policy for updating forward-looking statements is to update our key operating assumptions quarterly and, except as required by law, we do
not undertake to update any other forward-looking statements.
You are further cautioned that the preparation of financial statements in accordance with International Financial Reporting Standards requires management to make certain judgments and estimates that affect the reported amounts of assets,
liabilities, revenues, and expenses. These estimates may change, having either a positive or negative effect on net income, as further information becomes available and as the economic environment changes.
Drilling Locations
This presentation discloses anticipated future drilling or development locations associated with the Acquired Assets, all of which are currently considered unbooked locations. Unbooked locations are generated by internal estimates of Freehold
management based on prospective acreage and an assumption as to the number of wells that can be drilled per section based on industry practice and internal review. Unbooked locations do not have attributed reserves or resources. Unbooked
locations have been identified by management as an estimation of the multi-year drilling activities on the Acquired Assets based on evaluation of applicable geologic, seismic, engineering, historic drilling, production, commodity price assumptions
and reserves information. There is no certainty that all unbooked drilling locations will be drilled and if drilled there is no certainty that such locations will result in additional oil and gas reserves, resources or production. Freehold has no control
on whether any wells will be actually drilled in respect of such unbooked locations. The drilling locations on which wells are actually drilled will ultimately depend upon the capital allocation decisions of royalty payors who have working interests in
respect of such drilling locations and a number of other factors including, without limitation, availability of capital, regulatory approvals, oil and natural gas prices, costs, actual drilling results, additional reservoir information that is obtained and
other factors. While certain of the unbooked drilling locations have been de-risked by drilling existing wells in relative close proximity to such unbooked drilling locations, other unbooked drilling locations are farther away from existing wells where
management has less information about the characteristics of the reservoir and therefore there is more uncertainty whether wells will be drilled in such locations and if drilled there is more uncertainty that such wells will result in additional oil
and gas reserves, resources or production. Upon purchase of the Acquired Assets, Freehold will have the reserves associated with the Acquired Assets evaluated by an independent qualified reserves evaluator in accordance with the requirements
of National Instrument 51-101 – Standards of Disclosure for Oil and Gas Activities and it will be determined at such time whether any of the unbooked drilling locations disclosed herein are booked for the purposes of such evaluation with
associated proved or probable reserves.
Conversion of Natural Gas to Barrels of Oil Equivalent (BOE)
To provide a single unit of production for analytical purposes, natural gas production and reserves volumes are converted mathematically to equivalent barrels of oil (boe). We use the industry-accepted standard conversion of six thousand cubic
feet of natural gas to one barrel of oil (6 Mcf = 1 bbl). The 6:1 boe ratio is based on an energy equivalency conversion method primarily applicable at the burner tip. It does not represent a value equivalency at the wellhead and is not based on
either energy content or current prices. While the boe ratio is useful for comparative measures and observing trends, it does not accurately reflect individual product values and might be misleading, particularly if used in isolation. As well, given
that the value ratio, based on the current price of crude oil to natural gas, is significantly different from the 6:1 energy equivalency ratio, using a 6:1 conversion ratio may be misleading as an indication of value.
Winter 2022 | 35Advisories continued
Non-GAAP Financial Measures
Within this presentation, references are made to terms commonly used as key performance indicators in the oil and gas industry. We believe that operating netback, operating income, operating margin, payout ratio, free cash flow and cash
costs are useful supplemental measures for management and investors to analyze operating performance, financial leverage, liquidity and sustainability of our dividend, and we use these terms to facilitate the understanding and comparability
of our results of operations and financial position. However, these terms do not have any standardized meanings prescribed by GAAP and therefore may not be comparable with the calculations of similar measures for other entities. Operating
income is calculated as royalty and other revenue, less operating expenses. It shows the profitability of our revenue streams as it provides the cash margin for product sold after directly related expenses. Operating margin is simply operating
income as a percentage of revenue. Payout ratios are often used for dividend paying companies in the oil and gas industry to identify its dividend levels in relation to the funds it receives and uses in its capital and operational activities.
Freehold’s payout ratio is calculated as dividends paid as a percentage of funds from operations. Free cash flow is calculated by subtracting capital expenditures from funds from operations. In periods where Freehold has no capital
expenditures, this figure is interchangeable with funds from operations. Free cash flow is a measure often used by dividend paying companies to determine cash available for the payment of dividends, reducing debt or available for
investment. Operating netback, which is calculated as average unit sales price less operating expenses, represents the cash margin for product sold, calculated on a per boe basis. Cash costs is a total of all recurring costs in the statement of
income deducted in determining funds from operations. For Freehold, cash costs are identified as operating expense, general and administrative expense, interest expense and share based compensation payments. It is key to funds from
operations, representing the ability to sustain dividends, repay debt and fund capital expenditures. We refer to various per boe figures which provide meaningful information on our operational performance. We derive per boe figures by
dividing the relevant revenue or cost figures by the total volume of oil, NGL and natural gas production during the period, with natural gas converted to equivalent barrels of oil as described above. For further information related to these non-
GAAP terms, including reconciliations to the most directly comparable GAAP terms, see our most recent management's discussion and analysis, which is available on SEDAR at www.sedar.com.
Production
All production disclosed herein is considered net production for the purposes of National Instrument 51-101 – Standards of Disclosure for Oil and Gas Activities, which includes Freehold's working interest (operating and non-operating) share
after deduction of royalty obligations, plus our royalty interests. Since Freehold has minimal working interest production, net production is substantially equivalent to Freehold's royalty interest production. In the second half of 2021 Freehold's
net production from the Acquired Assets is expected to consist of approximately 57% light oil, 20% natural gas liquids and 23% of natural gas. In 2022 net production from the Acquired Assets is expected to consist of approximately 50% of
light oil, 23% of natural gas liquids and 27% of natural gas. In 2021 Freehold's net production from its U.S. assets is expected to consist of approximately 51% light oil, 15% natural gas liquids and 34% of natural gas. In 2022 Freehold's net
production from its U.S. assets is expected to consist of approximately 51% of light oil, 20% of natural gas liquids and 29% of natural gas. In the second half of 2021 Freehold's aggregate net production is expected to consist of
approximately 9% heavy oil, 39% light and medium oil, 10% natural gas liquids and 42% of natural gas. In 2022 Freehold's aggregate net production is expected to consist of approximately 8% heavy oil, 40% light and medium oil, 12%
natural gas liquids and 40% natural gas.
Barrels of Oil Equivalent (boe) ratio: 6 Mcf = 1 barrel
The 6:1 boe ratio is based on an energy equivalency conversion method primarily applicable at the burner tip. It does not represent a value equivalency and is not based on either energy content or current prices. While the boe ratio is useful
for comparative measures, it does not accurately reflect individual product values and might be misleading, particularly if used insolation. As well, given the value ratio, based on the current price of crude oil to natural gas, is significantly
different from the 6:1 energy equivalency ratio, using a 6:1 conversion ratio may be misleading as an indication of value.
Winter 2022 | 36Investor Relations
tf. 888.257.1873
t. 403.221.0833
w. freeholdroyalties.com
freeholdroyalties.com TSX FRU Quality Assets • Sustainable DividendsYou can also read