ACCELERATING CASH RETURNS TO SHAREHOLDERS - CORPORATE PRESENTATION / FEBRUARY 2022
←
→
Page content transcription
If your browser does not render page correctly, please read the page content below

CORPORATE PRESENTATION / FEBRUARY 2022

  ACCELERATING CASH RETURNS TO SHAREHOLDERS
Whitecap Profile – TSX: WCP

         • Shares Outstanding (MM)
                   – Basic                                                           628.3
                   – Fully diluted                                                   636.4

         • Enterprise Value ($B)                                                     $7.3

         • 2022 Guidance (mid-point)
                   – Production (boe/d)                                             131,000
                   – Capital ($MM)                                                   $520

                                               Dividend Increased 33%
                                       • From $0.27 per share to $0.36 per share annually
                                        • Beginning with March dividend, payable in April
Refer to slide Notes and Advisories.

                                                               2
Record Performance in 2021

    • Operational Momentum Results in Strong Financial Performance
                                                                Q4/21      Q4/20    % Change
                                           Production (boe/d)   120,020    63,783     88%
                                              Per (MM) share        189     154       23%
                                           Funds Flow ($MM)      $351      $105      234%
                                                   Per share     $0.55     $0.25     120%

    • Disciplined Capital Spending Drives Significant Free Funds Flow
                                                                Q4/21      Q4/20    % Change
                                       Free Funds Flow ($MM)     $216       $83      160%
                                                   Per share     $0.34     $0.20      70%

    • Balance Sheet Strength is a Strategic Asset
                                                                Q4/21      Q4/20    % Change
                                         Debt to EBITDA ratio       0.9x    2.2x     (59%)
Refer to slide Notes and Advisories.

                                                                3
2021 Reserves Reflect Improved Profitability

          ✓ Significant Reserve Additions
          PDP                          TP        TPP
          53%                          50%       51%
                                                               ➢ Reserve additions along with
                                                                 attractive FD&A metrics
                  ✓ Strong FD&A Metrics                          improves our

          PDP                          TP        TPP              profitability
    $14.95/boe                   $13.67/boe   $11.22/boe

                                                               ➢ Long reserve life and low
              ✓ Growth in NPV per Share                          base decline rate reinforces

          PDP                          TP        TPP
                                                                  sustainability
      $7.51/sh                    $10.80/sh   $15.28/sh

Refer to slide Notes and Advisories.

                                                           4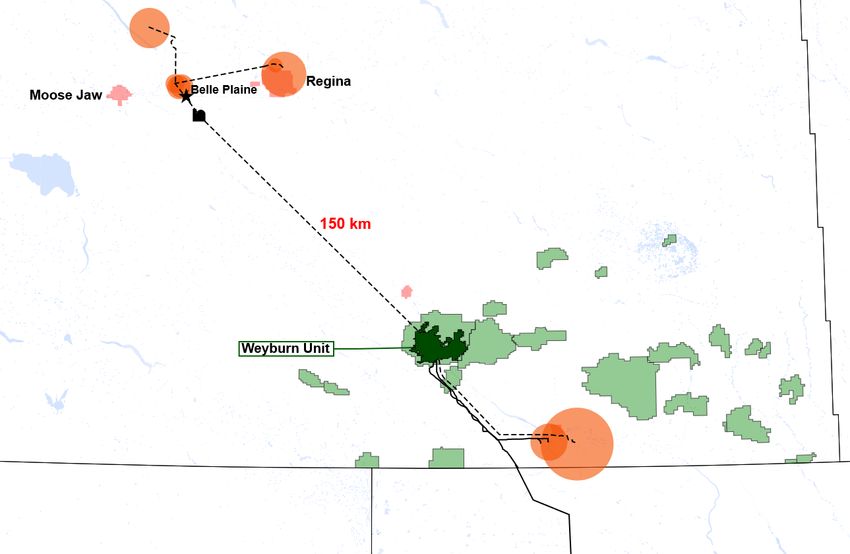
High Quality Inventory Drives Profitability

                   Inventory Payout Sensitivity                                    Inventory Profit / Investment Sensitivity
100%                                                                        100%
                    0.5

 75%                                                                        75%

 50%                                                                        50%

 25%                                                                        25%

  0%                                                                         0%
            US$50/bbl           US$60/bbl       US$70/bbl   US$80/bbl                US$50/bbl   US$60/bbl   US$70/bbl   US$80/bbl

       ✓ 87% of undrilled inventory has a payout of                           ✓ 78% of undrilled inventory has a profit to
         less than 1.5 years at US$70/bbl WTI                                   investment ratio of greater than 0.5x at
                                                                                US$70/bbl WTI

                         ✓ At low WTI of US$50/bbl, still greater than 50% of inventory has a payout of
                           less than 1.5 years and profit to investment ratio greater than 0.5

Refer to slide Notes and Advisories.

                                                                        5
Positioned for Strong Shareholder Returns

                                       • 73% liquids drives low cash break-evens
                                       • Industry leading G&A per boe at $1.00
       High Cash Netbacks              • 3 year cumulative free funds flow of $3.6B or
                                        $5.66/share

                                       • 21% base decline rate drives lower
            Low Decline Rate             capital intensity to maintain production
                                       • 40% of production under EOR provides
                                         funds flow stability

                                       • 94% of production adds in 2022 has a payout
                 Strong Capital          < 1 year and P/I ratio of > 1x
                  Efficiencies         • 4,330 net development drilling locations
                                         provides years of sustainable growth

Refer to slide Notes and Advisories.

                                               6
Increasing Profitability Through Consolidation

       ✓ Whitecap is Well Positioned for Accretive Acquisitions
                ➢ Strong Balance Sheet provides Financial Flexibility

                ➢ Further opportunities await in 2022

       ✓ 2021 Consolidation Increased Profitability
                ➢ Disciplined & Accretive                                              2021     2022       %
                                                                                     Pre-M&A   Budget    Change
                  Acquisitions
                                                    Production (boe/d)               60,000    131,000

                ➢ Core Area Consolidation                   per million shares         144      206       43%
                                                    ($MM) US$80/bbl WTI Price Deck
                ➢ Per Share metrics increased       Funds Flow                        $973     $1,784

                        9% - 43%                            per share                 $2.38     $2.80     18%
                                                    Free Funds Flow                   $748     $1,264

                ➢ Balance Sheet Strength                    per share                 $1.83     $1.99     9%

                  Maintained                        Debt to EBITDA                    0.7x      0.2x

Refer to slide Notes and Advisories.

                                                        7
Significant Free Funds Flow Growth in 2022

                                               2021      2022     % Change
    Production (boe/d)                        112,222   131,000     17%
               per million shares              186       206        11%
    ($MM)
    Funds Flow                                $1,099    $1,784      62%
               per share                       $1.82     $2.80      54%
    Capital Expenditures                       $428      $520       21%

               Free Funds Flow                 $671     $1,264      89%
    Dividends                                  $126      $217       72%

               Discretionary Funds Flow        $545     $1,047      92%

    Total Payout Ratio                         50%       41%        -18%

    Debt to EBITDA                             0.9x      0.2x       -78%
Refer to slide Notes and Advisories.

                                          8
Discretionary Funds Flow Allocation Strategy

                                                          Allocation to-date

       50% to Balance Sheet                               ~$550 MM 50% Returned to Shareholders ~$550 MM
       Central AB Acquisition                              $190 MM 19.2 MM Share Repurchase                  $134 MM

                                                                       33% Dividend Increase                  $56 MM

       Remaining                                           $360 MM Remaining                                 $360 MM

        ✓ Balance Sheet Considerations                             ✓ Returns to Shareholders

                •      Increase Financial Strength for:                  •   To be allocated to further Dividend
                                                                             increases and Share Buybacks
                           •     Strategic Acquisitions
                           •     New Energy Initiatives

Refer to slide Notes and Advisories.

                                                                   9
2022 Funds Flow Sensitivity
2022 Funds Flow Breakdown
$ million
Capital Spending
$2,000
Dividends ($0.345/share)
Discretionary Funds Flow
$1,750
$1,500
$1,259
$1,166
$1,250 $950
$1,047
$830
$1,000
US$40/B WTI $750
Break-Even $217 $217 $217 $217 $217
$500
$250 $520 $520 $520 $520 $520
$0
US$70/B WTI US$75/B WTI US$80/B WTI US$85/B WTI US$90/B WTI
Refer to slide Notes and Advisories.
10Balance Sheet Strength
• Top Tier Balance Sheet
2021 Net Debt Total Credit Unused Capacity
✓ D/EBITDA of only 1.4x
$1.2B $2.0B $0.8B
at US$45/bbl WTI
• Bank Debt is a committed facility to May 2026
• Average cost of debt 3.25%
Amount Type Rate Maturity
$405 MM Bank Debt – Variable 2.0% 2026
$795 MM Term & Bank – Fixed 3.3% 2024/2026
• Well within credit facility covenants
Ratio 2021 2022 Estimate Covenants
Debt / EBITDA 0.9x 0.2x < 4.0x
EBITDA / Interest 26.1x 48.8x > 3.5x
Refer to slide Notes and Advisories.
11Risk Management
Objectives:
• Fully fund capital program and annual dividend payments
• Downside price protection with upside participation
Outcome:
✓ 2022 capital and dividend fully funded at US$40/bbl WTI
✓ 2023 capital and dividend fully funded at US$45/bbl WTI
Oil hedges 1H/22 2H/22 2023
Percent of production hedged 22% 10% 12%
Swaps hedged (bbls/d) 9,750 1,500 2,000
Average swap price (C$/bbl) $67.11 $62.83 $88.03
Collars hedged (bbls/d) 7,000 6,500 7,240
Average collar price (C$/bbl) $63.21 x $81.17 $62.85 x $82.76 $72.94 x $100.31
Natural gas hedges 1H/22 2H/22 2023
Percent of production hedged 24% 19% -
Swaps hedged (GJ/d) 49,503 41,712 -
Average swap price (C$/GJ) $2.84 $2.89 -
Refer to slide Notes and Advisories.
12Base 3-Year Plan
3%-5% Production Per Share Growth
135,000 139,000 • Disciplined Capital Program & Targeted
131,000
111,700 Acquisitions Enhance Growth
2021 2022 2023 2024 • Cumulative Free Funds Flow of $3.6 B
or $5.66/share at US$80/B WTI
Cumulative Free Funds Flow
US$70/B US$80/B US$90/B
$4,100
$3,600 • Significant optionality for increasing
$3,000 return of capital
2022 2023 2024
Refer to slide Notes and Advisories.
13Return of Capital Strategy – Base Dividend + NCIB
33% $0.03 $247 million $1.2 billion
Total dividends paid
March 2022 dividend Current Monthly Share repurchases completed ($4.04/share)
increase dividend (as at December 31, 2021) (at December 31, 2021)
Cumulative Dividends
1,800 $5.00
1,600 Cumulative NCIB $4.50
1,400 Cumilative Dividend & NCIB
$4.00
$3.50
1,200
$/share
$ Millions
$3.00
1,000
$2.50
800
$2.00
600
$1.50
400 $1.00
200 $0.50
- $0.00
2013 2014 2015 2016 2017 2018 2019 2020 2021 2022e
➢ Long Track Record of Returning Capital to Shareholders
14Our Principles
✓ Balancing return of capital with ✓ Strong credit metrics
Strong Return on and ample liquidity
Capital Investing Debt/EBITDA 1 – 1.5x
✓ Leaders in ESG performance ✓ Fully Internally Funded
Sequesters 2MT CO2 annually income and growth model
Refer to slide Notes and Advisories.
15Commitment to Sustainability
Whitecap is a Net-Negative Producer
Permanently sequesters 2 million tonnes of CO2 annually
compared to corporate emissions of 1.2 million (scope 1 and 2)
Target to reduce direct GHG emission Executive Compensation tied to climate-
intensity 30% by 2023 from 2019 levels related performance criteria
Technology Adoption Methane Reduction Fugitive Emissions Gas Conservation
Elimination of 1,000 devices = Reduced vented emissions in Emissions decreased by 35,000 Avoidance of 13,000 tonnes of
emission reduction of 60,000 the Viking by 211,000 tonnes/yr tonnes or 46% year over year CO2 through gas conservation
tonnes/yr or 58% at Wapiti
Refer to slide Notes and Advisories.
16Advancing New Energy Opportunities
✓ Eliminating CO2 Cost At Joffre
• Successfully applied for Alberta TIER Program
• Credits generated under TIER to offset CO2 supply cost
✓ Saskatchewan Carbon Hub
• Signed MOUs with 3 counterparties
• Total potential captured emissions of 0.9 to 1.6 million tonnes of CO2/year
✓ Alberta Project Announcement
• Whitecap, Wolf and Indigenous Owners have submitted a proposal to
create a carbon storage hub to serve Alberta’s Industrial Heartland
• Significant Experience and Technical Expertise among partnership group
Refer to slide Notes and Advisories.
17Saskatchewan Carbon Hub
CO2 Emission Sources
EOR Pools
Saline Storage (BC > 50m)
Potential CO2 Pipelines
Existing CO2 Pipelines
Centralized Compression
Sask. CCUS Opportunities
Emitter CO2 Volume (Mtpa)
FCL MOU 0.5 – 1.0
K+S MOU 0.3 – 0.5
Third MOU 0.1 – 0.1
Other SE Saskatchewan 2.1 – 3.4
TOTAL 3.0 – 5.0
Potential New Revenue Streams along CCUS Value Chain
Carbon Capture ✓ Transportation
✓ Compression ✓ Sequestration
18Leading Canada and the World in CO2 Sequestration
✓ Weyburn represents 42% of all sequestered volumes in Canada over the past year
✓ EOR projects represent 74% of all sequestered volumes in Canada over the past year
✓ Weyburn is the World’s Largest Anthropogenic CO2 Storage Project
MT CO2 Annual
MT CO2
40 38
2.00 42% 45%
35 1.75 40%
30 1.50 35%
28%
30%
25 1.25 24%
Alberta 25%
20 20 1.00
Saskatchewan 20%
15 0.75
15%
10 0.50 10%
7 6 5 0.25 4% 5%
5 2% 1% 0%
0.00 0%
0
Weyburn Sleipner Snøhvit Quest Bell Creek*
Unit Storage* Storage
Refer to slide Notes and Advisories.
19CCUS Capabilities
Weyburn CCUS Project – SE SK Whitecap CCUS Total
MT CO2 MT CO2
125 115 300
250
250
100
86
200
75
150
50
38 100 88
25 39
50
0 0
Sequestered To-Date Current Capacity Potential Capacity Sequestered To-Date Current Capacity Potential Capacity
• Sequester 2 MT CO2 per year (gross operated), • Significant potential within our existing land base
potential for 4 MT per year and across multiple zones
• 115 MT CO2 (gross operated) potential capacity • Whitecap has the technical expertise to safely
providing long remaining project life expand and enhance the use of CCUS across
Western Canada
Whitecap is well positioned to accelerate new energy opportunities
Refer to slide Notes and Advisories.
20Whitecap Competitive Advantages
✓ Top Tier Balance Sheet: Low leverage with ample liquidity. Secured
covenant-based credit facility not subject to annual redeterminations.
✓ Significant free funds flow profile: Premium assets characterized
by high netbacks, low base production declines and strong capital
efficiencies.
✓ Sustainable cash dividends: Increased dividend is 6x covered by
free funds flow and represent only 12% of funds flow.
✓ Robust drilling inventory: 5,434 (4,330 net) locations for organic
growth and value creation.
✓ Leader in Sustainability: Sequesters 2MT CO2 annually
Refer to slide Notes and Advisories.
21Disciplined Management Team
• Capital investment requires an acceptable Return on Capital
• Return of Capital is important but must be supported by funds flow
• Mitigate Risk through balance sheet and hedging
• Track record of Investing Within Funds Flow
Total Payout Ratio
$98
120% $93 $100
$80
100% $80
$65 $68
Total payout ratio
$57
80%
WTI (US$/bbl)
$49 $51 $60
60% $43 $39
$40
40%
20% $20
0% $0
2013 2014 2015 2016 2017 2018 2019 2020 2021 2022e
Capex Dividends WTI (US$/bbl)
Refer to slide Notes and Advisories.
22Track Record of Per Share Growth
Funds Flow Production
$2,000 140,000 11% CAGR per share
15% CAGR per share
120,000
$1,500 100,000
80,000
Boe/d
$ million
$1,000
60,000
$500 40,000
20,000
$0 -
2010
2011
2012
2013
2014
2015
2016
2017
2018
2019
2020
2021
2010
2011
2012
2013
2014
2015
2016
2017
2018
2019
2020
2021
2022e
2022e
TPP Reserves
1,000,000 12% CAGR per share
800,000
600,000
Mboe
400,000
200,000
-
2012
2013
2009
2010
2011
2014
2015
2016
2017
2018
2019
2020
Refer to slide Notes and Advisories.
2021
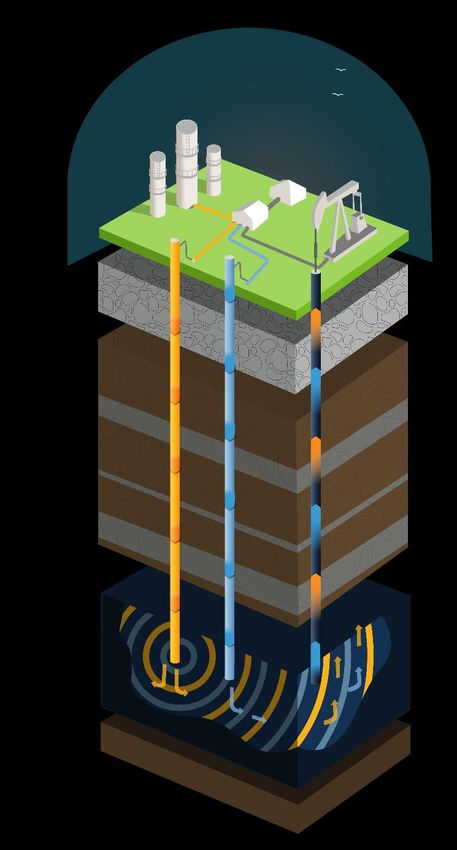
23Core Areas of Operations
5,434 (4,330 net) drilling locations
provides > 10 years growth
Total Undrilled % of Internally Estimated
2022 Avg. (boe/d) Locations (# - net) Reserves Potential
Northern AB & BC 36,500 860 67%
Central AB 36,200 766 15%
Western SK 21,900 1,823 9%
Eastern SK 36,400 882 9%
Total 131,000 4,330 100%
Refer to slide Notes and Advisories.
24Balanced 2022 Capital Allocation
$ millions %
Business Unit Primary Targets
Northern AB Cardium, Charlie Lake, Montney 163 31
Central AB Cardium, Ellerslie, Glauconite 108 21
Western SK Atlas, Shaunavon, Viking 102 20
Eastern SK CO2 Flood, Frobisher, Midale 136 26
Capitalized G&A 11 2
Total $520 100%
$520 million drilling 186 (151.0 net) wells
$85 million (16%) allocated towards EOR and HS&E initiatives
25Crude Oil Marketing
• Active seller and shipper on 7 oil
feeder pipelines connected to
Enbridge mainline
• ~60% of production is protected
from Enbridge apportionment –
rail and direct sales to refineries
• Price diversification is a natural
5% hedge
15%
80%
Condensate Medium Oil Light Oil
26TSX:WCP
www.wcap.ca
InvestorRelations@wcap.ca
February 24, 2022
27How CO2 Capture and Sequestration Works
1. Collecting Waste Emissions
1 CO2 captured
We purchase CO2 from coal plants in Saskatchewan and North
Dakota. Without the Weyburn Unit, the majority of CO2 would oil to market 4
otherwise be released to the atmosphere. 2
liquified CO2 injected
CO2 captured is equivalent to
taking 8 million combustion water
injected
engine vehicles off the road
per year 1,500m
2. Safe Injection of CO2 impermeable
caprock
We inject CO2 in liquid form at high pressure into the producing
formation 1,500 meters underground. Injecting CO2 deep
underground safely stores carbon.
3 cross-section
of CO2 flood
3X 1,500 meters is equivalent to
three times the height of the
CN Tower in Toronto.
Refer to slide Notes and Advisories.
28How CO2 Capture and Sequestration Works
3. Sustainable Oil Production
1 CO2 captured
The CO2 acts likes a solvent to flush otherwise unrecoverable oil
from pores in the rock. This results in incremental oil production oil to market 4
that could not be achieved with conventional means. 2
liquified CO2 injected
water
injected
1,500m
4. Extracting Valuable Products impermeable
caprock
At the surface, oil and natural gas liquids are extracted for sale.
The CO2 produced during oil recovery is returned to the reservoir
so that all injected CO2 is permanently stored deep underground.
3 cross-section
of CO2 flood
Refer to slide Notes and Advisories.
29Slide Notes
Slide 2
1. Current shares outstanding as at December 31, 2021 and 8.1 million share awards outstanding, pro forma the share issuances from the Central Alberta Acquisition (12.5 million
shares).
2. Enterprise value is a non-GAAP measure. See non-GAAP and Other Financial Measures in the Advisories.
3. Enterprise value calculated based on fully diluted common shares outstanding as at December 31, 2021, pro forma the share issuances from the Central Alberta Acquisition
(12.5 million shares), a share price of $9.25 and pro forma net debt of approximately $1.4 billion.
4. See Oil and Gas Advisory in the Advisories for additional information on production.
Slide 3
1. Funds flow is a non-GAAP measure. See non-GAAP and Other Financial Measures in the Advisories.
2. Free funds flow is a non-GAAP measure. See non-GAAP and Other Financial Measures in the Advisories.
Slide 4
1. “PDP” represents proved developed producing reserves, “TP” represents total proved reserves, and “TPP” represents total proved plus probable reserves per McDaniel’s
2021 year end reserve evaluation.
2. Finding, development & acquisitions cost (“FD&A Cost”) is a non-GAAP measure. See non-GAAP and Other Financial Measures in the Advisories.
Slide 5
1. Payout period is a non-GAAP measure. See non-GAAP and Other Financial Measures in the Advisories.
2. Profit to Investment is a non-GAAP ratio. See non-GAAP and Other Financial Measures in the Advisories.
Slide 6
1. See Oil and Gas Advisory in the Advisories for additional information on drilling locations.
2. Free funds flow is a non-GAAP measure. See non-GAAP and Other Financial Measures in the Advisories.
3. Payout is a non-GAAP measure. See non-GAAP and Other Financial Measures in the Advisories.
4. Profit to Investment is a non-GAAP ratio. See non-GAAP and Other Financial Measures in the Advisories.
Slide 7
1. See Oil and Gas Advisory in the Advisories for additional information on production.
2. Funds flow is a non-GAAP measure. See non-GAAP and Other Financial Measures in the Advisories.
3. Free funds flow is a non-GAAP measure. See non-GAAP and Other Financial Measures in the Advisories.
4. Discretionary funds flow is a non-GAAP measure. See non-GAAP and Other Financial Measures in the Advisories.
5. The debt used in the Debt to EBITDA calculation includes bank indebtedness, letters of credit, and dividends declared in accordance with the Company’s credit agreements.
6. The EBITDA used in the Debt to EBITDA calculation is adjusted for non-cash items, transaction costs and extraordinary and non-recurring items such as material acquisitions
or dispositions in accordance with the Company’s credit agreements.
7. Copies of the Company’s credit agreements may be accessed through the SEDAR website (www.sedar.com).
30Slide Notes
Slide 8
1. See Oil and Gas Advisory in the Advisories for additional information on production.
2. Funds flow is a non-GAAP measure. See non-GAAP and Other Financial Measures in the Advisories.
3. Free funds flow is a non-GAAP measure. See non-GAAP and Other Financial Measures in the Advisories.
4. Discretionary funds flow is a non-GAAP measure. See non-GAAP and Other Financial Measures in the Advisories.
5. Total payout ratio is a non-GAAP ratio. See non-GAAP and Other Financial Measures in the Advisories.
6. The debt used in the Debt to EBITDA calculation includes bank indebtedness, letters of credit, and dividends declared in accordance with the Company’s credit agreements.
7. The EBITDA used in the Debt to EBITDA calculation is adjusted for non-cash items, transaction costs and extraordinary and non-recurring items such as material acquisitions
or dispositions in accordance with the Company’s credit agreements.
8. Copies of the Company’s credit agreements may be accessed through the SEDAR website (www.sedar.com).
Slide 9
1. Discretionary funds flow is a non-GAAP measure. See non-GAAP and Other Financial Measures in the Advisories.
Slide 10
1. Funds flow is a non-GAAP measure. See non-GAAP and Other Financial Measures in the Advisories.
2. Discretionary funds flow is a non-GAAP measure. See non-GAAP and Other Financial Measures in the Advisories.
Slide 10 Price Assumptions
Oil (US$WTI) $70 $75 $80 $85 $90
FX (C$/US$) $0.78 $0.78 $0.79 $0.79 $0.80
Oil (C$/bbl) $90.99 $96.86 $101.55 $107.35 $111.85
AECO (C$/GJ) $3.78 $3.78 $3.78 $3.78 $3.78
Slide 11
1. Net debt is a non-GAAP measure. See non-GAAP and Other Financial Measures in the Advisories.
2. The debt used in the Debt to EBITDA calculation includes bank indebtedness, letters of credit, and dividends declared in accordance with the Company’s credit agreements.
3. The EBITDA used in the Debt to EBITDA calculation is adjusted for non-cash items, transaction costs and extraordinary and non-recurring items such as material acquisitions
or dispositions in accordance with the Company’s credit agreements.
4. Copies of the Company’s credit agreements may be accessed through the SEDAR website (www.sedar.com).
5. Fixed term and bank debt of 3.3% is based on the weighted average fixed 5-year CDOR rate of 1.39% plus the Company’s current credit charge of 1.50% plus the weighted
average of fixed term debt
6. Variable bank debt of 2.0% is based on the current CDOR rate of 0.45% plus the Company’s expected 2022 credit charge of 1.55%.
7. Whitecap year-end debt, EBITDA and interest expense used in the debt to EBITDA and EBITDA to interest calculations is based on the assumptions used for the 2022 forecast
funds flow netback ($/boe) used on slide 8 of this presentation as referenced in Specified Financial Measure in the Advisories.
8. Total credit capacity and Sr. Notes assumes the credit facility is used for $200 million note redemption on January 5th, 2022
31Slide Notes (cont’d)
Slide 12
1. Hedge positions current to February 23, 2022. Full hedge positions by product are:
Volume Bought Put Price Sold Call Price Swap Price
WTI Crude Oil Term (bbls/d) (C$/bbl) (i) (C$/bbl) (i) (C$/bbl) (i)
Collar 2022 Jan – Jun 7,000 63.21 81.17
Collar 2022 Jul - Dec 6,500 62.85 82.76
Collar 2023 Jan – Jun 5,500 72.27 99.56
Collar 2023 Jul – Dec 3,000 76.67 101.85
Collar 2023 Jan - Dec 3,000 71.67 100.22
Swap 2022 Jan – Jun 9,000 68.36
Swap 2022 Jul – Dec 750 73.55
Swap 2022 Jan – Dec 750 52.11
Swap 2023 Jan – Jun 1,000 80.00
Swap 2023 Jul – Dec 1,000 82.02
Swap 2023 Jan – Dec 1,000 95.05
WCS(iii) Volume Swap Price
Differential Term (bbls/d) ($/bbl) (i)
Swap 2021 Oct – Dec 4,000 C$16.74
Swap 2022 Jan – Dec 3,000 C$15.32
Volume Swap Price
Natural Gas Term (GJ/d) (C$/GJ) (i)
Swap 2022 Jan - Mar 24,000 3.19
Swap 2022 Apr - Oct 25,000 4.30
Swap 2022 Jan – Dec 25,000 1.95
32Slide Notes (cont’d)
Slide 12 (cont’d)
1. Hedge positions current to February 23, 2022. Full hedge positions by product are (cont’d):
Notes
(i) Prices reported are the weighted average prices for the period.
(ii) Mixed Sweet Blend (“MSW”)
(iii) Western Canadian Select (“WCS”)
2. Percent of net royalty volumes hedged are based on base Whitecap production of 131,000 boe/d for 2022 and 135,000 boe/d for 2023.
Slide 13
1. See Oil and Gas Advisory in the Advisories for additional information on production.
2. Free funds flow is a non-GAAP measure. See non-GAAP and Other Financial Measures in the Advisories.
Slide 15
1. The debt used in the Debt to EBITDA calculation includes bank indebtedness, letters of credit, and dividends declared in accordance with the Company’s credit agreements.
2. The EBITDA used in the Debt to EBITDA calculation is adjusted for non-cash items, transaction costs and extraordinary and non-recurring items such as material acquisitions
or dispositions in accordance with the Company’s credit agreements.
3. Copies of the Company’s credit agreements may be accessed through the SEDAR website (www.sedar.com).
Slide 16
1. CO2 emissions and storage are based on gross operated numbers.
Slide 17
1. “Wolf” is Wolf Midstream
2. Indigenous Owners consists of First Nation Capital Investment Partnership (consisting of Alexander First Nation, Alexis Nakota Sioux Nation, Enoch Cree Nation and Paul First
Nation) and Heart Lake First Nation
Slide 19
1. Global storage data compiled from publicly available information with (*) denoting an estimate was incorporated.
2. Equinor values derived from publicly released data (mid-2021) plus estimated storage based on publicly released annual storage for Sleipner.
3. Shell Quest values derived from publicly released data (2021).
4. Denbury Bell Creek values derived from publicly available data (2017) plus estimated storage.
5. Canadian data compiled from geoSCOUT.
6. Whitecap has a 65.3% operated working interest in the Weyburn unit and 100% working interest in the Joffre project.
33Slide Notes
Slide 20
1. CO2 emissions and storage are based on gross operated numbers. Whitecap has a 65.3% operated working interest in the Weyburn Unit.
2. Currently have the supply and pipeline capacity to increase annual carbon sequestered to 4 MT.
3. Current capacity at Weyburn includes carbon sequestration capacity within current unit boundaries. Potential capacity includes unit extensions that may or may not be
currently owned.
4. Whitecap potential capacity includes gross CO2 sequestration capacity on lands and/or units that Whitecap has a working interest in.
Slide 21
1. See Oil and Gas Advisory in the Advisories for additional information on drilling locations.
2. Dividend is 6x covered by free funds flow and represents 12% of funds flow at US $80/bbl WTI.
Slide 22
1. Total payout ratio is a supplementary financial measure. See non-GAAP and Other Financial Measures in the Advisories.
Slide 23
1. Funds flow is a non-GAAP ratio. See non-GAAP and Other Financial Measures in the Advisories.
2. Reserves for 2010-2021 are based on McDaniel & Associates Consultants Ltd.’s (“McDaniel”) reserves evaluation reports effective December 31 of the respective year in
accordance with NI 51-101 and the COGE Handbook.
3. For production and TPP reserves, the constituent product types and their respective quantities may be found in the Annual Information Form for the respective year, copies of
which may be accessed through the SEDAR website (www.sedar.com).
4. CAGR is the compound annual growth rate representing the measure of annual growth over multiple time periods.
Slide 24
1. See Oil and Gas Advisory in the Advisories for additional information on drilling locations.
2. See Oil and Gas Advisory in the Advisories for additional information on internally estimated reserves potential.
Appendix
Slide 28
1. CO2 emissions and storage are based on gross operated numbers. Whitecap has a 65.3% operated working interest in the Weyburn Unit.
Slide 29
1. CO2 emissions and storage are based on gross operated numbers. Whitecap has a 65.3% operated working interest in the Weyburn Unit.
2. A copy of the Canadian Council of Forest Ministers fact sheet may be accessed through the Sustainable Forest Management in Canada website (www.sfmcanada.org).
34Advisories
Special Note Regarding Forward-Looking Statements and Forward-Looking Information
This presentation contains forward-looking statements and forward-looking information within the meaning of applicable securities laws. Such forward looking statements or
information are provided for the purpose of providing information about management's current expectations and plans relating to the future. The use of any of the words
"expect", "anticipate", "continue", "estimate", "objective", "ongoing", "may", "will", "project", "should", "believe", "plans", "intends" and similar expressions are intended to
identify forward-looking information or statements. More particularly and without limitation, this presentation includes forward-looking information and statements about our
strategy, plans, objective, focus and priorities; 2022 production and capital guidance and the allocation thereof; funds flow and discretionary funds flow allocation; 2022
discretionary funds flow break even; 2022 funds flow, free funds flow, dividends, discretionary funds flow, total payout ratio and debt to EBITDA; 2022 year-end liquidity and
debt to EBITDA ratios; 2023-2024 production and free funds flow and the allocation thereof; and hedging objectives and the benefits to be derived from our hedging program.
Statements relating to "reserves" are also deemed to be forward-looking statements, as they involve the implied assessment, based on certain estimates and assumptions, that
the reserves described exist in the quantities predicted or estimated and that the reserves can be profitably produced in the future.
The forward-looking information is based on certain key expectations and assumptions made by our management, including expectations and assumptions concerning
prevailing commodity prices, exchange rates, interest rates, applicable royalty rates and tax laws; the impact (and the duration thereof) that the COVID-19 pandemic will have
on (i) the demand for crude oil, NGLs and natural gas, (ii) our supply chain, including our ability to obtain the equipment, supplies and services we require, and (iii) our ability to
produce, transport and/or sell our crude oil, NGLs and natural gas; future production rates and estimates of operating costs; performance of existing and future wells; reserve
volumes; anticipated timing and results of capital expenditures; the success obtained in drilling new wells; the sufficiency of budgeted capital expenditures in carrying out
planned activities; the timing, location and extent of future drilling operations; the state of the economy and the exploration and production business; results of operations and
performance; business prospects and opportunities; the availability and cost of financing, labour and services; the impact of increasing competition; ability to efficiently
integrate assets and employees acquired through acquisitions, including the Central Alberta acquisition; ability to market oil and natural gas successfully; and our ability to
access capital and the cost and terms thereof.
35Advisories (cont’d)
Since forward-looking statements and information address future events and conditions, by their very nature they involve inherent risks and uncertainties. These include, but
are not limited to: the risks associated with the oil and gas industry in general such as operational risks in development, exploration and production; delays or changes in plans
with respect to exploration or development projects or capital expenditures; the uncertainty of estimates and projections relating to reserves, production, costs and expenses;
health, safety and environmental risks; commodity price and exchange rate fluctuations; interest rate fluctuations; marketing and transportation; loss of markets;
environmental risks; competition; incorrect assessment of the value of acquisitions; failure to complete or realize the anticipated benefits of acquisitions or dispositions; ability
to access sufficient capital from internal and external sources; failure to obtain required regulatory and other approvals; reliance on third parties and pipeline systems; and
changes in legislation, including but not limited to tax laws, production curtailment, royalties and environmental regulations. Our actual results, performance or achievement
could differ materially from those expressed in, or implied by, the forward-looking information and, accordingly, no assurance can be given that any of the events anticipated
by the forward-looking information will transpire or occur, or if any of them do so, what benefits that we will derive therefrom. Management has included the above summary of
assumptions and risks related to forward-looking information provided in this press release in order to provide security holders with a more complete perspective on our future
operations and such information may not be appropriate for other purposes.
Readers are cautioned that the foregoing list of factors is not exhaustive. Additional information on these and other factors that could affect our operations or financial results
are included in reports on file with applicable securities regulatory authorities and may be accessed through the SEDAR website (www.sedar.com). The forward-looking
statements and information contained in this presentation are made as of the date hereof and Whitecap undertakes no obligation to update publicly or revise any forward-
looking statements or information, whether as a result of new information, future events or otherwise, unless so required by applicable securities laws.
In addition, this presentation contains certain forward-looking information relating to economics for drilling opportunities in the areas that Whitecap has an interest. Such
information includes, but is not limited to, anticipated payout rates, rates of return, profit to investment ratios and recycle ratios which are based on additional various forward
looking information such as production rates, anticipated well performance and type curves, the estimated net present value of the anticipated future net revenue associated
with the wells, anticipated reserves, anticipated capital costs, anticipated finding and development costs, anticipated ultimate reserves recoverable, anticipated future realized
hedging gains and losses, anticipated future royalties, operating expenses, and transportation expenses.
This corporate presentation contains future-oriented financial information and financial outlook information (collectively, "FOFI") about Whitecap’s 2022 capital expenditures,
funds flow, free funds flow, dividends, discretionary funds flow, total payout ratio and debt to EBITDA; and, 2023 and 2024 free funds flow all of which are subject to the same
assumptions, risk factors, limitations, and qualifications as set forth in the above paragraphs. The actual results of operations of Whitecap and the resulting financial results
will likely vary from the amounts set forth in this presentation and such variation may be material. Whitecap and its management believe that the FOFI has been prepared on a
reasonably basis, reflecting management's best estimates and judgments. However, because this information is subjective and subject to numerous risks, it should not be
relied on as necessarily indicative of future results. Except as required by applicable securities laws, Whitecap undertakes no obligation to update such FOFI. FOFI contained
in this presentation was made as of the date of this presentation and was provided for the purpose of providing further information about Whitecap's anticipated future
business operations. Readers are cautioned that the FOFI contained in this presentation should not be used for purposes other than for which it is disclosed herein.
Additionally, readers are advised that historical results, growth and acquisitions described in this presentation may not be reflective of future results, growth and acquisitions
with respect to Whitecap.
36Advisories (cont’d)
The assumptions used for the 2021/22 forecast funds flow netbacks ($/boe) used on slide 7 of this presentation are as follows:
2021 (Pre-M&A) 2022
Petroleum and natural gas revenues $76.62 $71.77
Tariffs ($0.42) ($0.50)
Processing income $0.30 $0.45
Realized hedging losses ($0.57) ($2.97)
Royalties ($12.18) ($13.09)
Operating expenses ($13.60) ($13.50)
Transportation expenses ($2.50) ($2.00)
General and administrative expenses ($1.00) ($1.00)
Interest and financing expenses ($2.04) ($0.90)
Cash settled share awards ($0.05) ($0.55)
Transaction costs ($0.00) -
Decommissioning liabilities ($0.25) ($0.40)
37Advisories (cont’d)
The assumptions used for the 2021/22 forecast funds flow netbacks ($/boe) used on slide 8 and slide 10 of this presentation are as follows:
2021 2022
Petroleum and natural gas revenues $61.59 $71.77
Tariffs ($0.45) ($0.50)
Processing income $0.70 $0.45
Realized hedging losses ($5.94) ($2.97)
Royalties ($10.15) ($13.09)
Operating expenses ($13.70) ($13.50)
Transportation expenses ($2.25) ($2.00)
General and administrative expenses ($1.00) ($1.00)
Interest and financing expenses ($1.15) ($0.90)
Cash settled share awards ($0.50) ($0.55)
Transaction costs ($0.30) -
Decommissioning liabilities ($0.25) ($0.40)
2022 WTI (US$/bbl) $70 $75 $80 $85 $90
Petroleum and natural gas revenues $64.77 $68.62 $71.77 $75.57 $78.59
Tariffs ($0.50) ($0.50) ($0.50) ($0.50) ($0.50)
Processing income $0.45 $0.45 $0.45 $0.45 $0.45
Realized hedging gains (losses) ($2.12) ($2.59) ($2.97) ($3.43) ($3.79)
Royalties ($11.47) ($12.34) ($13.09) ($13.93) ($14.65)
Operating expenses ($13.50) ($13.50) ($13.50) ($13.50) ($13.50)
Transportation expenses ($2.00) ($2.00) ($2.00) ($2.00) ($2.00)
General and administrative expenses ($1.00) ($1.00) ($1.00) ($1.00) ($1.00)
Interest and financing expenses ($0.90) ($0.90) ($0.90) ($0.90) ($0.90)
Cash settled share awards ($0.55) ($0.55) ($0.55) ($0.55) ($0.55)
Decommissioning liabilities ($0.40) ($0.40) ($0.40) ($0.40) ($0.40)
38Advisories (cont’d)
Oil and Gas Advisory
All reserve references in this presentation are "Company share reserves". Company share reserves are our total working interest reserves before the deduction of any
royalties and including any royalty interests payable to the company.
It should not be assumed that the present worth of estimated future amounts presented in the accompanying tables represents the fair market value of the reserves. There
is no assurance that the forecast prices and costs assumptions will be attained, and variances could be material. The recovery and reserve estimates of the crude oil,
natural gas liquids and natural gas reserves provided herein are estimates only and there is no guarantee that the estimated reserves will be recovered. Actual crude oil,
natural gas and natural gas liquids reserves may be greater than or less than the estimates provided herein.
References to petroleum, crude oil and natural gas in this press release refer to the light and medium crude oil, tight crude oil, conventional natural gas, shale gas and
natural gas liquids product types, as applicable, as defined in NI 51-101.
"Boe" means barrel of oil equivalent. All boe conversions in this press release are derived by converting gas to oil at the ratio of six thousand cubic feet (“Mcf”) of natural
gas to one barrel (“Bbl”) of oil. Boe may be misleading, particularly if used in isolation. A Boe conversion rate of 1 Bbl : 6 Mcf is based on an energy equivalency conversion
method primarily applicable at the burner tip and does not represent a value equivalency at the wellhead. Given that the value ratio of oil compared to natural gas based on
currently prevailing prices is significantly different than the energy equivalency ratio of 1 Bbl : 6 Mcf, utilizing a conversion ratio of 1 Bbl : 6 Mcf may be misleading as an
indication of value.
39Advisories (cont’d)
Oil and Gas Advisory
Drilling Locations & Internally Estimated Reserve Potential
This presentation discloses drilling inventory in three categories: (i) proved locations; (ii) probable locations; and (iii) unbooked locations. Proved and probable locations
are derived from McDaniel’s reserves evaluation effective December 31, 2021 and account for drilling locations that have associated proved and/or probable reserves, as
applicable. Unbooked locations refer to locations assigned to internally estimated reserves potential and are not otherwise included in the McDaniel reserves evaluation.
This presentation also discloses internally estimated reserves potential, which is the summation of proved plus probable reserves per the McDaniel’s reserve evaluation
effective December 31, 2021 plus an internal estimate prepared by members of Whitecap’s management team who are qualified reserve evaluators and is based on our
technical assessment of the resource in place on our acreage and the potential recoverable portion of this resource using industry standard evaluation methods for
determining the spacing and number of wells required to obtain this recovery.
Internally estimated reserves potential consists of drilling locations that have been identified by management as an estimation of our multi-year drilling activities based on
evaluation of applicable geologic, seismic, engineering, production and reserves information. There is no certainty that we will drill all of these drilling locations and if
drilled there is no certainty that such locations will result in additional oil and gas reserves, resources or production. The drilling locations on which we drill wells will
ultimately depend upon the availability of capital, regulatory approvals, seasonal restrictions, oil and natural gas prices, costs, actual drilling results, additional reservoir
information that is obtained and other factors. While certain of the unbooked drilling locations have been de-risked by drilling existing wells in relative close proximity to
such unbooked drilling locations, other unbooked drilling locations are farther away from existing wells where management has less information about the characteristics
of the reservoir and therefore there is more uncertainty whether wells will be drilled in such locations and if drilled there is more uncertainty that such wells will result in
additional oil and gas reserves, resources or production.
The following table provides a detailed breakdown of the current Whitecap net drilling locations included in this presentation:
Total Net Drilling Proved Probable Unbooked
Inventory Locations Locations Locations
Northern Alberta & BC 860 187 47 627
Central Alberta 766 188 35 543
Western Saskatchewan 1,823 595 32 1,197
Eastern Saskatchewan 882 362 113 407
Total 4,330 1,331 226 2,773
40Advisories (cont’d)
Production & Product Type Information
This presentation includes references to petroleum, crude oil, NGLs, natural gas and total average daily production.
NI 51-101 includes condensate within the natural gas liquids ("NGLs") product type. The Company has disclosed condensate as combined with crude oil and separately
from other natural gas liquids since the price of condensate as compared to other natural gas liquids is currently significantly higher and the Company believes that this
crude oil and condensate presentation provides a more accurate description of its operations and results therefrom. Crude oil therefore refers to light, medium, tight oil and
condensate. NGLs refers to ethane, propane, butane and pentane combined. Natural gas refers to conventional natural gas and shale gas combined.
The Company’s average production disclosed in this presentation consist of the following product types, as defined in NI 51-101 and using a conversion ratio of 1 Bbl : 6
Mcf where applicable:
Light and Conventional
Tight Oil NGLs Shale Gas Total
Medium Oil Natural Gas
(bbls/d) (bbls/d) (Mcf/d) (boe/d)
(bbls/d) (Mcf/d)
Q4/21 78,814 501 10,568 42,993 137,827 120,020
Q4/20 48,437 90 4,874 277 62,012 63,783
2021 Pre-M&A 45,800 400 3,950 2,250 56,850 60,000
2021 74,863 524 10,418 20,402 138,099 112,222
2022 Guidance 78,850 4,320 11,940 63,200 152,140 131,000
2022 Guidance - Northern AB & BC 11,680 4,320 3,150 63,200 40,900 36,500
2022 Guidance - Central AB 13,680 - 7,090 - 92,580 36,200
2022 Guidance - Western SK 19,990 - 200 - 10,260 21,900
2022 Guidance - Eastern SK 33,500 - 1,500 - 8,400 36,400
2023 3% Growth 81,250 4,450 12,300 65,100 156,900 135,000
2024 3% Growth 83,720 4,580 12,700 67,050 160,950 139,000
41Advisories (cont’d)
Non-GAAP and Other Financial Measures
This presentation includes various non-GAAP and other financial measures, including non-GAAP financial measures and non-GAAP ratios as further described herein.
These measures do not have a standardized meaning prescribed by International Financial Reporting Standards (“IFRS” or, alternatively, “GAAP”) and, therefore, may not
be comparable with the calculation of similar measures by other companies.
“Discretionary funds flow” is a non-GAAP financial measure and represents funds flow less expenditures on property, plant and equipment (“PP&E”) and dividends.
Management believes that discretionary funds flow provides a useful measure of Whitecap's ability to increase returns to shareholders and to grow the Company’s
business.
“Enterprise value” is a supplementary financial measure and is calculated as market capitalization plus net debt. Management believes that enterprise value provides a
useful measure of the market value of Whitecap's debt and equity.
“FD&A Cost” is a non-GAAP financial measure and is calculated as the sum of development capital (excluding corporate and capitalized general and administrative
expense) plus acquisition capital plus the change in FDC for the period when appropriate, divided by the change in total reserves, other than from production, for the
period.
“Free funds flow” is a non-GAAP financial measure and represents funds flow less expenditures on PP&E. Management believes that free funds flow provides a useful
measure of Whitecap's ability to increase returns to shareholders and to grow the Company’s business. Previously, Whitecap also deducted dividends paid or declared in
the calculation of free funds flow. The Company believes the change in presentation better allows comparison with both dividend paying and non-dividend paying peers.
“Funds Flow” is a capital management measure and is a key measure of operating performance as it demonstrates Whitecap’s ability to generate the cash necessary to pay
dividends, repay debt, make capital investments, and/or to repurchase common shares under the Company’s NCIB. Management believes that by excluding the temporary
impact of changes in non-cash operating working capital, funds flow provides a useful measure of Whitecap’s ability to generate cash that is not subject to short-term
movements in non-cash operating working capital. Funds flow is not a standardized measure and, therefore, may not be comparable with the calculation of similar
measures by other entities. Whitecap reports funds flow in total and on a per share basis (basic and diluted) using the weighted average basic shares and weighted average
diluted shares outstanding. See Note 5(e) (ii) "Capital Management" in the Company's audited annual consolidated financial statements for the year ended December 31,
2021 for a detailed calculation.
“Market capitalization” is a supplementary financial measure and is calculated as period end share price multiplied by the number of shares outstanding at the end of the
period. Management believes that market capitalization provides a useful measure of the market value of Whitecap's equity.
“Net Debt” is a capital management measure and is key to assessing the Company's liquidity. See Note 5(e) "Capital Management" in the Company's audited annual
consolidated financial statements for the year ended December 31, 2021 for a detailed calculation.
“Total payout ratio” is a supplementary financial measure and is calculated as dividends paid or declared plus expenditures on PP&E, divided by funds flow. Management
believes that total payout ratio provides a useful measure of Whitecap’s capital reinvestment and dividend policy, as a percentage of the amount of funds flow.
42Advisories (cont’d)
Specified Financial Measures
“Payout” is a non-GAAP measure and is calculated as the point in time in which the cumulative monthly operating netback equates to the all-in capital investment of an
individual well or a project. Management believes that payout period provides a useful measure of Whitecap’s ability to generate profits on an individual well or project
basis.
“Profit to investment” is a non-GAAP ratio and is calculated as the net present value, using the industry standard 10% discount rate, of the total operating netback of an
individual well or a project after all-in capital investment, divided by the all-in capital investment. Management believes that profit to investment provides a useful measure
of Whitecap’s expected profits on an individual well or project basis and subsequently our ability to increase returns to shareholders and grow the Company’s business.
43Research Coverage
• ATB Capital Markets • Peters & Co.
• BMO Capital Markets • Raymond James
• CIBC World Markets • RBC Capital Markets
• Cormark Securities • Scotiabank Global
• Desjardins Capital Markets • STIFEL | FirstEnergy
• Haywood Securities • TD Securities
• National Bank Financial • Tudor Pickering Holt & Co.
44You can also read