Investor Update January 21, 2021 - New Fortress Energy
←
→
Page content transcription
If your browser does not render page correctly, please read the page content below
January 21, 2021

Investor
Update
1. Executive Summary

2. FAQ: How will we pay for this?

3. FAQ: How does this fit with capital-light business model?

4. FAQ: Why Brazil?

5. FAQ: Why buy ships vs. leasing?

6. FAQ: How does FLNG fit into business model?

7. Appendix

                                                               2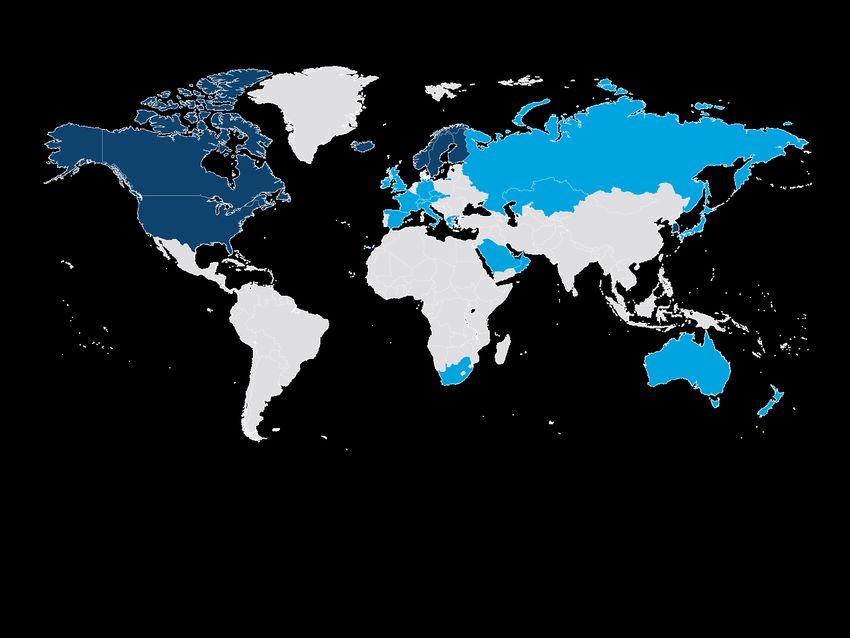
Executive Summary

Announced 3 separate transactions for $5.1bn equivalent enterprise value(1)

  1   Acquiring Hygo Energy Transition Ltd.
      •   Private LNG-to-power business                                                                   Consideration
      •   3 terminals & power plants in   Brazil(2)
             •   Includes country’s largest thermal power plant              Adds 4        $2.18bn for 100% of Hygo

             •   Includes 3 FSRUs(3)                                         terminals     •   $580mm cash
                                                                                           •
      •   Currently a 50/50 JV between Golar LNG Ltd. & Stonepeak
          Infrastructure Partners
                                                                             to our            $1.6bn of NFE shares
                                                                                           •   Leave current asset-level debt in place
                                                                             portfolio
  2   Suape Terminal
                                                                                           $1.5bn for 100% of GMLP
      •   Purchasing 288MW of PPAs in Brazil(4)
                                                                                           •   All cash
      •   Moving PPAs to Suape port
                                                                                           •   Assume FLNG debt of $389mm &
      •   Developing terminal & power plant                                                    $138mm preferred equity
                                                                                           •   Refinance remaining debt of $1.4bn
  3   Acquiring Golar LNG Partners LP
      •   Publicly traded MLP
      •   6 FSRUs, 4 LNGCs, 1 FLNG
                                                                                          Approximately ~$5 billion enterprise
                                                                                         value; expected closing in 1-4 months(5)
      •   Owned 32% by Golar LNG Ltd.

                                                                                                                                         3
Executive Summary
Our business is simple
We sell power & natural gas in developing countries around the world by providing capital, infrastructure, assets & expertise
Objective #1: Democratize access to power Objective #2: Provide cleaner, cheaper energy Objective #3: Reach zero emissions
Natural gas:
The world’s energy system
needs to be transformed
30%
fewer emissions
Find the cheapest
Global Electricity Access vs. diesel & heavy fuel oil(6) 1 zero-emission hydrogen
MWh per Capita
> 10 MWh 5–10 MWh < 5 MWh
Replace natural gas with
2 hydrogen in our operations
Over a billion people lack electricity
47%
We are quickly expanding energy cheaper than diesel
Become leader in fossil-free
access where it’s needed most to over last 5 years (3) 3 energy transition
meet today’s acute power needs
4Executive Summary
Growing from 5 to 9 terminals(7)
We reach new markets via terminals
Our goal: 15-20 terminals globally by YE 2021, focused on largest & fastest-growing markets
Montego Bay, Jamaica
La Paz, Mexico San Juan, Puerto Rico Facility
Old Harbour, Jamaica
Puerto Sandino, Nicaragua
Barcarena 605 MW + terminal (planned)
Suape 288 MW + terminal (planned)
Sergipe 1.5 GW (50% interest) + terminal (100% interest)
Existing terminals operating or in development (8) (9)
Santa Catarina 600 MW (option) + terminal (planned)
New terminals from transactions 5Executive Summary
Not all terminals are created equal
High-volume Brazil terminals are expected to dramatically increase our addressable market(10)
Terminals Pre-Acquisition Acquisition Terminals
(GPD) Current Max. (GPD) Current Max.
Jamaica 1.2mm 2.5mm Barcarena 0mm 12mm
Puerto Rico 800k 3mm Suape 0mm 14mm
vs.
Mexico 600k 1.5mm Sergipe ~1mm 2mm
Nicaragua 750k 1.5mm Santa Catarina 0mm 17mm
5.2mm GPD (3.1MTPA) 45mm GPD (27MTPA)
incremental growth incremental growth
~2x terminals but ~9x incremental growth with total of 50.2mm GPD
6Executive Summary
NFE has become the premier global gas-to-power company in the world(12)
High-quality assets strategically located in target geographies(11)
Terminal
Power plant
FSRU
FLNG
+ 4x LNGC
Key target markets
terminals FLNG
9 operational &
in development
3.5 GW 9 FSRUs 4 LNGCs 1 (50% interest in
current ops) 77
7Executive Summary
Brazil terminals offer significant op. margin upside with
limited project costs(13)
Capex per Terminal Potential Op. Margin ($mm/year)
Terminal Project Power Project
Terminal
Costs Costs Total potential market is 45mm GPD
Sergipe - - Illustrative
Operating 10% 25% 50%
Barcarena $35mm - Margin mkt. capture mkt. capture mkt. capture
($/MMBtu)
Suape $30mm $160mm
$1.50 $206 $515 $1,029
Santa Catarina $50mm -
$2.50 $343 $858 $1,716
Total $115mm $160mm
8Executive Summary
New portfolio + pipeline targeted to generate $1.6bn+ Illustrative
Op. Margin(14)
Combined company targets Illustrative Op. Margin of $895mm at closing, almost doubling once pipeline projects come online
Hygo + Suape NFE GMLP Total
$3.1bn $10bn $1.9bn
enterprise value enterprise value enterprise value $15bn
@$51/share
+ + +
Project costs(15) to build
$800mm $900mm $1.7bn
out pipeline
$3.9bn + $10.9bn + $1.9bn = $16.7bn
Illustrative Op. Margin
$160mm $420mm $315mm $895mm
at closing
+ + +
Incremental Illustrative
Op. Margin from pipeline $250mm+ $500mm+ $750mm+
Total Illustrative Op.
Margin Goal $410mm + $920mm + $315mm = $1.6bn+
9Executive Summary
Expanded footprint positions us to lead global carbon-free power transition
We aim to replace natural gas with emission-free hydrogen across our global portfolio
We already to
Opportunity serve the sectors most
lead emission-free …and now we will have footholds in
in need
hydrogen of transition
energy transitioning
at globalto 4 continents that will have significant
scale
carbon-free energy... demand for carbon-free energy
This will take time, but much of the
infrastructure and assets that we
have will work well with clean
Transportation,
industrial, and
hydrogen and it’s merely a matter of
power sectors
time wetobelieve
contribute until the cost of
more than
producing
80% of currenthydrogen
CO2 approaches %
emissionsthat of natural gas.
(16)
10Executive Summary
Today we are addressing some FAQs about these transactions
1 2 3 4 5
How will How does Why Why buy How does
we pay for this fit into Brazil? ships vs. the FLNG
this? our capital- lease ships? fit into our
light business business
model? model?
111. Executive Summary
2. FAQ: How will we pay for this?
3. FAQ: How does this fit with capital-light business model?
4. FAQ: Why Brazil?
5. FAQ: Why buy ships vs. leasing?
6. FAQ: How does FLNG fit into business model?
7. Appendix
12How will we pay for this?
Multiple sources of funds in excess of needs(17)
Committed expenditures… …can be funded by a combination of:
$580mm cash for Hygo $600mm cash
+ $300-400mm committed project costs $200mm revolver
$880-980mm $300-400mm 2021 illustrative
op. margin
+ $1bn+ potential asset sales
$2.1-2.2bn+
131. Executive Summary
2. FAQ: How will we pay for this?
3. FAQ: How does this fit with capital-light business model?
4. FAQ: Why Brazil?
5. FAQ: Why buy ships vs. leasing?
6. FAQ: How does FLNG fit into business model?
7. Appendix
14How does this fit with capital-light business model?
Capital-light growth model: recycle assets & redeploy capital to high-growth terminals
Future growth expected to be funded by cash flow from operations and recycling of stable assets
Our business model Significant equity in stable assets that are candidates to be sold & managed
Focused on capital-light growth: Several stable assets with limited growth opportunities:
We develop terminals and Jamalco (25 years) Nanook (25 years) Sergipe (25 years)
1 power plants
We look to recycle assets on our over $1bn potential equity value
2 balance sheet once they are
stabilized
Assets are candidates to be sold & managed
We then seek to redeploy the
3 capital into high-growth terminals
May provide significant internally-generated cash flow we can
redeploy into high growth terminals(18)
151. Executive Summary
2. FAQ: How will we pay for this?
3. FAQ: How does this fit with capital-light business model?
4. FAQ: Why Brazil?
5. FAQ: Why buy ships vs. leasing?
6. FAQ: How does FLNG fit into business model?
7. Appendix
16Why Brazil?
Brazil’s emerging gas market presents huge opportunity
Brazil is a unique opportunity: ~35 MTPA natural gas market just beginning to emerge from Petrobras monopoly
Why Brazil? Why now?
Large country with significant & growing energy demand but We’re a first mover in a market on the threshold of change
underdeveloped natural gas infrastructure(19)
Petrobras monopoly is currently ending,
1 which opens the market
Most populated country Underdeveloped Natural gas demand
in LATAM (211mm) gas infrastructure of ~35 MTPA
Pipeline capacity is being made available for
2 the first time, allowing us to supply gas across
the country
LNG imports Bolivian gas imports are Large consumers are
represented ~10% of declining (20% to 25% of thermal power plants, Pipeline tariffs are changing, which will
gas market in 2019 total gas consumption) industrial sector, & 3 make gas supply closest to demand most
(and rising) transportation competitive
17Why Brazil?
Terminals strategically located to take advantage of market opportunities
Large market opportunity Pipeline proximity allows Opportunity to grow gas demand
(~45mm GPD market) access to most of country by replacing HFO & diesel
1 Barcarena (in development)
Barcarena
Terminal • Co-located with Alunorte refinery and other significant industrial demand
• Awarded 25-year PPA with COD in 2025
1 • Strategically located to serve entire Amazon river basin (>2.8 GW of oil generation)
Suape
Terminal
2 2 Suape (in development)
• Anchored with 288 MW 15-year PPAs COD 2022 (20)
3 • Located near Copergas LDC and >1GW demand for power and industrial use
• Strategic location to connect to TAG pipeline (13km)
Sergipe
Terminal
3 Sergipe (operational)
• Anchored by 1.5 GW CELSE power plant
• 30km from TAG pipeline
NTS Pipeline
4 4 Santa Catarina (in development)
TAG Pipeline Santa Catarina
Bolivian Pipelines Terminal • Located near city gate that serves LDCs, power plants, and industrial demand
Gasbol (TBG) & • 30km from key distribution point in pipeline TBG Pipeline
Rio San Miguel • New gas law advantageous for gas trading on pipeline grid
181. Executive Summary
2. FAQ: How will we pay for this?
3. FAQ: How does this fit with capital-light business model?
4. FAQ: Why Brazil?
5. FAQ: Why buy ships vs. leasing?
6. FAQ: How does FLNG fit into business model?
7. Appendix
19Why buy ships vs. leasing?
Buying ships is better than leasing for long-term use
Example calculation: Golar Winter
Own cost(25)
(annual)
Savings
Lease cost(24)
$120mm value amort. $6mm
(20-yr)
(annual)
$7mm/yr
Op. & maintenance
expense $9mm vs. $26mm
($70k/day)
Interest expense
$5mm
26%
(75% debt x 5%) +
$19mm
20Why buy ships vs. leasing?
Acquisitions significantly de-risk our global shipping needs
Our total portfolio needs(21),(22) Large scale vessels acquired
8 FSRU 4 FSU 12
Vessels 9 FSRU 4 FSU 13
Vessels
Asset Vessel Need Vessel Size
1 Old Harbour, Jamaica FSRU 1 Spirit FSRU (125k m3)
2 Sergipe, Brazil FSRU 2 Freeze FSRU (125k m3)
3 Suape, Brazil FSRU 3 NR Satu FSRU (125k m3)*
4 Barcarena, Brazil FSRU 4 Winter FSRU (138k m3)
5 Santa Catarina, Brazil FSRU 5 Eskimo FSRU (160k m3)* Total Cost to Lease: ~$215mm
6 Pipeline Project FSRU 6 Penguin FSRU (160k m3)**
7 Pipeline Project FSRU 7 Celsius FSRU (160k m3)**
Total Cost to Own: ~$150mm
8 Pipeline Project FSRU 8 Igloo FSRU (170k m3)
9 Nanook FSRU (170k m3)
1 San Juan, Puerto Rico None (long-term) Savings: ~$65mm (30%)
2 La Paz, Mexico FSU 1 Mazo FSU (135k m3)
3 Puerto Sandino, Nicaragua FSU 2 Princess FSU (138k m3)
4 General Transport FSU 3 Grand FSU (145k m3)
5 General Transport FSU 4 Maria FSU (146k m3)
*May not deploy these vessels for internal purposes
**Assumes the conversion of the Penguin and Celsius to FSRUs from FSUs 21
Note: Excludes mid and small scale vessel requirements1. Executive Summary
2. FAQ: How will we pay for this?
3. FAQ: How does this fit with capital-light business model?
4. FAQ: Why Brazil?
5. FAQ: Why buy ships vs. leasing?
6. FAQ: How does FLNG fit into business model?
7. Appendix
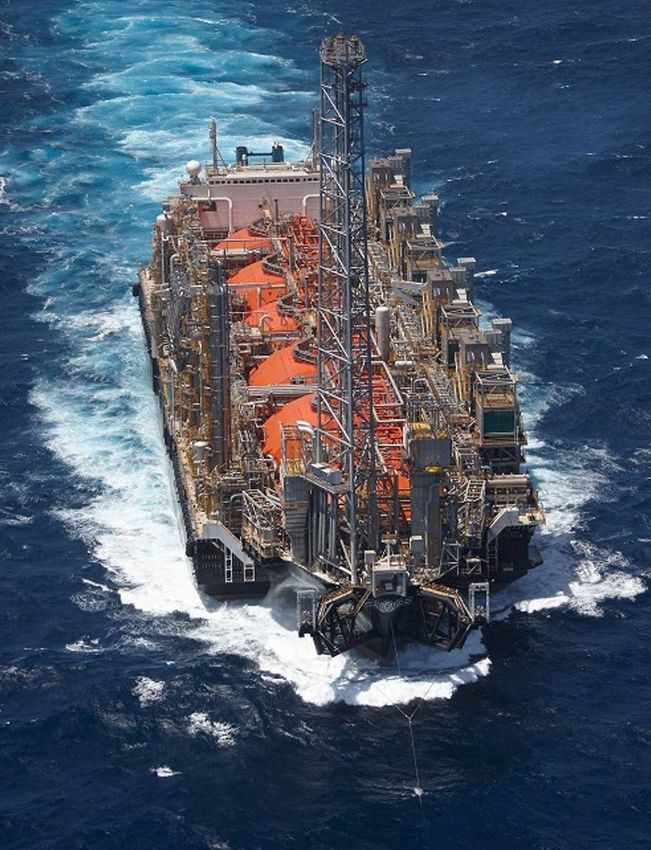
22How does FLNG fit into business model?
FLNG is the future of liquefaction
FLNG is what FSRUs were 20 years ago…we are investing at the beginning of an industry-disruptive future
(Operational)
Acquisition will give us FLNG technology,
which allows access to stranded offshore fields
Allows owners NFE gains Ability to
to monetize access to a provide fixed-
stranded stable source price LNG to
assets of low-cost customers
LNG (move away from Brent/
Henry Hub indexation)
It’s a WIN-WIN-WIN
FLNG Hilli Episeyo
23How does FLNG fit into business model?
FLNG could allow our entire system to be supplied with low-cost LNG
FLNG manufactures LNG for ~$3/MMBtu
Step 1: Own the terminals Step 2: Build our own Step 3: Supply system with
FLNG(27)
$3 LNG(28)
Developing portfolio of costs $1 billion
high throughput to build (25% equity) $2-3/MMBtu savings x 10 MTPA
terminals: =
10 MTPA pipeline(26)
produces $1-1.5bn+
2.5 MTPA of LNG
incremental margin
241. Executive Summary
2. FAQ: How will we pay for this?
3. FAQ: How does this fit with capital-light business model?
4. FAQ: Why Brazil?
5. FAQ: Why buy ships vs. leasing?
6. FAQ: How does FLNG fit into business model?
7. Appendix
25Appendix
Hygo: Sources & Uses
$3.1bn Enterprise Value
Hygo: Total acquisition cost of $2.18bn
• NFE to issue $950mm stock and pay $50mm cash to GLNG for 50% stake in Hygo
• NFE to pay cash to Stonepeak for $180mm preferred equity + $350mm cash + rest in NFE stock (50%
stake in Hygo ($1bn + $180mm = $1.18bn))
• Expect to keep $1.0bn project-level debt in place
Hygo Acquisition ($mm)
Sources Uses
NFE Cash $580 Cash to Stonepeak ($180mm pref + $350mm) $530
NFE Shares Issued to Stonepeak $650 NFE Stock to Stonepeak $650
NFE Shares Issued to GLNG $950 Cash to GLNG $50
NFE Stock to GLNG $950
Total Sources $2,180 Total Uses $2,180
26Appendix
GMLP: Sources & Uses
$1.9bn Enterprise Value
GMLP: Total acquisition cost of $1.4bn
• NFE to issue $1.4bn of corporate debt to pay for GMLP ($516mm ship facility + $380mm NOR bonds +
$197mm Eskimo SLB + $59mm Nu. Regas Satu SLB + $251mm common)
• Keep existing $389mm Hilli attributable debt + $138mm preferred equity in place
GMLP Acquisition ($mm)
Sources Uses
New NFE Corporate Debt $1,403 GMLP Common Stock $251
Redeem 2015 NOR Bonds $140
Redeem 2017 NOR Bonds $240
Redeem Existing $800mm Ship Facility $516
Redeem Eskimo SLB $197
Redeem NR Satu Facility $59
Total Sources $1,403 Total Uses $1,403
27Appendix
Post-closing asset overview
9 terminals 7 power plants
Montego Bay, Jamaica La Paz, Mexico Jamalco, Jamaica Sergipe, Brazil
Operational Under development 150MW 1.5GW
Operational Operational
Old Harbour, Jamaica Sergipe, Brazil
Operational Operational Puerto Sandino, Nicaragua Barcarena, Brazil
300MW 605MW
San Juan, Puerto Rico Barcarena, Brazil Under development
Operational Santa Catarina, Brazil
600MW (option)
Santa Catarina, Brazil La Paz, Mexico
Puerto Sandino, Nicaragua
135MW Suape, Brazil
Under development
Suape, Brazil Under development 288MW
13 vessels 1 FLNG
LNGCs FSRUs Hilli Episeyo
Methane Princess Golar Maria Golar Freeze Golar Eskimo
Golar Mazo Golar Penguin Nusantra Satu Golar Winter
Golar Grand Golar Celsius Golar Igloo Golar Nanook
Golar Spirit
28Disclaimers
– IN GENERAL. This disclaimer applies to this document and the verbal or written comments of any person presenting it. This document, taken together with any such verbal or written comments, is
referred to herein as the “Presentation.”
– FORWARD-LOOKING STATEMENTS. Certain statements regarding New Fortress Energy Inc. (together with its subsidiaries, “New Fortress Energy,” “NFE,” the “Company,” “we” or “us”) in this
Presentation may constitute forward-looking statements within the meaning of the Private Securities Litigation Reform Act of 1995. You can identify these forward-looking statements by the use of
forward-looking words such as “outlook,” “believes,” “expects,” “by,” “converts” “approaches” “nearly” “potential,” “continues,” “may,” “will,” “should,” “could,” “seeks,” “approximately,” “predicts,”
“intends,” “plans,” “estimates,” “anticipates,” “target,” “goal,” “projects,” “contemplates” or the negative version of those words or other comparable words. Any forward-looking statements contained in
this presentation, including statements regarding the acquisition of Hygo Energy Transition Ltd. (“Hygo”), the 288 MW of PPAs (“Suape”), or Golar LNG Partners LP (“GMLP”), including the expected
timing and conditions of closing, our expected financing of each acquisition; our goal to develop 15-20 terminals by YE 2021; our expectation that the Brazil terminals will increase our addressable
market; each project’s or company’s development schedule, the expected volumes that we will sell and the revenue or Operating Margin of each company or the combined companies that we
illustrate in this Presentation; NFE’s ability to execute on the currently Operational and In Development assets of the companies we plan to acquire; the expected capabilities of our projects once
Completed; the timing of our downstream facilities coming online and becoming fully operational, expected business and developments in the future (including but not limited to, our liquidity and
financing plans and expected borrowing capacity); our expectations for the equity value in certain assets and our ability to redeploy capital; our market assumptions including those regarding the cost
of shipping (including owning and leasing), logistics and regasification activities, and the pricing of LNG, natural gas and other alternative fuels, are based upon our limited historical performance and
on our current plans, estimates and expectations in light of information (including industry data) currently available to us. The inclusion of this forward-looking information should not be regarded as a
representation by the Company or any other person that the future plans, estimates or expectations contemplated by us will be achieved. These statements are subject to a number of factors that could
cause actual results to differ materially from those described in the forward-looking statements, many of which are beyond our control. NFE can give no assurance that its expectations regarding any
forward-looking statements will be attained. Accordingly, you should not place undue reliance on any forward-looking statements made in this Presentation. Factors that could cause or contribute to
such differences include, but are not limited to, the risk that the proposed transactions with each of Hygo, Suape and GMLP may not be completed in a timely manner or at all; GMLP’s ability to receive,
on a timely basis or otherwise, the required approval of the proposed GMLP Transaction with NFE by GMLP’s common unitholders; the possibility that competing offers or acquisition proposals for
GMLP will be made; the possibility that any or all of the various conditions to the consummation of the acquisitions may not be satisfied or waived, including the failure to receive any required
regulatory approvals from any applicable governmental entities (or any conditions, limitations or restrictions placed on such approvals); the effect of the announcement or pendency of the transactions
contemplated by each of the applicable merger agreements or NFE’s, Hygo’s and GMLP’s ability to retain and hire key personnel, their ability to maintain relationships with their respective customers,
suppliers and others with whom they do business, and their operating results and business generally; the possibility that long-term financing for the proposed transactions may not be available on
favorable terms, or at all; NFE’s ability to enter into agreements to develop or acquire terminals on the timeline that we anticipate or on terms that are favorable to us if at all; NFE’s ability to integrate
the acquired assets and operations with its existing assets and operations and to realize anticipated cost savings and other efficiencies and benefits; the risk that the Brazil market is saturated or that
NFE is unable to enter it in on the pace or under the terms that it expects; NFE may be unable to sell or manage certain assets on terms favorable to us or at all; our development schedules will take
longer than we expect; the impacts of the novel coronavirus pandemic on our and our customers’ demand or customers’ and suppliers’ operations and financial status, including our supply chains and
development projects; the price at which we sell LNG or charter ships, the cost at which we or the combined companies produce, ship and deliver LNG or provide ship charters or other ship services,
and the margin that we or the combined companies receive for the LNG and charters which bring us revenue are not in line with our expectations, that our operating or other costs will increase
(including of owning and leasing ships); or our expected remaining costs for development projects underway increases. For a discussion of some of the risks and important factors that could affect such
forward-looking statements, see the sections entitled “Risk Factors” and “Management’s Discussion and Analysis of Financial Condition and Results of Operations” in the Company’s previous public
filings with the U.S. Securities and Exchange Commission (the “SEC”), which will be made available on the Company’s website (www.newfortressenergy.com). In addition, new risks and uncertainties
emerge from time to time, and it is not possible for the Company to predict or assess the impact of every factor that may cause its actual results to differ from those contained in any forward-looking
statements. Such forward-looking statements speak only as of the date of this Presentation. NFE expressly disclaims any obligation to release publicly any updates or revisions to any forward-looking
statements contained herein to reflect any change in the Company's expectations with regard thereto or change in events, conditions or circumstances on which any statement is based.
– PAST PERFORMANCE. Our operating history is limited and our past performance is not a reliable indicator of future results and should not be relied upon for any reason.
– –ILLUSTRATIVE ECONOMICS: Illustrative economics (including of Operating Margin) are hypothetical value based on specified assumptions that are aspirational in nature rather than management’s
view of projected financial results. Actual results could differ materially and the hypothetical assumptions on which this illustrative data is based are subject to numerous risks and uncertainties,
including particular risks and uncertainties introduced due to the novel coronavirus and its broad and ongoing impact on the worldwide economy. 29Endnotes
Certain of the below Endnotes include forward-looking statements. Please see our note regarding “Forward-Looking Statements” on the slide titled “Disclaimers” of this Investor Update
(the “Presentation”). Please evaluate this Presentation in connection with the risk factors in our public reports, including our report on Form 10-Q for the period ended September 30,
2020. These Endnotes refer to Hygo Energy Transition Ltd. (“Hygo”) and Golar LNG Partners LP (“GMLP”). We previously announced our intention to acquire Hygo and GMLP in our Form 8-
K filed on January 20, 2021. These acquisitions are subject to customary closing conditions described in such 8-K. There can be no assurance that closing will be attained within the
timeline that we expect or at all.
– (1) “enterprise value” or “EV” means the sum of debt and equity value of Hygo and GMLP, including the aggregate purchase price of the equity in each company and the debt that will
be assumed as a result of the transaction. There can be no assurance that the valuation of each company is equivalent to its enterprise value.
– (2) One of these terminals, the Sergipe terminal and power plants (the Sergipe Terminal and Sergipe Power Plant), currently owned by Hygo, is Operational (as defined later in this
Presentation) and two of these terminals and power plants, currently owned by Hygo, are In Development. This number does not include the Suape terminal and power plant which is
being acquired separately from the terminals and power plants currently owned by Hygo.
– (3) This number of FSRUs includes the conversion of the Golar Penguin and the Golar Celsius, both currently owned by Hygo, from LNGCs to FSRUs. No final investment decision has
been made about these conversions, and there can be no assurance that this conversion will be successful on a particular timeline or at all.
– (4) We have agreed to this purchase under a memorandum of understanding which is subject to the execution of a definitive sale and purchase agreement and final approval from the
counterparty’s Board of Directors. There can be no assurance that we will execute final definitive documents on terms that are favorable to us or at all.
– (5) Closing is subject to certain conditions precedent some of which are outside of our control. There can be no assurance that closing will be attained within the timeline that we
expect or at all.
– (6) These metrics are estimates based on management’s assumptions and percentage calculations regarding a potential customer’s size, energy use and previous diesel consumption
and future natural gas consumption. The estimate regarding reduction in emissions is also based on data from IEA, CO2 Emissions from Fuel Combustion Highlights - 2018, p. 147.
– (7) These terminals and facilities are each either Operational or In Development. The terminals and facilities In Development are the La Paz, Mexico Terminal and Power Plant, the
Puerto Sandino, Nicaragua Terminal and Power Plant (both currently owned by us), the Barcarena Terminal and Power Plant, the Suape Terminal and Power Plant, and the Santa
Catarina Terminal and Power Plant option (currently owned by Hygo). We expect to acquire the Barcarena, Sergipe, and Santa Catarina assets upon the closing of the Hygo acquisition
and the Suape assets upon closing of the Suape acquisition. There can be no assurance that closing will be attained within the timeline that we expect or at all.
– (8) “Online”, “Operational” “In Operation” or “Turning On” with respect to a particular project means we expect gas to be made available within thirty (30) days, gas has been made
available to the relevant project, or that the relevant project is in full commercial operations, respectively. Where gas is going to be made available or has been made available but full
commercial operations have not yet begun, full commercial operations will occur later than, and may occur substantially later than, our reported Operational date. We cannot assure
you if or when such projects will reach full commercial operations.
30Endnotes
– (9) “Under Construction” means “In Construction”, “Under Construction”, Development”, “In Development” or similar statuses means that we have taken steps and invested money to
develop a facility, including procuring land rights and entitlements, negotiating or signing construction contracts, and undertaking active engineering, procurement and construction
work. We [also] have one liquefier in Pennsylvania In Development. We also have many commercial and industrial facilities In Development for industrial and power customers. Our
development projects are in various phases of progress, and there can be no assurance that we will continue progress on each development as we expect or that each development
will be Completed or enter full commercial operations. There can be no assurance that we will be able to enter into the contracts required for the development of these facilities on
commercially favorable terms or at all. If we are unable to enter into favorable contracts or to obtain the necessary regulatory and land use approvals on favorable terms, we may not
be able to construct and operate these assets as expected, or at all. Additionally, the construction of facilities is inherently subject to the risks of cost overruns and delays, and these
risks of delay are exacerbated by the COVID-19 pandemic. If we are unable to construct, commission and operate all of our facilities as expected, or, when and if constructed, they do
not accomplish our goals, or if we experience delays or cost overruns in construction, our business, operating results, cash flows and liquidity could be materially and adversely
affected.
– (10) “addressable market” means management’s estimate of the market available to serve from our terminals and facilities that are currently Operational or Under Development. The
addressable market may be limited by the location of our terminals and the power, pipeline or other infrastructure nearby that allows us to serve customers more easily. Management’s
estimate of the addressable market does not reflect our record of sales in a particular market or our expectations with respect to our business in a particular market. “Current” reflects
each terminal or facility’s capacity to serve customers given its current infrastructure and operational constraints. “Max” refers to each terminal or facility’s potential capacity if additional
infrastructure (such as storage, regasification, truck loading bays, or pipelines) were added or if additional operational capacity were added. There can be no assurance that we will be
able to make sales to any portion of the market or any portion of a particular market. The addressable market described on this slide assumes that all terminals and power plants are
Operational, which is not expected to occur until the end of 2022. The addressable market is also dependent on the closing of the Hygo and Suape acquisitions. There can be no
assurance that closing will be attained within the timeline that we expect or at all.
– (11) The images of the terminals and power plants in Brazil, the FSRUs and the FLNG represent assets that we currently anticipate developing, constructing or developing following the
closing of the previously announced acquisitions. This infrastructure is not currently in place and there can be no assurance that such development, construction or acquisition will be
attained on the timeline we expect or at all. There can be no assurance that closing will be attained within the timeline that we expect or at all.
– (12) This statement is management’s position based on the company’s position in the gas-to-power market upon the closing of the acquisition of Hygo and GMLP. There can be no
assurance that closing will be attained within the timeline that we expect or at all.
– (13) This slide assumes that we make an Operating Margin of $1.50/MMBtu or $2.50/MMBtu, as applicable, and are able to capture 10%, 25% or 50% of the addressable market, as applicable. There can
be no assurance that we will make any particular Operating Margin or that we will capture any particular percentage of the market and actual results may differ materially from this illustration.
31Endnotes
– (14) We define “Operating Margin” as the sum of (i) Net income / (loss), (ii) Depreciation and amortization, (iii) Interest expense, (iv) Other (income) expense, net (v) Contract
termination charges and Loss on Mitigation Sales, (vi ) Loss on extinguishment of debt, net, (vii) Tax expense (benefit), and (viii)Selling, general and administrative, each as reported in
our financial statements. Operating Margin is mathematically equivalent to Revenue minus Cost of Sales minus Operations and maintenance, each as reported in our financial
statements.
– We are presenting Operating Margin on an “illustrative basis” to reflect the volumes of LNG that would be sold under binding contracts assuming our projects In Development were
fully operational for one full calendar year, multiplied by the average price per unit at which the current contracts for our Operational or In Development projects price LNG deliveries,
including both fuel sales and capacity charges or other fixed fees, less the cost per unit at which we would purchase or produce and deliver such LNG or natural gas, including the cost
to (i) purchase natural gas, liquefy it, and transport it to one of our terminals or purchase LNG in strip cargos or on the spot market, (ii) transfer the LNG into an appropriate ship and
transport it to our terminals or facilities, (iii) deliver the LNG, regasify it to natural gas and deliver it to our customers or our power plants and (iv) maintain and operate our terminals,
facilities and power plants. There can be no assurance that the actual costs of purchasing or producing LNG, transporting the LNG and maintaining and operating our terminals and
facilities will be the same as the costs used in the illustrative example and actual result in the Illustrative Operating Margins may differ materially.
– For the purpose of this Presentation and for NFE’s assets, we have assumed an average Operating Margin of between $3.66 and $4.32 per MMBtu because we assume that (i) we have
an industry average delivered cost of gas of $5.16 per MMBtu for 2021, (ii) our volumes increase over time through increased utilization of our terminals and facilities, and (iii) we will
have costs related to shipping, logistics and regasification similar to our current operations because the liquefaction facility and related infrastructure and supply chain to deliver LNG
from Pennsylvania does not exist, and those costs will be distributed over the larger volumes. NFE’s Illustrative Operating Margin from pipeline includes assets that are not yet In
Development, including the expansion of NFE’s business into three new terminals (beyond the acquisitions discussed in this Presentation) and organic growth to expand the volume of
natural gas that NFE sells through existing infrastructure in three of NFE’s currently existing geographies.
– For Hygo + Suape’s we assume an average delivered cost of gas of $5.90 based on industry averages in the region and the existing LNG contract at Sergipe. Hygo + Suape Illustrative
Operating Margin from pipeline include revenue from every terminal and power plant other than Sergipe, with the assumption that all are Operational and earning revenue through
fuel sales and capacity charges or other fixed fees.
– For GMLP, this illustration reflects the revenue from ship charters, capacity and tolling arrangements, and other fixed fees, less the cost to operate and maintain each ship, in each case
based on contracted amounts for ship charters, capacity and tolling fees, and industry standard costs for operation and maintenance. We assume an average Operating Margin of $58k
to $64k per day for ten vessels and assume no changes to the revenue from the FLNG tolling agreement.
– These costs do not include expenses and income that are required by GAAP to be recorded on our financial statements, including the return of or return on capital expenditures for the
relevant project, and selling, general and administrative costs. Our current cost of natural gas per MMBtu are higher than the costs we would need to achieve the Illustrative Operating
Margins illustrated in this Presentation, and the primary drivers for reducing these costs are the reduced costs of purchasing gas and the increased sales volumes, which result in lower
fixed costs being spread over a larger number of MMBtus sold. References to volumes, percentages of such volumes and the Illustrative Operating Margin Goal related to such
volumes (i) are not based on the Company’s historical operating results, which are limited, and (ii) do not purport to be an actual representation of our future economics. We cannot
assure you if or when we will enter into contracts for sales of additional LNG, the price at which we will be able to sell such LNG, or our costs to produce and sell such LNG. Actual
results could differ materially from the illustration and there can be no assurance we will achieve our targets.
32Endnotes
– (15) “Project Costs” means management’s internal estimates of the costs of development and construction of projects from current state through commercial operations. These costs
do not include all costs included in generally accepted accounting principles and should not be relied upon for any reason. Our project costs are based on internal evaluations, and
refer to completing certain stages of projects within a timeframe and within a spectrum of budget parameters that, when taken as a whole, are substantially consistent with our business
model.
– (16) Based on information from the United States Environmental Protection Agency Inventory of U.S. Greenhouse Gas Emissions and Sinks, information available at
https://www.epa.gov/ghgemissions/inventory-us-greenhouse-gas-emissions-and-sinks.
– (17) This slide reflects management’s expectations regarding the funding of the committed expenditures reflected. The estimated expenditures, including those related to project
costs, are not based on generally accepted accounting principles and should not be relied upon for any reason. There is no guarantee that we will reach our goals for funding the
estimated expenditures and actual results may differ from our expectations. Please see our note regarding “Forward-Looking Statements” in the slide labelled “Disclaimer” to this
Presentation for more information.
– (18) This assumes that the Hygo acquisition has closed and that we own these assets. There can be no assurance that closing will be attained within the timeline that we expect or at all.
This further reflects management’s internal estimates of the potential value of Jamalco, Nanook and Sergipe if sold to a third party but managed by us following such sale. There can
be no assurance that we will sell at our estimated price or at all, or that we would manage these assets after any such sale on terms favorable to us or at all. There is also no guarantee
that we would be willing or able to redeploy capital in businesses, terminals or facilities that would result in higher margins or growth for us in the future.
– (19) Brazil’s population is based on information from the International Monetary Fund. Please see https://www.imf.org/en/Countries/BRA. Information about the natural gas demand,
LNG imports as a percentage of the gas market, Bolivian gas imports, and the biggest customers of gas in Brazil are based on the report “Brazil’s Nascent Natural Gas Market”
prepared by Itau BBA on November 5, 2020.
– (20) We have agreed to this purchase under a memorandum of understanding which is subject to the execution of a definitive sale and purchase agreement and final approval from
the counterparty’s Board of Directors. There can be no assurance that we will execute final definitive documents on terms that are favorable to us or at all.
– (21) Our portfolio needs reflect management’s current estimate of our needs for ships based on our current Operations or planned operations for projects In Development. Our needs
for ships may change and we may require more or fewer ships than we currently estimate. In addition, there is a risk that the ships that would be acquired as a result of the Hygo
acquisition or the GMLP acquisition do not meet the operational needs of the projects as we expect.
33Endnotes
– (22) This number of FSRUs includes the conversion of the Golar Penguin and the Golar Celsius, currently owned by Hygo, from LNGCs to FSRUs. There can be no assurance that this
conversion will be successful on a particular timeline or at all.
– (23) These vessels are currently subject to contractual arrangements for various periods of time and each vessel has attributes that may limit its use to specific operational or logistical
applications. There can be no assurance that we will use the vessels for our own operations after such arrangements have concluded.
– (24) “Lease cost” is based on an average cost to lease of $35k/day for FSUs and $75k/day for FSRUs based on management’s estimates of current market rates. There can be no
assurance that market rates or the cost to lease any particular ship are in line with our expectations.
– (25) “Own cost” is based on an average cost to own of $27k/day for FSUs and $51k/day for FSRUs based on management’s estimates of operating costs, costs for periodic drydocking,
interest on the ship at 5%, and amortization of a $700mm allocation over 20 years. There can be no assurance that management’s assumptions regarding the factors used will be in line
with the actual costs, and there may be additional costs that we have not considered as part of the cost of ownership.
– (26) This pipeline is based on the volumes of natural gas that it is our goal to sell in 2025 based on NFE’s Operational and In Development projects, Hygo’s Operational and In
Development projects, the Suape project, and the expansion of NFE’s business into three new terminals (beyond the acquisitions discussed in this Presentation) and organic growth to
expand the volume of natural gas that NFE sells through existing infrastructure in three of NFE’s currently existing geographies. There can be no assurance that we will sell the volumes
of natural gas we expect through our Operational or In Development projects, or that we will be able to expand our business at the rate or on the terms that we expect.
– (27) This step reflects our assumed cost to build and the production of LNG of a new floating liquefaction plant similar to the Hilli (currently partially owned by GMLP). These costs and
production numbers are rounded from the actual costs in order to simplify the illustration and do not reflect the actual cost to build the Hilli or the amount of LNG the Hilli currently
produces. There can be no assurance that an FLNG could be built at this cost with this production profile.
– (28) This step reflects an estimate based on the current operating model of the Hilli. This assumes that we would charge current market rates to a customer who would use the new
FLNG as a tolling asset, providing it with natural gas as feedstock and paying us for the service of liquefying and returning the gas as LNG. Then, we would purchase LNG from the
customer at a markup. Based on current market rates of 9.5% of Brent, we assume that we would purchase LNG for $4.75/MMBtu. In addition, we would make an assumed $1.75 per
MMBtu Operating Margin for our tolling fees from the customer for our liquefaction services. The new FLNG would allow us to subtract our Operating Margin of $1.75 from our $4.75
price of LNG, leading to a net cost of $3.00 per MMBtu. There can be no assurance that any FLNG would achieve our assumed Operating Margin or that we would be able to purchase
LNG from our own customer or the market at any particular price. Please see our note regarding “Forward-Looking Statements” in the slide labelled “Disclaimer” to this Presentation for
more information.
34You can also read