Investor Presentation - Winter 2023 - Freehold Royalties Ltd
←
→
Page content transcription
If your browser does not render page correctly, please read the page content below

Investor
         Presentation
         Winter 2023

freeholdroyalties.com   TSX FRU   Quality Assets • Sustainable Dividends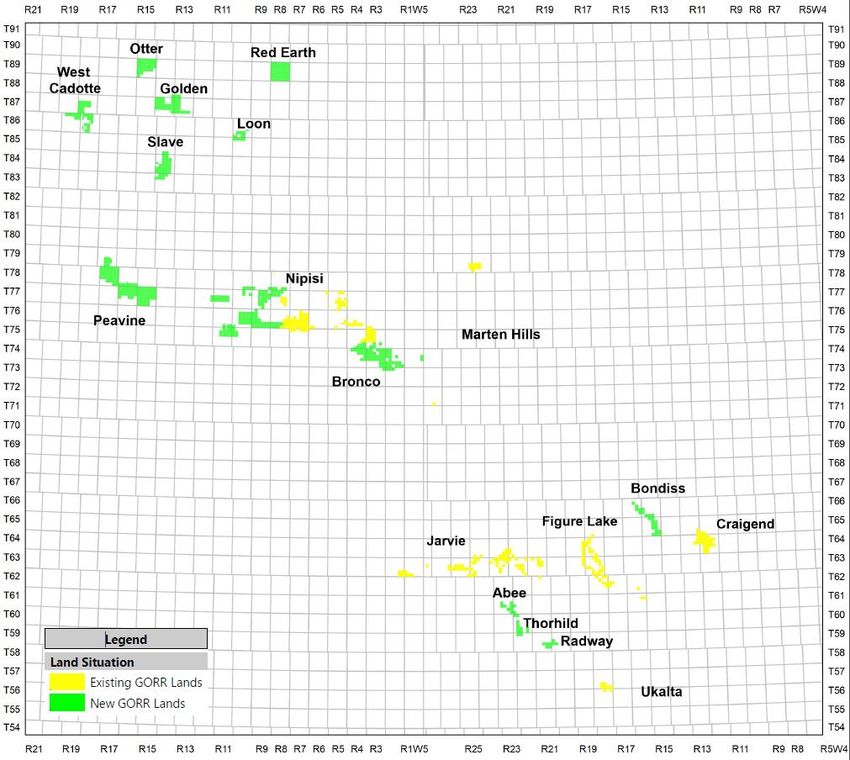
Investment Highlights
         A North American energy royalty company

               7.2% dividend yield                                                                                Torque to commodity
                            current dividend coverage to $40 WTI                                                                direct returns to shareholders without
                                                                                                                                cost inflation

               ESG friendly investment                                                                            High margin asset class
                            rated top 1% among global oil producers                                                             >95% operating margin

               Diversified assets                                                                                 Financial strength
                            ownership in the top North American                                                                 low debt levels & strong free cash flow
                            basins

                                                                                                                                                                  Winter 2023 | 2

Dividend yield based on $15.00 share price and $0.09/share monthly dividend rate. ESG rating based on Sustainalytics 2022 ESG
ranking. Operating margin reflects Q3-2022 realized price minus operating costs, ad valorem costs and interest expense.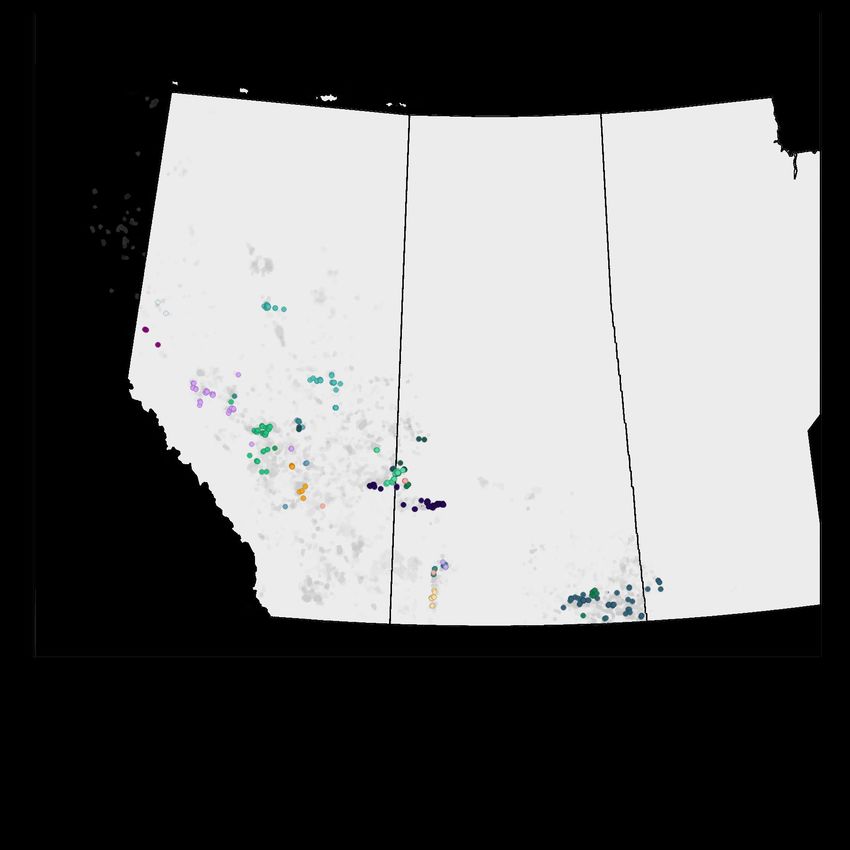
US Royalty Expansion
       Adding core positions in the Permian and Eagle Ford
       ▪ In Q3-2022, Freehold closed transactions, adding                                                                                                                                Howard
                                                                                                                                                                                         County           Eagle Ford
         core positions in the Midland Permian (Howard                                                                                                                                   Midland
         County) and Eagle Ford for CAD$159 million                                                       Purchase price (CAD$, mm, net of estimated closing
                                                                                                                                                                                           $126               $33
                                                                                                          adjustments)

                                                                                                          Net Royalty Acres                                                               4,400              2,500
       ▪ Transaction highlights include:
           – $38 million in 2023 forecast funds from operations                                           2023E production (boe/d)                                                          750               250

           – Forecast average 1,000 boe/d in 2023 production                                              2023E funds from operations (CAD$, mm, futures
                                                                                                                                                                                            $27                $6
                                                                                                          pricing)1
           – 6,900 net royalty acres (Permian, Eagle Ford focused,
             >90% mineral rights)
                                                                                                                                                                       FRU Land

                                                                                                                                                                      Howard County Acquisition

       ▪ All transactions funded through the utilization of                                                                                                            Eagle Ford Acquisition
         Freehold’s credit facility and funds from operations                                                                                                          Basin Outlines

           – Freehold continues to maintain financial flexibility with an
             estimated >$100 million in undrawn credit at YE 2022
           – Inclusive of the transactions, exited Q3-2022 at ~0.5x net
             debt to trailing funds from operations

                                                                                                             6 mi

1Assumes  a 2023 average West Texas Intermediate price of US$74/barrel of oil and a NYMEX natural gas price of US$5.75/Mcf and an exchange rate of US$0.75 for every CDN$1.00.
                                                                                                                                                                                                  Winter 2023 | 3
C$ unless otherwise noted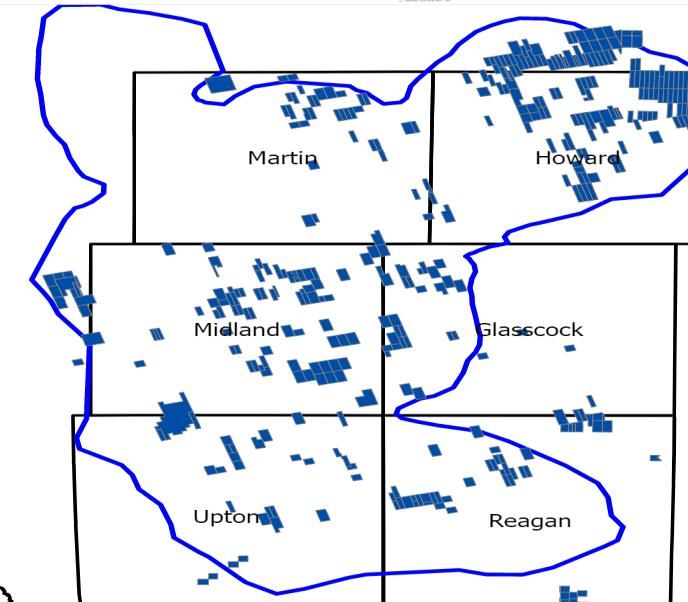
Canadian Royalty Expansion
Expanding Clearwater Land Base
▪ Freehold closed a royalty transaction prospective for
  Clearwater oil

▪ Transaction adds over 300,000 gross acres to
                                                              Clearwater transaction
  Freehold’s Clearwater land position, tripling Freehold’s     adds acreage in the
  current land position                                      northwest section of the
▪ Expands Freehold’s acreage into new production and                  Play
  exploration areas of the play

▪ $18.4 million transaction includes a drilling
  commitment with a strategic partner with a track
  record of development success

▪ We expect the development of the Clearwater to be a
  key driver of Canadian organic growth for Freehold as
  we enter 2023

Clearwater Production Profile
Production (boe/d)

                     340
                     300
                     260
                     220
                     180
                     140
                     100
                           Mar-21

                           Mar-22
                           Oct-21

                           Oct-22
                           Nov-21
                           Dec-21
                           Jan-21

                           Apr-21

                           Jun-21
                            Jul-21

                           Sep-21

                           Jan-22

                           Apr-22

                           Jun-22
                            Jul-22

                           Sep-22
                           Feb-21

                           May-21

                           Aug-21

                           Feb-22

                           May-22

                           Aug-22

                                                                                   Winter 2023 | 4

Source: Company Reports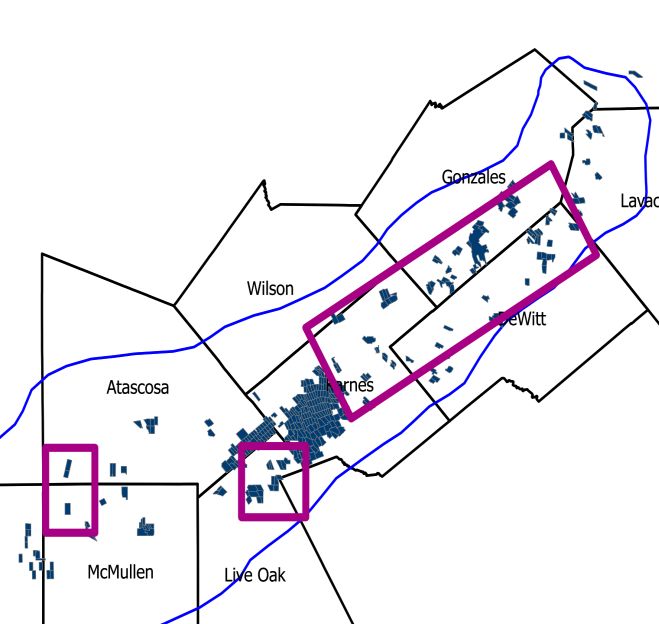
Inflation Hedge
      Performance Through All Commodity Cycles
      ▪ Freehold is not exposed to capital or operating costs
      ▪ Significant margin advantage relative to E&P producers
                                ▪ Operating and capital cost inflation (15%-30% increase YoY) have no influence on Freehold’s cash
                                  flow profile
      ▪ In an inflationary environment Freehold’s operating margin will stay flat and not compress as
        an E&P’s would
      Price Performance                                                                                          2023 Consensus Capex Change Q1-Q3/22
                              110                                                                                                            50%

                                                                                                                  Consensus Capex Increase
                              100
       Relative Performance

                                                                                                                                             40%
                              90
                                                                                                                                             30%
                              80
                                                                                                                                             20%
                              70
                                                                                                                                             10%
                              60

                              50                                                                                                             0%
                                    Jun     Jul      Aug         Sep     Oct     Nov     Dec       Jan                                             E&P E&P E&P E&P E&P E&P E&P E&P E&P E&P
                                                                                                                                                   Peer Peer Peer Peer Peer Peer Peer Peer Peer Peer
                                          Freehold         WTI         Canadian Energy Index
                                                                                                                                                    1    2    3    4    5    6    7    8    9    10

                                                                                                                                                                                     Winter 2023 | 5
Source | Company Reports, FactSet, National Bank Financial; Peer group includes PEY, TVE, PIPE, VET, POU, KEL, SDE, CPG, ARX, SGY
Balanced Portfolio
Commodity Portfolio Clearwater
Deep
Basin Mannville
~20% of
65%
Cardium
Revenue Conv Viking
Production Gas
SE
Sask
Production
60%
Volumes Revenue
38%
Natural
Gas 62% 35%
Oil &
NGL’s Production
40%
~80% of Revenue
Revenue
Permian
Eagle
Proforma 2022 Proforma 2022 Ford
Acquisitions Acquisitions Note | Circles represent share of YTD revenue,
including impact of 2022 acquisitions
Winter 2023 | 6
Source | Company Reports, Proforma 2022 forecasts assumes midpoint of FRU 2022E production guidance, US$94/bbl WTI, US$19/bbl
heavy oil differentials, US$2/bbl light oil differentials, US$6/mcf NYMEX, $5/mcf AECO.Diversity Amongst Payors
Diversified Group of Well Capitalized Producers
▪ North American royalty portfolio provides exposure to a broad group of oil and gas plays across North
America
▪ No payor represents > 15% of 12-months trailing revenue
▪ Top 10 payors represent ~ 50% of 12-month trailing revenue
Winter 2023 | 7
Source: Company ReportsBetter Pricing, Growth, Opportunity
Upstream capital drives growth Oil production growth driven by Texas
$166 9 +2.4 million bbls/d
6x investment in the US
Oil Prod (MMbbl/d)
Permian &
8 Eagle Ford
$121
US$ billions
$110 7
$88 6 6x growth
5
4 +0.4 million bbls/d
$21 $17 $22 $23
3 Oil Sands &
2 Conventional
2019 2020 2021 2022 2014 2016 2018 2020 2022E 2024E 2026E
Significantly larger M&A opportunity set Better oil and gas pricing on US assets
31
$2bn Since 2019 Nymex Natural Gas Benchmark $11/mcf
Realized Price $9/mcf
Realized Price $5/mcf
+97% on gas
$10 406 WTI Crude Oil Benchmark $119/bbl
billion deals
Realized Price $121/bbl
Realized Price $105/bbl
5x investment 13x transactions +15% on oil
Winter 2023 | 8
Source | Company Reports, Peters & Co, IHS, Canadian Association of Petroleum Producers, EIA, Enverus. Canadian
capital Spending includes oil sands spending, realized price based on Q3-2022 results released November 8th.Bigger & Better Freehold
>$500mm of US assets added over 2 years Significant FFO growth, solid balance sheet
16,000 $350
50% growth
14,000
Corporate Production (boe/d)
since Q2-2020 $300
US
12,000
$250
10,000
Funds From Operations
Canada
$ millions
8,000 $200
6,000
$150
4,000
$100
2,000
Net Debt
0 $50
2020 Q1
2020 Q2
2020 Q3
2020 Q4
2021 Q1
2021 Q2
2021 Q3
2021 Q4
2022 Q1
2022 Q2
2022 Q3
$0
2019 2020 2021 2022E
Winter 2023 | 9
Source | Company Reports, 2022E forecasts based on the midpoint of 2022E guidance released November 8, 2022 assumes midpoint of FRU
2022E production guidance, US$94/bbl WTI, US$19/bbl heavy oil differentials, US$2/bbl light oil differentials, US$6/mcf NYMEX, $5/mcf AECOFreehold Return Profile
60% Payout Ratio
Return of ▪ Dividend of $0.09/share announced at Q3-2022 is
Capital to the highest level since 2015
Shareholders ▪ Current dividend reflects ~60% payout at US
$75/bbl WTI for 2023
2022E
Funds from Less than 1.0x Funds From Operations
Operations Balance Sheet ▪ Q3-2022 net debt to funds from operations 0.5x
Strength ▪ 2022E YE undrawn credit capacity estimated to be
$300-$320 greater than $100 million
million
Disciplined, Strategic Investment
▪ ~$375 million in acquisitions in 2021
Portfolio ▪ ~$180 million in acquisitions in 2022
Growth ▪ Freehold continues to evaluate and execute on
attractive acquisition opportunities that provide long
term shareholder value
Winter 2023 | 10
For illustrative purposes and should not be relied on as indicative of future results, 2022E forecasts based on midpoint of FRU 2022E
production guidance, US$94/bbl WTI, US$19/bbl heavy oil differentials, US$2/bbl light oil differentials, US$6/mcf NYMEX, $5/mcf AECOBalanced Returns
FRU has maintained a balance between dividend growth, portfolio growth, debt reduction
20
Dividend Change
18
Deal Announcement
16
Share Price ($/share)
14
12
10
8 Dividend increased 6 times from $0.015 to $0.09/share over last 8
6 quarters
4 Current dividend yield 7.2%
2 Executed greater than $550 million in transactions since 2021
maintaining balance sheet strength
0
Aug-21
Aug-22
May-21
May-22
Nov-21
Dec-21
Nov-22
Dec-22
Jan-21
Jan-22
Mar-21
Jun-21
Mar-22
Jun-22
Oct-21
Oct-22
Feb-21
Apr-21
Jul-21
Sep-21
Feb-22
Apr-22
Jul-22
Sep-22
Winter 2023 |11
Source | FactsetSustainable Through All Commodity Cycles
120
West Texas intermediate (US$/bbl)
100
Business planning on a long term WTI price of US$75/bbl
80
60
40
Current dividend payable down to ~US$40/bbl WTI
20
0
2012 2013 2014 2015 2016 2017 2018 2019 2020 2021 2022 2023
WTI Crude Oil (US$/bbl) Futures Pricing
Winter 2023 |12
Source | FactsetLong History of Returns
Matching growth in dividend to growth in production and cash flow
Dividend ($/share)
$3
$2
▪ From an Initial Public Offering of
$10/share in 1996, Freehold has paid $1
out $1.9 billion in dividends to its
shareholders (~$34/share) $0
2023E
1997
1998
1999
2000
2001
2002
2003
2004
2005
2006
2007
2008
2009
2010
2011
2012
2013
2014
2015
2016
2017
2018
2019
2020
2021
2022
▪ Q3-2022 payout 47%, below the
outlined target of 60% Dividend per Share
– Increased monthly payout from $0.08 to Cumulative Revenue, FFO, & Dividends Since IPO
$0.09/share as part of Q2-2022 results $3.5
$3.0
– Sixth dividend increase over the last nine
quarters $2.5
$ billions
$2.0
▪ Providing a sustainable dividend $1.5
remains a top priority in terms of $1.0
returns for our shareholders $0.5
$0.0
Revenue Funds from Operations Dividends
Winter 2023 |13
*2023E denotes current monthly dividend annualizedWhy Own Freehold
Strong Balance Quality Long
High Margins Sustainable Sheet, Low Risk Duration Assets,
Business Multi-year Upside
▪ High operating margin ▪ Increased dividend as ▪ Q3-2022 net debt to ▪ Positioned in the top tier
provides Freehold the part of Q2-2022 results trailing funds from oil plays – Eagle Ford,
ability to pay a in tandem with the operations 0.5x Permian, Clearwater,
meaningful dividend completion of a number Viking, and Bakken
▪ In the absence of
across all commodity of accretive acquisitions
acquisitions and further ▪ Diverse operator list
cycles
▪ 2021 payout 33% dividend increases, reduces exposure risks
▪ Transformed Freehold to a expect to have >$100
▪ 2022E payout ~45% ▪ Royalty payors represent
pure play royalty company million in undrawn credit
strong suite of
with a diversified asset ▪ 2023E payout ~60% at at YE 2022
investment grade
base, deriving ~60% of US$75/bbl WTI
companies and private
revenue from Canada and
▪ ~7.2% dividend yield entities focused on
40% from the US
growth
Winter 2023 | 14
US$94/bbl WTI, US$19/bbl heavy oil differentials, US$2/bbl light oil differentials, US$5/mcf NYMEX, C$5/mcf AECO. 2022 forecasts assume midpoint of FRU 2022 production guidance. Dividend yield
assumes $15.00/share and $0.09/share monthly dividend. Payout is a Non-GAAP ratio or other specified financial measures. See “Non-GAAP Ratios and Other Financial Measures” in the Advisories.Investor Relations
tf. 888.257.1873
t. 403.221.0833
w. freeholdroyalties.com
freeholdroyalties.com TSX FRU Quality Assets • Sustainable Dividends2022 Third Quarter Results
Q3/2022 Q3/2021 Change
Production boe/d 14,219 11,265 26%
Funds from operations mm $80.8 $48.2 68%
Period end net debt mm $159.9 $75.3 112%
Netback per boe $69.77 $46.60 50%
Payout ratio % 47% 35% 34%
Cash costs per boe $3.62 $2.49 45%
▪ 14,219 boe/d Q3-2022 production average represents a record quarter for Freehold
▪ Volumes up 26% y/y, 6% q/q
▪ 304 gross (6.7 net) wells drilled on our royalty lands
▪ >760 gross wells drilled F9-2022
▪ Prospects targeting oil in the Viking, SE Saskatchewan, Clearwater, Permian, and Eagle Ford in addition to gas focused
drilling in Spirit River
▪ Q3-2022 payout of 47%, up from 34% during the same period last year
▪ Freehold increased its dividend 13% during the quarter, the sixth increase over the last nine quarters
▪ Period end net debt of $160 million while completing $162 million in acquisitions over the quarter
▪ Acquisitions added to Freehold’s royalty position in the Permian, Eagle Ford and Clearwater
Winter 2023 |16
Netback, cash costs, payout ratio are Non-GAAP ratios or other specified financial measures.
See “Non-GAAP Ratios and Other Financial Measures” in the advisories, C$ unless otherwise notedYTD Royalty Drilling Results
Top Canadian Drillers
Gross Wells Net Wells
Q3-2022 represented
one of Freehold’s top Teine Energy 57 5.1
quarters for activity Tamarack Valley 31 1.0
Permian Haynesville
>30 rigs running on
Freehold’s North Whitecap Resources 26 0.8
American assets Bonterra Energy 24 0.6
Crescent Point Energy 20 0.6
Clearwater Eagle Ford Total Canadian Wells 366 13.9
Top US Drillers
Deep Basin Gross Wells Net Wells
Pioneer Resources 57 0.1
Marathon Oil 50 1.0
Viking Crownquest Operating
Spirit River 30 0.1
Co.
ConocoPhillips 24 0.1
SK Bakken Total US Wells 398 2.0
Canadian Wells 366 13.9
US Wells 398 2.0
Total Wells 764 15.9
Winter 2023 | 19The Royalty Advantage
Freehold provides a lower risk/return proposition than traditional E&P’s
Environmental, Social,
Financial Strength, Low Risk Diversified Royalty Portfolio
Governance
▪ Strong operating margins, enable ▪ Diversified North American ▪ Our approach to ESG is rooted in
lower breakeven commodity portfolio with exposure to our collective desire to provide a
prices, enhancing the Permian, Eagle Ford, Viking, long-term value proposition to
sustainability of payout Clearwater, Bakken, Mississippian, our shareholders
▪ Q3-2022 corporate netback of and Cardium oil plays plus natural ▪ Royalties offer no exposure to
~$70/boe gas plays targeting the Spirit environmental pressures
▪ Ability to grow the dividend, and River, Montney and Haynesville ▪ Expect to update our ESG
generate meaningful free funds via well funded producers strategy through a sustainability
flow at in the current commodity ▪ 6.4 million royalty acres in report in late 2022
price environment Canada, 0.9 million gross drilling ▪ Freehold has strong leadership,
▪ Financial flexibility with net debt units in the U.S. an engaged and idea rich
to funds from operationsRoyalties vs. Exploration and Production Companies
Royalties provide lower costs and higher returns to shareholders
A Working Interest Barrel A Royalty Interest Barrel
Operating netback Operating netback
~ 60% of gross revenue ~ 100% of gross revenue
▪ The royalty model maintains a
material netback advantage
over traditional E&P’s
100%
▪ Able to generate free funds flow 15 %
Royalties Paid 80%
at lower commodity prices
25 %
60%
▪ Q3-2022 corporate netback Operating Costs
Operating
~$70/boe
Netback 40%
▪ Freehold maintains a >95%
operating margin enabling more
60%
Operating Netback
100% 20%
(60% of gross revenue) of gross revenue
return to shareholders
0%
Winter 2023 | 19
Payout ratio and netback are Non-GAAP ratios or other specified financial measures. Operating margin reflects Q3-2022 realized price minus operating costs, ad valorem costs and interest expense. See "Non-GAAP Ratios and
Other Financial Measures" in the Advisories.Safe, Lower Risk Asset Base
2019 2020 2021 F9-2022
Production (boe/d) 10,628 9,781 11,844 13,784
Acquisitions (millions) $49 $7 $377 $184
Royalty acres (millions) 6.7 6.3 6.2 6.4
U.S. gross drilling unit acres (millions) - - 0.8 0.9
Tax pools (millions) $838 $775 $1,001 -
Net debt/funds from operations 0.8x 0.9x 0.5x 0.5x
Winter 2023 | 20Strong Balance Sheet
▪ Freehold exited Q3-2022 with 5.0x
Net Debt to Funds from Operations
net debt to trailing funds from 4.5x
operations of 0.5x 4.0x
3.5x
▪ At current commodity price
levels and dividend level, 3.0x
Freehold has capacity to pay 2.5x
down debt or pursue 2.0x
acquisitions with free funds 1.5x
▪ Freehold extended its credit 1.0x
facility with an unchanged 0.5x
committed revolving 3-year 0.0x
facility at $285 million and $15
2022E
2010
2011
2012
2013
2014
2015
2016
2017
2018
2019
2020
2021
million operating facility
Sector Average Freehold
Winter 2023 | 21
Sector average sourced from Research estimates
Sector average reflects Canadian upstream producersIndustry Drilling vs. Freehold
▪ We have seen a strong upward momentum in 20,000 25
activity on Freehold’s royalty land along with
18,000
Gross Wells Western Canada
the broader Western Canadian Sedimentary
portfolio 16,000 20
Freehold net Wells
14,000
▪ Approximately 6% of all spending in Western
Canada has occurred on Freehold lands over 12,000 15
the past five years 10,000
8,000 10
▪ Approximately 2% of all lower 48 spending
occurred on Freehold land over the past five 6,000
years
4,000 5
▪ Freehold’s royalty portfolio has materially 2,000
outperformed the broader Western Canadian 0 0
Sedimentary Basin
2022E
2010
2011
2012
2013
2014
2015
2016
2017
2018
2019
2020
2021
▪ Growth in net wells reflects the quality of
Freehold’s underlying royalty portfolio Western Canadian Drilling Freehold Net Drilling
Winter 2023 | 22
Source: Canadian Association of Energy Contractors
Forecast based on Petroleum Services Association of Canada, and Freehold Q3-2022 results.Cash Costs
Freehold has shown a strong trending down in cash costs
$7.00
▪ Q3-2022 cash costs of
$6.00
$3.62/boe facilitate a
strong corporate netback
$5.00
for Freehold
Cash Costs ($/boe)
$4.00
▪ Freehold’s operating
margin >90% $3.00
▪ Changes in costs reflect $2.00
disposition of working
interest and higher $1.00
production volumes
relative to G&A and $0.00
interest charge increases Q1-20 Q2-20 Q3-20 Q4-20 Q1-21 Q2-21 Q3-21 Q4-21 Q1-22 Q2-22 Q3-22
Operating Costs ($/boe) Interest Expense ($/boe) General & Administrative ($/boe)
Winter 2023 | 23
Cash costs are equal to operating costs + interest expense + G&A costs (see non-GAAP Financial Measures)
Payout ratio and netback are Non-GAAP ratios or other specified financial measures. See "Non-GAAP Ratios and Other Financial Measures" in the Advisories.Royalty Production History
16,000
14,219 14,250
14,005 13,676
14,000 13,453
Royalty Production (boe/d)
12,000 11,137 11,265
10,618 10,946
10,139 10,311 10,149 10,315
10,000 9,605
9,150 9,096
8,000
6,000
4,000
2,000
0
2022E
Q1-19
Q2-19
Q3-19
Q4-19
Q1-20
Q2-20
Q3-20
Q4-20
Q1-21
Q2-21
Q3-21
Q4-21
Q1-22
Q2-22
Q3-22
Winter 2023 | 24
*Assumes the midpoint of 2022E production guidance.Disciplined Acquirer
Freehold will continue to look for opportunities that enhance the resiliency
and durability of our portfolio across all commodity price cycles
Cost Initial Production
Year Area ($ millions) Acquired (boe/d)
2012 AB, SK and BC 60 600
2013 Numerous small acquisitions 10 30
2014 SK/MB/AB 248 1,500
2015 SK/AB/BC 410 2,100
2016 SK/AB 162 1,700
2017 SK/AB 87 420
2018 SK/AB 62 275
2019 SK/AB, US 50 410
2020 US 8 -
2021 US 377 4,400
2022 US/Canada 183 1,400
TOTAL $1,657 12,835
Winter 2023 | 252022E Guidance
Guidance August 9
2022E Annual Average
2022
Average production boe/d 13,750-14,750
Funds from operations million $300-$320
West Texas Intermediate crude oil US$/bbl $97.00
Edmonton Light Sweet crude oil Cdn$/bbl $120.00
AECO natural gas Cdn$/mcf $5.00
NYMEX natural gas US$/mmbtu $5.00
Exchange rate US$/Cdn$ 0.79
Winter 2023 | | 26
Source: Company Reports.Advisories
Forward-Looking Statements
This presentation offers our assessment of Freehold’s future plans and operations as at January 8, 2022 and contains forward-looking information including, without limitation, future dividends per share; the expectation that operating and
capital cost inflation will not influence Freehold’s cash flow profile; the expectation that DUCs will contribute to H2 2022 production and that permits will contribute to H2 2022 and H1 2023 production; the expectation that an inventory of
permits and DUCs will drive near term production additions; estimated Q3 and Q4 2022 corporate production; expectation of US$94-$97/bbl WTI, US$13-19/bbl heavy oil differentials, US$2-3/bbl light oil differentials, US$5-6/mcf NYMEX,
$5/mcf AECO; forecasts of strong growth within Freehold’s US portfolio through H2 2022; forecasted debt to trailing funds from operations ratio at year end; the expectation that Q4 2022 US production will represent approximately 35% of
corporate production and 40% of revenue; estimated 2023 funds from operations; expectation oil production in the US will continue to rise; Freehold's expectation to continue to assess optimal allocation of free funds between shareholder
returns and portfolio growth, and expectation of continuing to execute on attractive opportunities that provide long term shareholder value; the expectation that strong free funds flow continues to provide option value to return capital to
shareholders through continued evaluation of our monthly base dividend; expected year end 2022 net debt to funds from operations ratio; forecast payout for 2022; estimated 2022 guidance; that Freehold will balance portfolio investment
and dividend growth through the remainder of 2022; anticipated cumulative dividends per share in 2022 and 2023; expectation that we will continue to have a diverse set of royalty payors; the expectation we will release a sustainability
report in late 2022; expectation Freehold can maintain a >90-95% operating margin and estimated 2022 royalty production.
This forward-looking information is provided to allow readers to better understand our business and prospects and may not be suitable for other purposes. By its nature, forward-looking information is subject to numerous risks and
uncertainties, some of which are beyond our control, including: volatility in market prices for crude oil, NGL and natural gas; the impacts of the Russian-Ukraine war and associated sanctions on the global economy and commodity prices;
geopolitical instability, political instability; the continuing impact of the COVID-19 pandemic on demand and commodity prices; future capital expenditure by Freehold; future capital expenditure levels by other royalty payor; future production
levels; future exchange rates; future tax rates; future legislation; the cost of developing and expanding our assets; the impacts of inflation and supply chain shortages on the operations of our industry partners and royalty payors; our ability
and the ability of our industry partners and royalty payors to obtain equipment in a timely manner to carry out development activities; our ability to market our product successfully to current and new customers; our expectation for the
consumption of crude oil, NGLs and natural gas; our expectation for industry drilling levels on our royalty lands; the impact of competition; our ability to obtain financing on acceptable terms; our ability to add production and reserves through
our development and acquisitions activities; lack of pipeline capacity; currency fluctuations; changes in income tax laws or changes in tax laws, regulations, royalties, or incentive programs relating to the oil and gas industry; reliance on
royalty payors to drill and produce on our lands and their ability to pay their obligations; uncertainties or imprecision associated with estimating oil and gas reserves; stock market volatility; our ability to access sufficient capital from internal
and external sources; a significant or prolonged downturn in general economic conditions or industry activity; incorrect assessments of the value of acquisitions; competition for, among other things, capital, acquisitions of reserves,
undeveloped lands and skilled personnel; geological, technical, drilling, and processing problems; unanticipated litigation; and environmental risks and liabilities inherent in oil and gas operations. Risks are described in more detail in Freehold’s
annual information form for the year ended December 31, 2021 which is available under Freehold’s profile on SEDAR at www.sedar.com.
You are cautioned that the assumptions used in the preparation of such information, although considered reasonable at the time of preparation, may prove to be imprecise and, as such, undue reliance should not be placed on forward looking
information. We can give no assurance that any of the events anticipated will transpire or occur, or if any of them do, what benefits we will derive from them. The forward-looking information contained herein is expressly qualified by this
cautionary statement. To the extent any guidance or forward-looking statements herein constitute a financial outlook, they are included herein to provide readers with an understanding of management's plans and assumptions for budgeting
purposes and readers are cautioned that the information may not be appropriate for other purposes. Our policy for updating forward-looking statements is to update our key operating assumptions quarterly and, except as required by law, we
do not undertake to update any other forward-looking statements.
You are further cautioned that the preparation of financial statements in accordance with International Financial Reporting Standards requires management to make certain judgments and estimates that affect the reported amounts of assets,
liabilities, revenues, and expenses. These estimates may change, having either a positive or negative effect on net income, as further information becomes available and as the economic environment changes.
Winter 2023 |27Advisories continued
Production
All production disclosed herein is considered net production for the purposes of National Instrument 51-101 – Standards of Disclosure for Oil and Gas Activities, which includes Freehold's working interest (operating and non-operating) share after
deduction of royalty obligations, plus our royalty interests. Since Freehold has minimal working interest production, net production is substantially equivalent to Freehold's royalty interest production. In the second quarter of 2022, Freehold's net
production of 13,453 boe/d consisted of 5,378 bbls/d of light oil, 1,239 bbls/d of heavy oil, 1,613 bbls/d of natural gas liquids and 31,336 mcf/d of natural gas. For the full year of 2021, Freehold's net production of 11,884 boe/d consisted of
4,342 bbls/d of light oil, 1,184 bbls/d of heavy oil, 1,217 bbls/d of natural gas liquids and 30,608 mcf/d of natural gas.
Conversion of Natural Gas to Barrels of Oil Equivalent (BOE)
The 6:1 boe ratio is based on an energy equivalency conversion method primarily applicable at the burner tip. It does not represent a value equivalency and is not based on either energy content or current prices. While the boe ratio is useful for
comparative measures, it does not accurately reflect individual product values and might be misleading, particularly if used insolation. As well, given the value ratio, based on the current price of crude oil to natural gas, is significantly different
from the 6:1 energy equivalency ratio, using a 6:1 conversion ratio may be misleading as an indication of value.
Winter 2023 |28Advisories continued
Non-GAAP Financial Measures
Within this presentation, references are made to terms commonly used as key performance indicators in the oil and gas industry. We believe that netback, payout ratio and cash costs are useful supplemental measures for management and
investors to analyze operating performance, financial leverage, and liquidity, and we use these terms to facilitate the understanding and comparability of our results of operations and financial position. However, these terms do not have any
standardized meanings prescribed by generally accepted accounting principles ("GAAP") and therefore may not be comparable with the calculations of similar measures for other entities.
Netback, which is calculated on a boe basis as average realized price less production and ad valoreum taxes, operating expenses, general and administrative and cash interest charges, represents the per unit cash flow amount allowing the
Company to benchmark how changes in commodity pricing, net of production and ad valoreum taxes, and our cash-based cost structure compare against prior periods.
Payout ratios are often used for dividend paying companies in the oil and gas industry to identify dividend levels in relation to funds from operations that are also used to finance debt repayments and/or acquisition opportunities. Payout ratio
is calculated as dividends paid as a percentage of funds from operations.
Cash costs, which is also calculated on a boe basis, is comprised of recurring cash based costs, excluding taxes, reported on the statements of operations. For Freehold, cash costs are identified as operating expense, general and
administrative expense and cash-based interest and financing charges and share-based pay outs. Cash costs allow Freehold to benchmark how changes in its manageable cash-based cost structure compare against prior periods.
For further information related to these non-GAAP terms, including details of how these ratios are calculated, see our most recent management's discussion and analysis, which is available on SEDAR at www.sedar.com and is incorporated
herein.
This presentation also contains the capital management measures of working capital, net debt, capitalization and net debt to funds from operations as defined in Note 11 to the condensed consolidated financial statements as at and for the
three months ended June 30, 2022.
Winter 2023 |29Investor Relations
tf. 888.257.1873
t. 403.221.0833
w. freeholdroyalties.com
freeholdroyalties.com TSX FRU Quality Assets • Sustainable DividendsYou can also read