Ion Torrent sequencing as a tool for mutation discovery in the flax (Linum usitatissimum L.) genome
←
→
Page content transcription
If your browser does not render page correctly, please read the page content below
Galindo-González et al. Plant Methods (2015) 11:19
DOI 10.1186/s13007-015-0062-x
                                                                                                                                      PLANT METHODS

 METHODOLOGY                                                                                                                                  Open Access

Ion Torrent sequencing as a tool for mutation
discovery in the flax (Linum usitatissimum L.)
genome
Leonardo Galindo-González1*†, David Pinzón-Latorre1†, Erik A Bergen1, Dustin C Jensen2 and Michael K Deyholos3

  Abstract
  Background: Detection of induced mutations is valuable for inferring gene function and for developing novel
  germplasm for crop improvement. Many reverse genetics approaches have been developed to identify mutations in
  genes of interest within a mutagenized population, including some approaches that rely on next-generation sequencing
  (e.g. exome capture, whole genome resequencing). As an alternative to these genome or exome-scale methods, we
  sought to develop a scalable and efficient method for detection of induced mutations that could be applied to a small
  number of target genes, using Ion Torrent technology. We developed this method in flax (Linum usitatissimum),
  to demonstrate its utility in a crop species.
  Results: We used an amplicon-based approach in which DNA samples from an ethyl methanesulfonate
  (EMS)-mutagenized population were pooled and used as template in PCR reactions to amplify a region of each
  gene of interest. Barcodes were incorporated during PCR, and the pooled amplicons were sequenced using an Ion
  Torrent PGM. A pilot experiment with known SNPs showed that they could be detected at a frequency > 0.3% within
  the pools. We then selected eight genes for which we wanted to discover novel mutations, and applied our approach
  to screen 768 individuals from the EMS population, using either the Ion 314 or Ion 316 chips. Out of 29 potential
  mutations identified after processing the NGS reads, 16 mutations were confirmed using Sanger sequencing.
  Conclusions: The methodology presented here demonstrates the utility of Ion Torrent technology in detecting
  mutation variants in specific genome regions for large populations of a species such as flax. The methodology could
  be scaled-up to test >100 genes using the higher capacity chips now available from Ion Torrent.
  Keywords: Linum usitatissimum, Reverse genetics, Ion Torrent, EMS

Background                                                                           potential of flax, as well as interesting aspects of its
Flax (Linum usitatissimum L.) is cultivated as a source                              biology (including well-documented phenotypic and
of either oil or fiber, both of which have distinct proper-                          genomic plasticity of some accessions [1]), have led to an
ties that make flax a valuable crop. The oil of flax seeds                           increase in research activity in this species, highlighted by
(i.e. linseed) is rich in polyunsaturated fatty acids includ-                        the release of an assembly of its whole genome sequence
ing alpha-linolenic acid, which has purported health                                 [2]. To accelerate the development of novel germplasm
benefits and is also useful as a drying oil in manufacture                           and to better exploit the available DNA sequence re-
of resins, finishes, and flooring. The stem phloem fibers                            sources for flax, we sought to develop a mutant popula-
(i.e. bast fibers) of flax are remarkably long and strong                            tion and a reverse genetics platform for this crop.
and are used for textiles and increasingly as substitutes                              Mutations can be induced by treating individuals with
for fiberglass in composite materials. The commercial                                physical, biological or chemical mutagens [3]. Ethyl
                                                                                     methanesulfonate (EMS) is widely used for inducing
* Correspondence: galindo@ualberta.ca                                                point mutations in plants [4-12], and results mostly in
†
 Equal contributors                                                                  G/C to A/T transitions [4] that show a nearly random
1
 Department of Biological Sciences, University of Alberta, Edmonton, AB,
Canada, T6G 2E9
                                                                                     distribution throughout the genome. While one study
Full list of author information is available at the end of the article               showed that the frequency of EMS-induced mutations
                                        © 2015 Galindo-González et al.; licensee BioMed Central. This is an Open Access article distributed under the terms of the
                                        Creative Commons Attribution License (http://creativecommons.org/licenses/by/4.0), which permits unrestricted use,
                                        distribution, and reproduction in any medium, provided the original work is properly credited. The Creative Commons Public
                                        Domain Dedication waiver (http://creativecommons.org/publicdomain/zero/1.0/) applies to the data made available in this
                                        article, unless otherwise stated.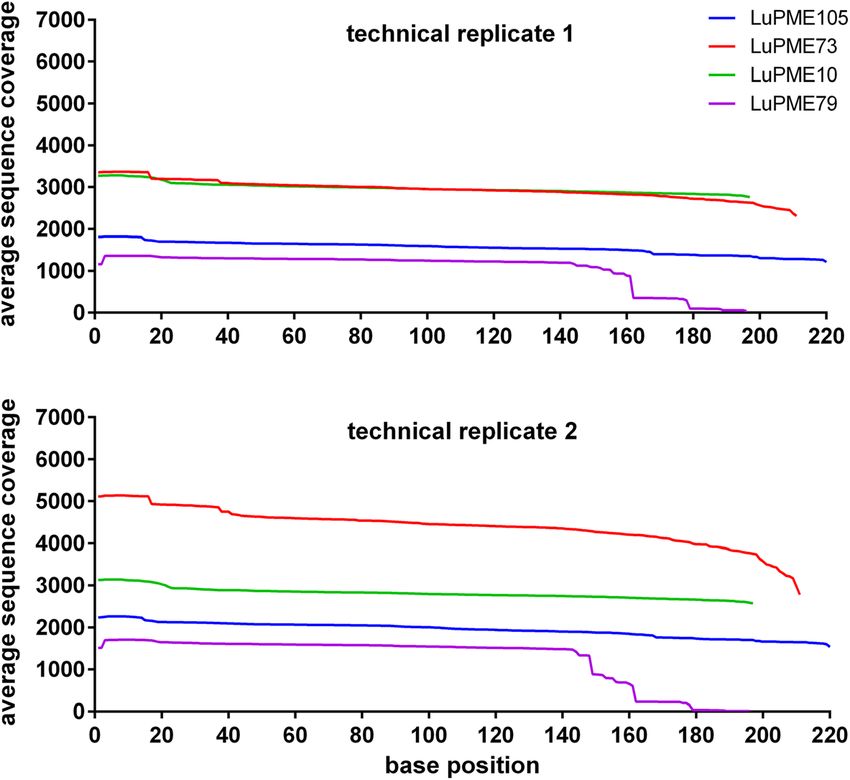
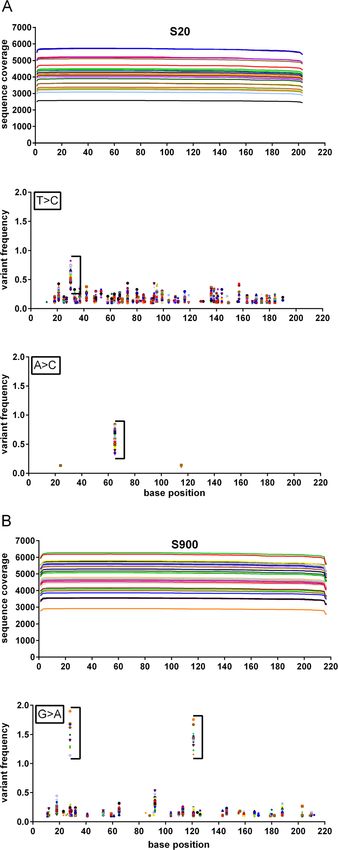
Galindo-González et al. Plant Methods (2015) 11:19                                                               Page 2 of 14

was estimated at about 1 mutation/300 kb screened [4],          cost per-reaction may be reduced by incorporation of spe-
the density of mutations can vary for different plants          cific tags or barcodes in the primer sequences, allowing
and treatments [12]. Therefore the frequency of Single          pooling of many samples in a single sequencing run by
Nucleotide Variants (SNVs) for sequence length be-              targeting specific regions of interest. An early approach
comes an important factor in the probability of finding         using NGS to detect EMS mutations on tomato with GS
a phenotypic effect.                                            FLX sequencing allowed screening of over 15000 plants
  Two main approaches have been developed to relate             [20]; GS FLX has also been used in the evaluation of Tef
genotype to phenotype in mutated populations. Forward           (Eragrostis tef) to examine genes related to lodging resist-
genetics aims to evaluate the phenotype of hundreds or          ance [11]. Additional studies have used Illumina technol-
thousands of individuals to find abnormalities in charac-       ogy to perform TILLING by sequencing in rice and wheat
teristics like growth or development. Once a phenotypic-        [21], and in tobacco [22].
ally abnormal individual is identified, map-based cloning         Here we present the first study using an Ion Torrent
or other molecular analyses must be used to identify the        Personal Genome Machine (PGM) to discover single nu-
DNA sequence that was altered by mutation [13]. In re-          cleotide variants (SNVs) or rare variants (these two
verse genetics, researchers start with a known DNA se-          terms – along with “mutation” - are used interchange-
quence of interest, and try to determine the effects of a       ably throughout the text) in an EMS mutant population
mutation on the phenotype of the organism [3]. One ad-          of an elite linseed variety of flax. The Ion Torrent has
vantage of reverse genetics is that it overcomes some of        one of the lowest instrument and per-run costs of the
the limitations of forward genetics that are caused by          major NGS platforms [23,24], and its sequencing output
functional redundancy [13]. In reverse genetics, muta-          is on a scale consistent with the expected requirements
tions in a gene of interest can be obtained even in ab-         of this application. Ion Torrent works with chips bearing
sence of a clear phenotypic effect, and therefore mutants       millions of microwells with transistor sensors that allow
of related genes can be combined to determine the im-           detection of changes in current produced by the release
pact of simultaneous loss-of-function or alteration of          of hydrogen once new nucleotides are incorporated to
two or more genes.                                              the clonally amplified DNA strands attached to each one
  Both forward and reverse genetics require researchers         of the beads residing in each well [25]. Massive parallelism
to screen a large number of individuals for the mutation        can be achieved with this technology and the sequencing
of interest. Several methods have been developed to             capacity limit depends on the number of sensors in the
screen for mutations in a gene of interest within hun-          array. During the development of the technology the in-
dreds or thousands of individuals in parallel. TILLING          creases in sequencing throughput have been achieved by
(Targeting Induced Local Lesions in Genomes) was de-            growth of the chip size, closer packing of features (e.g.
vised as one such methodology. In TILLING, the gene of          wells) and shrinking of features. In this way for example a
interest is amplified by PCR of pools of DNA from               5.2 fold increase in sensor count has been achieved when
members of an EMS-mutagenized population. Polymor-              moving from a 314 chip to a 316 chip [25].
phisms in the PCR amplicons are detected using denatur-           We demonstrate the utility of this approach by identi-
ing high-performance liquid chromatography (DHPLC),             fying SNVs in eight genes of interest, after performing a
or using a CEL I nuclease preparation, which cleaves the        pilot experiment in three genomic regions with known
heteroduplexes that form between mutant and non-                SNVs to validate the methodology. Our methodology al-
mutant DNA within the amplicons from the pooled DNA;            lows identification of putative variants on the target
the activity of the nuclease is then detected by gel electro-   genes and can be scaled up in the number of genes and
phoresis [14,15]. TILLING has been used in diverse spe-         individuals to screen large populations.
cies including Arabidopsis [4], rice [8], soybean [6],
sorghum [9] and tomato [10]. Other alternatives to CEL I-       Results
based TILLING have also been described including high           We conducted three experiments to develop an Ion
resolution DNA melting and conformation sensitive capil-        Torrent-based method for discovery of single nucleotide
lary electrophoresis [5,12,16]. However, with the advent of     variants (SNVs) in flax: (i) a pilot experiment with combi-
Next Generation Sequencing (NGS) technologies [17-19],          nations of known SNVs (using an Ion 314 chip); (ii) a
the possibilities to improve the efficiency of reverse-         proof of concept experiment with a mutagenized popula-
genetic screening have increased. NGS provides direct in-       tion of flax (also using an Ion 314 chip); and (iii) a scale-
formation about the mutated sequence and does not re-           up experiment using the higher capacity, Ion 316 chip.
quire formation of heteroduplexes. While the cost of
sequence is still too high to allow for whole-genome se-        Experiment I: Pilot
quencing of every individual in a mutant population of a        To evaluate our ability to detect known variants in se-
species such as flax with a genome size of 373 Mb [2], the      lected regions of DNA, we used DNA from two non-
Galindo-González et al. Plant Methods (2015) 11:19                                                                                          Page 3 of 14

mutagenized cultivars of linseed flax: CDC Bethune and                        comprised of incomplete sequence extensions, and se-
Macbeth [26]. We designed primers (Additional file 1)                         quence artifacts that were filtered out during the subse-
encompassing SNVs that had been previously identified                         quent mapping step, leaving 47.35% of all reads to be
in a comparison of CDC Bethune and Macbeth DNA se-                            mapped to the 28 pools (Tables 1 and 2), in each one of
quences [27] and designated these regions as S20, S411                        the three genomic regions evaluated (Additional file 4).
and S900 using their scaffold of origin (e.g. S20 = scaffold                  Average read coverage was 4,103, 2,392 and 4,794 for
20 of the published genome assembly [2]). We mixed                            sequences S20, S411 and S900 respectively (Table 2).
DNA from CDC Bethune with DNA from Macbeth to                                 While coverage did not seem to vary along the se-
simulate a total of 28 pools from either 64 or 96 individ-                    quence, the coverage between pools did vary (Figure 2).
uals, in which one individual in the pool was poly-                             Analysis of mapped reads from the simulated pools
morphic (i.e. carried a SNV not present in any other                          identified expected SNVs in two of the three targeted
member of the pool). As a negative control, we also con-                      loci. For S20, a SNV was identified in base 65 (A > C)
structed simulated pools that consisted of only DNA                           (Figure 2A). For S900 (Figure 2B), a SNV was identified
from CDC Bethune.                                                             in base 28 (G > A), but the expected SNV at position 120
  We amplified the three target regions using a two-step                      (C > T) of S411 that was previously reported was not
PCR (Figure 1 and Additional file 2A-B). The two-step                         found in any of the pools. However, novel SNVs (i.e. poly-
PCR was used because it allowed us to incorporate spe-                        morphisms between Macbeth and CDC Bethune that had
cific barcodes for each pool (Additional file 3). After the                   not been previously reported) were found in two of the
second PCR step, we gel-purified the amplification prod-                      targeted loci: we discovered an additional SNV at position
ucts to eliminate primer dimers, which could otherwise                        30 (T > C) in S20, and an additional SNV at position
be preferentially amplified during subsequent emulsion                        121 (G > A) in S900 (Figure 2). All of these observations
PCR. Gel-purified DNA was diluted to 1 ng μL−1, and                           were confirmed by Sanger sequencing of targeted loci
pooled before diluting all mixed products to 26 pM. This                      (Additional file 5).
pooled sample was diluted one time to obtain a second
pool of half the concentration (13 pM), which was used                        Discovery of EMS-induced mutations in PME genes
to perform a second emulsion PCR. We measured the                             Having demonstrated in the pilot experiment that we
percent of templated Ion Sphere particles (ISPs), as                          could detect known SNVs within simulated pools of
37.3% for the 26 pM sample and 27.6% for the 13 pM                            DNA, we next attempted to discover novel SNVs within
sample. The latter sample was selected for sequencing                         pools of DNA obtained from an actual mutagenized
since the template ISPs fell in the acceptable range of 10                    population (proof of concept). We used 10 ng of DNA
to 30% [28]. The loading of the 26 pM sample was                              from each of 768 individuals and pooled the DNA as ex-
deemed too high for sequencing.                                               plained in materials and methods. Because of the way
  A total of 119.38 Mbp of sequence were obtained which                       our experiment was designed, each one of the 768 indi-
represented 678,532 reads after filtering for polyclonal,                     vidual DNA samples was present in three pools; when a
dimer and low quality sequences (Table 1). While the                          SNV was found in three intersecting pools we could pin-
modal read length for tested genes was > 200 bp, the                          point the sample of origin. We targeted four genes of
mean read size was 176 bp due to a large number of                            the pectin methylesterase (PME) family for discovery of
reads in the 50 bp range. These short reads were                              SNVs (LuPME10, LuPME73, LuPME79, LuPME105,

 Figure 1 Two-step PCR strategy adopted for high throughput sequencing. On the first-step PCR the specific gene section (target) is amplified
 with a forward primer (blue) bearing a universal tag (red), and a reverse primer (blue) carrying a trP1 adapter (green). For the second-step PCR the
 amplicons of the first step are amplified with a reverse primer that matches the trP1 adapter (green) and a forward bar-coded (pink) primer (brown)
 for each desired pool of individuals and genes.
Galindo-González et al. Plant Methods (2015) 11:19                                                                                          Page 4 of 14

Table 1 Sequencing statistics of the three experiments performed
Experiment/replicate            Chip       Percentage of wells         Total number           Total number     Percentage of mapped reads    Mean read
                                type       with beads in chip          of bases (Mbp)1        of reads1        to all genes in experiment    length (bp)
Pilot                           314        74%                         119.38                 678,532          47.35                         176
Proof of concept-1              314        79%                         71.80                  459,888          60.31                         156
Proof of concept-2              314        76%                         85.40                  543,659          63.02                         157
Scale up                        316        74%                         649.00                 3,403,220        92.04                         190
1
    After filtering polyclonal wells, test fragments, adapter dimers sequences and low quality reads.

Table 2). These genes were selected because they are                                    total of 71.8 Mbp and 85.4 Mbp were obtained with an
relevant to ongoing cell wall research in our laboratory                                average read length of 156 bp and 157 bp for the two
[29]. To minimize the amplification of primer dimers,                                   technical replicates (Table 1). The total number of usable
we tested the PME primers (Additional file 1), under a                                  reads after performing filtering of polyclonal, low quality
range of annealing temperatures and found that the opti-                                reads and primer dimers were 459,888 and 543,659.
mal temperature range for the touch-up first-step PCR                                   However, we found that that even after read filtering,
was 56-66°C (this was higher than the annealing                                         there remained a fraction of short reads in the 50 bp
temperature range 50-60°C in the pilot experiment), and                                 range, which presumably represented primer dimers and
the optimal second-step PCR annealing temperature was                                   incomplete products (Additional file 6).
68°C. This highlighted the importance of empirically test-                                When comparing to the pilot experiment the percent-
ing PCR conditions for any new set of primers. Amplicons                                age of mappable reads increased to over 60% for both
were analyzed and purified on agarose electrophoretic                                   replicates (Table 1), but the average read coverage per
gels, eluted, and quantified (as in the pilot experiment) be-                           pool in each of the evaluated genes was proportionally
fore Ion Torrent sequencing.                                                            lower than in the pilot since reads in this case were dis-
  For sequencing, we diluted the pooled PME amplicon                                    tributed among four genes (Table 2). Furthermore, the
DNA to 13 pM. This DNA was sequenced in two repli-                                      proportion of reads mapped was not equally distributed
cate runs (to test for consistency). The percent of tem-                                among the four genes in any of the pools. When using
plate ISPs for the two replicates was 23.87% and 20.13%,                                the mapped reads in all pools to calculate the coefficient
which made both samples suitable for sequencing. A                                      of variation (CV) for each gene and replicate, variability

Table 2 Read statistics of the three experiments performed
Experiment/replicate             Scaffold ID/gene ID         Gene name/          Number of reads             Percentage of mapped     Average read
                                                             annotation1         mapped in all 28 pools      reads in all 28 pools2   coverage per pool
Pilot                            S20                         N/A                 115,998                     17.09                    4,103.69
                                 S411                        N/A                 67,971                      10.02                    2,392.08
                                 S900                        N/A                 137,314                     20.23                    4,794.04
Proof of concept-1               Lus10004720                 LuPME10             91,755                      19.95                    2,975.50
                                 G25305*                     LuPME73             94,242                      20.49                    2,942.75
                                 Lus10031470                 LuPME79             38,154                      8.30                     1,059.81
                                 Lus10043035                 LuPME105            53,216                      11.57                    1,621.20
Proof of concept-2               Lus10004720                 LuPME10             87,889                      16.17                    2,815.02
                                 G25305*                     LuPME73             143,832                     26.46                    4,404.28
                                 Lus10031470                 LuPME79             47,620                      8.76                     1,255.62
                                 Lus10043035                 LuPME105            63,282                      11.64                    1,941.29
Scale up                         Lus10016751                 ALS-1               1,443,997                   42.43                    44,199.34
                                 Lus10029955                 ALS-2               424,425                     12.47                    13,027.62
                                 G24175*                     CLE                 534,255                     15.70                    16,146.73
                                 Lus10017825                 UGT                 729,799                     21.44                    20,472.63
*
 Gene Id correspond to first draft assembly of flax (unpublished).
1
 PME = Pectinmethylesterase, ALS = acetolactate synthase, CLE = cyclic peptide, UGT = glucoronosyl/glucosyl transferase.
2
 Percentage from total number of reads in Table 1.
Galindo-González et al. Plant Methods (2015) 11:19 Page 5 of 14 Figure 2 (See legend on next page.)
Galindo-González et al. Plant Methods (2015) 11:19                                                                                      Page 6 of 14

 (See figure on previous page.)
 Figure 2 Sequence coverage and frequency of variants in gene sections of the pilot experiment. DNA from the cultivar Macbeth was
 diluted (1:64 or 1:96) in CDC Bethune DNA in several simulated pools as described in methods. Each line in the sequence coverage graphs
 represents one of 28 pools. The frequencies of the variants are plotted against the position in the respective reference sequence section. Each
 symbol in the frequency graphs represents a frequency of at least 0.1% for each of the 28 pools in each position. A. S20, B. S900; no graphs for
 S411 are shown since no variants were detected in that sequence.

was evident among genes (Additional file 7), but the                        both replicates. There was no correlation of false posi-
variation was constant among the two replicates for                         tives with the technically consistent SNVs or the ones
each gene.                                                                  found by complementarity.
  The coverage per position for each gene was high                            In our analysis of four targeted PMEs amplified from
throughout the sequence, with the exception of LuPME79,                     768 individuals, we found a total of 13 putative SNVs.
where a drastic decrease in coverage was observed after                     Sanger sequencing on the original DNA from the pooled
position 162 of the reads (Figure 3). Analysis of the se-                   individuals confirmed only five of the 13 putative SNVs
quence with Mfold [30] (not shown), did not predict a                       (Table 3). When the sequenced sections from the ori-
secondary structure that would explain this apparent hard                   ginal and mutated individuals were translated, it was
stop in sequencing. Additionally, GC content of LuPME79                     found that neither of the two non-synonymous changes
(57.14%) was similar to LuPME73 (57.34%), so a bias in                      found was within the predicted enzyme active sites [31]
GC content could not explain this difference either.                        (Figure 4). Nevertheless, the methodology proved useful
  Based on our experience in the pilot experiment, we                       for finding mutations in pooled mutated populations
selected a minimum coverage per position of 500×,                           when testing several genes at the same time.
with a frequency of at least 0.5% in three intersecting
pools, for defining putative mutations. When only two                       Increased read depth for discovery of EMS-induced
intersecting pools were found with the expected mini-                       mutations
mum frequency, all individuals from the intersection                        Because the previous experiment showed a large vari-
where sequenced. There was consistency between repli-                       ation in mapped reads between genes and read depth
cate runs for most SNVs but some of the SNVs were                           among pools in each gene (Table 2 and Additional file 7)
detected by complementary intersecting pools between                        and less than half of the predicted SNVs could be

 Figure 3 Coverage of four PME genes in two technical replicates. The average sequence coverage from 28 pools in each one of the base
 positions for the four PME genes is shown.
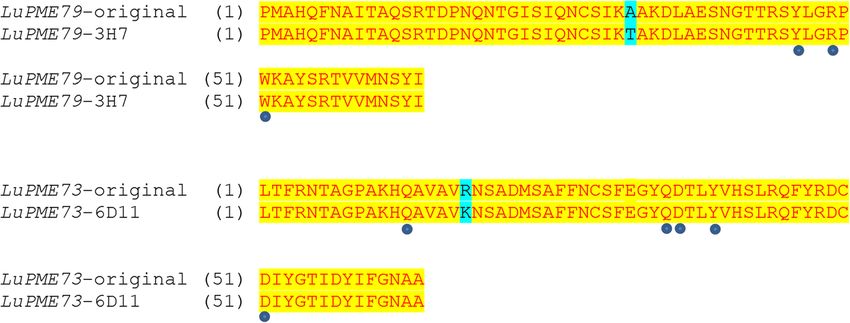
Galindo-González et al. Plant Methods (2015) 11:19                                                                                   Page 7 of 14

Table 3 SNVs found in four PME genes
Gene                Base No.            Change             Sanger confirmation        Nucleotide substitution            Amino acid substitution
LuPME79             33                  G>A                No                         N/A                                N/A
LuPME79             96                  G>A                Yes                        Heterozygous                       Non-synonymous
LuPME73             25                  G>A                No                         N/A                                N/A
LuPME73             54                  G>A                Yes                        Heterozygous                       Non-synonymous
LuPME73             81                  T > A*             No                         N/A                                N/A
LuPME73             88                  C>T                Yes                        Heterozygous                       Synonymous
LuPME73             97                  A > G*             No                         N/A                                N/A
LuPME73             139                 C>T                Yes                        Homozygous                         Synonymous
LuPME73             189                 C>T                No                         N/A                                N/A
LuPME10             154                 C>T                Yes                        Homozygous                         Synonymous
LuPME105            34                  A > G*             N/A                        N/A                                N/A
LuPME105            57                  A > G*             No                         N/A                                N/A
LuPME105            115                 G>A                No                         N/A                                N/A
N/A – sequence could not be obtained by Sanger.
*Mutations not expected by EMS, but discovered using the technique.

confirmed by Sanger sequencing, we decided to increase                      of 190 bp (Table 1). The total number of usable reads
read depth by switching from Ion 314 chips to the higher                    after filtering was 3,403,220 which was an approximately
capacity Ion 316 chips (scale up). We used four genes re-                   5-fold increase from the 314 chips used in the first two
lated to flax metabolism (Additional file 1 and Table 2).                   experiments. Although the coverage of pools among
These genes are related to characteristics related to bitter                genes fell slightly towards the end of the sequences (re-
taste in flax (cyclic peptides), targeting of group 2 herbi-                sult not shown), the average coverage for the four evalu-
cides (acetolactate syntases), or important as major com-                   ated genes was 10 times higher than in the previous
ponents of cell wall formation (glucoronosyl/glucosyl                       experiment (Table 2), and therefore the depth was suffi-
transferases). We selected regions in these genes based on                  cient to assess variants in any position throughout pools
previous studies showing critical sections and/or amino                     and genes.
acids for the function of these proteins [32-35].                             Using similar parameters as for the PMEs, we found a
  We tested again two dilutions at 13 and 26 pM to as-                      total of 16 putative SNVs from which 11 were confirmed
sess which of these would give a better percentage of                       by Sanger sequencing (Table 4). From these, two were
template ISPs. We obtained 12.15 and 17.35% of tem-                         found to be homozygous. One of the heterozygous mu-
plated ISPs respectively and sequenced only the latter                      tations resulted in the generation of a stop codon.
sample, which had the highest percent loading. A total                        We tested the heritability of the SNVs discovered in
of 649 Mbp were obtained with an average read length                        ALS1, ALS2, UGT and CLE by Sanger sequencing of the

 Figure 4 Alignment of amino acid sections from individuals bearing non-synonymous mutations (Table 3) to the original non-mutated
 sequences. Gene IDs are followed by an identifier given to the sequenced individuals. Circles below the alignment indicate enzyme active sites.
 Blue background indicates the amino acid change.
Galindo-González et al. Plant Methods (2015) 11:19                                                                                                   Page 8 of 14

Table 4 SNVs found in four genes of interest
Gene     Base No.      Change       Sanger            Nucleotide         Amino acid        Sanger            Nucleotide substitution               Script
                                    confirmation      substitution       substitution      confirmation      in progeny1                           confirmation2
                                                                                           on M4
ALS-1    119           C>T          Yes               Heterozygous       A/V               Yes               2 homozygous                          Yes++
ALS-1    140           C>T          No                N/A                P/L               N/A               N/A                                   No
CLE      89            G>A          Yes               Heterozygous       G/D               Yes               3 heterozygous                        Yes+++
CLE      94            G>A          Yes               Heterozygous       E/K               Yes               1 homozygous, 1 heterozygous          No
CLE      134           G>A          Yes               Heterozygous       R/H               Yes               1 homozygous                          Yes+++
ALS-2    26            G>A          No                N/A                G/E               N/A               N/A                                   No
ALS-2    43            G>A          Yes               Heterozygous       E/K               Yes               2 homozygous                          No
ALS-2    100           G>A          No                N/A                E/K               N/A               N/A                                   No
ALS-2    161           C>T          Yes               Heterozygous       A/V               Yes               2 homozygous                          Yes+++
ALS-2    161           C>T          Yes               Homozygous         A/V               Yes               2 homozygous                          Yes+
UGT      27            C>T          No                N/A                P/S               N/A               N/A                                   No
UGT      33            C>T          No                N/A                H/Y               N/A               N/A                                   No
UGT      81            C>T          Yes               Homozygous         L/F               Yes               3 homozygous                          Yes+++
UGT      99            G > A*       Yes               Heterozygous       E/STOP            Yes               3 heterozygous                        N/A
UGT      99            G > A*       Yes               Heterozygous       E/STOP            Yes               2 heterozygous                        N/A
UGT      184           G>A          Yes               Heterozygous       G/E               Yes               1 homozygous, 1heterozygous           No
*
 Mutation was found by looking at intersecting pools with frequencies below the set threshold.
1
 Six individuals from progeny examined per mutation.
2
 The frequencies of the variants were used to run a Phyton script which automatically detects the source individual bearing the mutation (Additional file 8).
Parameters used in the script were: 2 lower SD cutoff, 10 upper SD cutoff, 1 min. pools. N/A rows were not picked by the script since they were found by a
different methodology. The confirmed points by the script had confidence intervals of: +75%, ++85% and +++99%.
Mutations on position 161 on ALS-2 and 99 on UGT were found in two different individuals.

progeny of plants in which the mutations were initially                             similar approach used Ion Torrent to map mutations in
identified. The presence of the mutation was confirmed                              mice, but examined a large number of regions in a few
in the progeny of all of the lines (Table 4).                                       samples [40].
                                                                                       In the pilot experiment, we detected the expected mu-
Discussion                                                                          tations and additional unreported changes in the tested
Ion Torrent technology in SNV detection                                             genomic regions (Figure 2 and Additional file 5). Our
The advent of next-generation sequencing technologies                               experiment with PMEs had a larger variability in read
has opened new doors for genomic-scale analyses                                     depth among pools and genes (Additional file 7), which
[18,19]. Among common sequencing platforms IonTor-                                  may have had an influence on the number of false posi-
rent offers potential advantages including low instru-                              tives. When we increased our read depth by using the
ment cost, low cost per base, and fast output (up to 333                            larger Ion 316 chip, the number of false positives de-
Mbp/h) [23,36]. Ion Torrent has also been reported to                               creased significantly.
be superior for variant calling than Illumina [23], al-                                Several variables were optimized during our experi-
though other studies report similar or slightly higher                              ment. Since sample pooling was used, high-quality DNA
sensitivity for MiSeq [37]. While Ion Torrent has a high                            in equal amounts was needed to increase the probability
rate of indels caused by homopolymeric runs, and long-                              of detecting one mutated individual among the popula-
range sequence quality can be lower than that of other                              tion. We standardized a high-throughput CTAB protocol
instruments [23,36,38,39], this is not a problem for call-                          yielding high quality DNA and further quantified the
ing SNVs with high read depth.                                                      samples by fluorescence to add equal amounts of DNA
  We used Ion 314 and Ion 316 chips and were able to                                from each individual in each pool. Additionally, the first
reach reads in the 200 bp range with a total sequence                               step PCR required addition of different PCR additives
throughput that guaranteed high depth. The size reached                             (ethylene glycol and DMSO), which decreased the for-
by these reads facilitated the evaluation of critical gene                          mation of secondary structures since preliminary tests
regions without the need for post-sequencing assembly.                              showed that a standard PCR resulted in a high propor-
Likewise, we were able to achieve a high-throughput in                              tion of primer dimers (or secondary structures) due to
the number of samples analyzed for several genes. A                                 the length of the primers; nevertheless some residual
Galindo-González et al. Plant Methods (2015) 11:19 Page 9 of 14 dimers were still unavoidable (Additional file 2). A PCR the formation of a secondary structure that impairs the se- cleanup did not suffice to get rid of all dimers, which quencing polymerase from continuing. were still carried over to the emulsion PCR, resulting in Length and GC content of the target locus are not en- a preferential amplification of these smaller products in tirely under control of the researcher. However, other preliminary runs (result not shown). Eluting the specific factors can be better controlled to achieve near- products from agarose gels improved the detection of homogeneous coverage when pooling samples for ana- the larger specific products but still with some residual lysis. For example, an accurate quantification of the PCR carryover. A better primer removal method like a solid- products after the first round of PCR by comparison to phase reversible immobilization (SPRI) technology was a standard [44], would decrease biases in amounts of suggested for the process of PCR cleanup for Illumina amplicons before pooling. Although previous studies [41], and could also be used in future experiments. have shown that non-normalized samples are suitable to Differences in read coverage were detected in our differ- detect high-frequency variants [44], our study comprised ent experiments, but this is not uncommon in NGS tech- the detection of mutations in pooled samples, where a nologies [21]. As a general trend we found that shorter homozygous mutation could theoretically have a low fre- amplicons resulted in higher average coverage over all po- quency: aprox. 1% for a 1 in 96 dilution, and of 0.5% for sitions in all pools for the evaluated gene sections of the an heterozygous allele. Additionally, very small amounts three experiments. This can be related especially to emul- of DNA (10 ng) were used in the pools. Since differences sion PCR, since this constitutes a step where all genes are in the amount of starting DNA can also result in differ- mixed and there can be a preferential amplification of ential amplification [42], it is important to guarantee shorter amplicons. Factors like shorter denaturation times close to equimolar amounts of starting DNA to avoid and faster extension on smaller products may lead to this losing a variant due to a PCR deficiency. preferential amplification [42]. Overall, the coverage on the 11 different gene regions However, the exact same relationship was not found for that were tested allowed for the detection of SNVs in re- the PMEs (Figure 3). The two PME amplicons corre- gions of up to 200 bp. Although coverage varied slightly sponding to LuPME79 and LuPME105 had a lower aver- between some pools and genes, coverage along the age coverage, and while the later does correspond to the length of amplicons was generally even but dropped only larger amplicon of this gene set, the former is the smallest. towards the ends of the sequences (Figure 3), which is Therefore different factors may have had an influence on common of sequencing-by-synthesis technologies [25]. the variability in read count that we encountered. When With further optimization, the Ion 314 chips could easily we calculated GC content it was seen that LuPME105 had accommodate the evaluation of 16 amplicons at an aver- the lowest GC content (43%) of the four PME sections age of more than 500× coverage per pool under the 28- evaluated. Ion Torrent read coverage has been shown to pool scheme we utilized. Theoretically, for the Ion 316 decrease upon high or low GC content or under different chip, 160 amplicons could be evaluated under the same levels of genome complexity [23,25,43]. Likewise, gel ex- conditions, but adjusting the technical parameters under traction has been shown also to have a bias for recovery of the current technology to guarantee little variability GC-rich double stranded templates that have higher affin- from pooling to sequencing becomes harder unless a ity for kit columns, than AT-rich amplicons which become similar system to the Ampliseq, used for human genes single stranded upon agarose melting conditions [41]. [25], can be rapidly implemented for plants. Neither length, nor GC, seemed correlated with the Another factor that came into consideration was how lower coverage of LuPME79, however, the primers from to decrease the level of false positives in data. Whereas LuPME79 and LuPME105 (Additional file 1) had a lower it is has been reported that the level of false positives in value of Gibbs energy – ΔG - (−11.32 and −10.24 kcal Ion Torrent data is larger than Illumina, it has also been mol−1 respectively) compared with the primers of shown that Ion Torrent can detect more true positives LuPME10 and LuPME73 (−5.19 and −8.48 kcal mol−1). given enough coverage [23]. From our data it was evi- Since a lower ΔG favors the formation of secondary struc- dent that the increase in depth upon using the Ion 316 tures, this could have had an effect of the PCR resulting in chip was concomitant with a decrease in false positives a differential amount of amplicons before pooling. Unfore- (compare Tables 3 and 4), showing that read depth is seen changes like EMS mutations in priming sites can also key for separating real mutations from noise in SNV contribute to differential amplification among samples. studies [21], and in studies where allele frequency needs We also encountered a drop in coverage after position to be resolved [45]. While our proof of concept and scale 162 in LuPME79; while we could not detect any evident experiments differed in the amplicons used, read map- secondary structure after the hard stop in the sequence ping statistics (Tables 1 and 2) demonstrated that the ex- reads, 16 out of the 20 previous nucleotides before the periment with the 316 chip had an increase in the number read coverage fall are G or C and this could be related to of reads by over 5 fold when compared to the 314 chip.
Galindo-González et al. Plant Methods (2015) 11:19                                                               Page 10 of 14

Since other factors like GC content and small differences        equipment and cost per base which are above the ones
in amplicon size are still difficult to control for and do not   of Ion Torrent [36,46]. Furthermore, higher throughput
have a clear correlation always with read depth, we              was achieved (5-fold) when changing to a 316 chip with-
believe that the technical increase on read number by            out a change in runtime while for 454 technology the
selecting a higher capacity chip is the key factor in            use of higher-end sequencers may require up to 23 hours
obtaining more rare variants. Unfortunately, most sec-           for a run [46]. Finally, the rate of false positives seems to
ond generation NGS technologies still present high error         be on a similar range for these two technologies.
rates (see below). While we tried to control for equimo-           Our methodology was based on a previous Illumina
lar amounts of DNA when pooling samples, PCR steps               study [21] and therefore some conclusions can be drawn
result in uncontrollable dilutions of some samples before        by comparing the two. It was clear that because of the
sequencing which will result in the loss of some SNVs            similar methodology similar results were obtained in
among noise. Improvements to eliminate such technical            several fields. For example low coverage resulted in in-
variability will increase our ability for SNV detection.         creased noise which impaired SNV detection in both
   There are additional elements to have into account. For       studies. The throughput of Illumina is generally higher
example, it was noticed that the background frequency of         resulting in detection of many more mutations. How-
base substitution varied between the type of substitutions       ever, this is achieved in longer runtimes (days) and with
and among genes. While an A > C change had little or no          more expensive equipment, although cost per base is
background over 0.1% for the S20 region (see Figure 2), a        lower on Illumina [36,37,46]. Because of the higher error
T > C change in the same region and a G > A in the S900          rates of the Ion Torrent technology the amount of false
region had larger substitution noise. A differential rate of     positives is usually higher than on Illumina [23].
substitution has been linked to the PGM from Ion Torrent
upon studying bacteria, with G > A and T > C transitions         Conclusion
presenting the higher rates of substitution with the Ion         We have demonstrated that the Ion Torrent can be used
OneTouch 200 template kit [39].                                  in a scalable, amplicon-based approach for efficient dis-
   Interestingly while homopolymer errors are the most           covery of mutations in a small number of genes. The ef-
common error type from this technology [23,36,39], an            ficiency of the method is limited by the rate of false
study with bacteria found that substitutions have the high-      positives, which may be decreased by higher read-depth
est variation frequencies, with standard deviations ranging      and further technical optimization. Ion Torrent technol-
from 26%-56% of the mean substitution rate [39]. This has        ogy has been demonstrated to introduce biases at errors
implications in the detection of rare variants (including        at specific steps during sequencing [43], as have other
false negatives) which may come up at lower frequencies          sequencing technologies, especially when PCR step is
as we detected in our study due to sample dilution in            used in sample preparation [47]. Nevertheless, the Ion
pools. For example, a 0.3% frequency was found for S20           Torrent PGM platform detected rare variants with as
variants in the pilot experiment (Figure 2), and since some      low as 0.3% frequency per pool according to our results,
random error can reach this frequency, this can lower our        which is above the substitution error of 0.1% calculated
detection ability. While there were a few false positives        for the technology [25], and we showed that 768 individ-
embedded into homopolymeric tracts which constitute              uals could be easily pooled per run. The Ion Torrent is
the bigger source of error of Ion Torrent technology [39],       one of the first technologies that does need optical sys-
no specific position or sequence-specific bias in the SNVs       tems to detect nucleotide incorporation, and does not
that were not confirmed by sanger could be inferred to           use modified nucleotides [25,48]; in addition it has a
make any generalization.                                         good combination of throughput, cost and time saving
   Compared to Roche/454 technologies where mutagen-             compared to other systems [23,36,44,49]. The use of
ized populations are used to discover rare variants              chips with larger capacity [25], will allow increasing both
[11,20] the Ion Torrent technology offers a higher read          the number of genes and/or pooled samples. Addition-
depth in short times, which results in a higher probabil-        ally, the availability of 400 bp kits now allows exploring
ity to find the mutated bases. While one of the main ad-         larger regions of interest without the need of using
vantages of 454 sequencing over other technologies was           paired ends.
their read length (>400 bp), Ion Torrent is quickly catch-
ing up to offer similar read lengths of high quality [25].       Methods
Our study achieved similar throughput (314 chips) in             Plant material
the number of reads obtained as the aforementioned 454           Seeds of Linum usitatissimum L. (var. CDC Bethune), an
studies, but the time required for a run on an Ion Tor-          elite linseed cultivar, were obtained from Gordon Rowland
rent PGM is just over 2 hours while the most basic 454           (Crop Development Center, Saskatoon, SK). Seeds were
sequencers use at least 10 hours and with prices of              soaked in 5 volumes (liquid volume/seed volume) of 0.5%
Galindo-González et al. Plant Methods (2015) 11:19                                                           Page 11 of 14

ethyl methyl sulfonate (EMS) in 25 mM phosphate buffer       reader (BMG labtech, Ortemberg, Germany), using a
(pH 7.6) for 4 h at room temperature and then were           standard curve of flax DNA. Samples were diluted to
rinsed with distilled water (three times), and air dried     10 ng μL−1 and 1 μL or each pooled in groups of 64 or
prior to storage. These M1 seeds were sown at the Univer-    96. According to the formula used by Tsai et al. [21]
sity of Alberta farm (Edmonton, AB), and their M2 pro-       using 10 ng of DNA with a flax genome of 2C = 0.764 pg
geny were harvested as individual families. Approximately    [2] would yield 204.5 copies per allele (for each individ-
four seeds from each M2 line were sown in rows at            ual) for the 1 in 64 dilution or 136.3 copies per allele for
Kernen Farm (Saskatoon, SK) in summer 2010. Leaves           the 1 in 96 dilution. This is higher than the minimum
were harvested and lyophilized for subsequent DNA ex-        number of recommended copies (40) to avoid absence
traction, and their progeny (i.e. M3 families) were har-     or fluctuation of copies among individuals [21].
vested from individual plants, then threshed and stored at     The pools were created using the following method-
ambient temperature in envelopes until screening.            ology: each sample was in an individual well of eight 96-
                                                             well plates; all individuals from each plate were pooled
DNA extraction and pooling                                   creating the first eight pools containing 96 individuals
DNA extraction was performed for 96 samples at a time        each (designated pools A1 to A8). Then all the individ-
using CTAB [50] with some modifications. Lyophilized         uals from the same column in each plate were pooled
leaf samples (10–20 mg) were placed in 8-strip 1.2 mL        creating 12 pools of 64 individuals each (designated
collection tubes (QIAGEN, Hilden, Germany) containing        pools B1 to B12). And finally all individuals from the
a sterile 3 mm tungsten carbide beads. Tubes were            same row in each plate were pooled creating the last
capped and ground for 2 minutes at 25 Hz using a             eight pools of 96 individuals each (designated pools C1
Retsch MM301 mixer mill (Retsch, Haan, Germany).             to C8). In this way each individual was part of three dif-
Samples were centrifuged at 1,450 × g for 1 minute.          ferent pools and therefore a mutation detected in three
CTAB was prepared with 2% CTAB (w/v), 2% PVP-40,             intersecting pools would allow us to pinpoint the source
100 mM Tris-Cl pH 8.0, 25 mM EDTA pH 8.0, 1 M                individual.
NaCl and 0.5 g L−1 of spermidine. The buffer was pre-
warmed (60°C) and supplemented with 10 μg mL−1 of
                                                             Primer design
RNAse A (Sigma-Aldrich, St. Louis, MO, USA),
                                                             The primers were designed using Primer 3 [51] with the
100 μg mL−1 of proteinase K (Fermentas, Waltham, MA,
                                                             following parameters: Two C’s or G’s in the last five nu-
USA) and 5% mercaptoethanol, before adding 500 μL to
                                                             cleotides towards the 3′ end; up to three nucleotides
each sample. The tubes were re-capped with new caps
                                                             long homopolymers; a delta G lower than −9 kcal/mole,
and mixed by inversion (20 times) and incubated at 60°C
                                                             Tm between 59 and 61°C and size between 19 and 21
for 2 hours, mixing the tubes by inversion every 20 mi-
                                                             nucleotides (when conditions were not met parameters
nutes. After incubation, samples were centrifuged for
                                                             were relaxed). For the forward primer the universal pri-
5 minutes at 5,800 × g and the supernatants were trans-
                                                             mer tag 5′-CAGTCGGGCGTCATCA-3′ was added (de-
ferred to new tubes. Five hundred microliters of chloro-
                                                             signed by Travis Glenn, Univ. of SC, http://www.gvsu.
form : isoamyl (24:1) were added to each sample and
                                                             edu/dna/universal-primer-tag-6.htm) and for the primer
re-capped tubes were mixed by inversion (60 times) be-
                                                             Rv the adaptor trP1 was added (5′-CCTCTCTATGGG
fore centrifugation for 5 minutes at 5,800 × g. The
                                                             CAGTCGGTGAT–3′) (Additional file 1).
supernatant was transferred to new tubes. Chloroform :
isoamyl extraction was repeated once again. Three hun-
dred microliters of ice-cold isopropanol were added to       Pilot experiment
the tubes with the supernatant and the samples were          A pilot experiment was performed using known SNVs
mixed by inversion (20 times) before transferring to −20°C   showing polymorphisms between cultivars CDC Bethune
for 2 hours. Incubation was followed by centrifugation at    and Macbeth. Since for the pilot experiment we were
5,800 × g for 15 minutes. Supernatants were decanted to      not trying to discover new mutations we did not have to
waste and 500 μL of ice cold 95% ethanol were added          pool DNA from different individuals as described in the
to the pellets and samples were gently vortexed prior        DNA extraction and pooling section; instead Macbeth
to centrifugation at 5,800 g for 5 minutes. The previ-       DNA was diluted 1:64 or 1:96 in Bethune DNA to simu-
ous step was repeated with 500 μL of ice cold 70%            late the presence of an individual with a mutation within
ethanol. The ethanol was decanted and the samples            the population. Three genomic regions with previously
were air-dried, and resuspended in 125 μL of TE 10:1         reported SNVs [27], from three flax scaffolds were
and stored at −20°C.                                         chosen to test the methodology and were named S20,
  DNA samples were quantified using Picogreen (Invi-         S411 and S900 (names were derived from the names of
trogen, Carlsbad, CA, USA) in a Fluorostar BMG plate         the scaffolds that contained them - see Additional file 1).
Galindo-González et al. Plant Methods (2015) 11:19 Page 12 of 14
PCR amplification and barcoding primer dimers, a band of the expected size was gel puri-
A two-step PCR strategy was adopted: the first step used fied using the Wizard SV gel and PCR clean-up system
a PCR with two sets of cycles at different temperatures (Promega, Madison, WI, U.S.A). Samples were quanti-
(below) to amplify the target gene and the second step fied using a Qubit 2.0 fluorometer using a dsDNA HS
incorporated a barcode oligonucleotide to distinguish assay (Invitrogen, Burlington, ON, Canada). All quanti-
different pools (Figure 1). First step PCR was performed fied samples were diluted to 1 ng μL−1 and equal
on each of 28 sample pools and three genes per pool amount of the PCR products were combined and were
(pilot experiment), with forward primers bearing a uni- re-measured on the Qubit to confirm that concentration
versal tag at their 5′ end (Additional file 1), and reverse was still 1 ng μL−1. The sample was diluted with low
primers carrying an additional adaptor tail which binds Tris EDTA buffer (TE 10:1) to obtain 15.5×10⁶ mole-
the ionospheres used in the sequencing step. cules per microliter (26 pM) which is the recommended
For the pilot experiment, first-step amplifications were concentration for template preparation using Ion Tor-
performed on a template that either included DNA with rent technology.
known SNVs S20, S411 and S900 (Macbeth DNA in 1:64
or 1:96 dilution in CDC Bethune DNA) or homogeneous
Sequencing
template without the SNVs (i.e. only CDC Bethune
All procedures for emulsion PCR and next-generation
DNA). The PCR products were diluted 1:100 and equal
sequencing were performed with Ion Torrent equipment
amounts (5 μL) of PCR product from each of the three
and Ion Torrent kits under the manufacturer specifica-
target regions were mixed in each of 28 pools for bar-
tions (Life Technologies, Carlsbad, CA, U.S.A.): emul-
coding; the changes of Macbeth genic regions SNVs
sion PCR was performed with the Ion OneTouch 200
where introduced in all pools for the gene of S20, and in
template kit in an Ion OneTouch. Enrichment of tem-
10 pools for genes S411 and S900. For the second step, a
plate positive Ionospheres (ISPs) was performed with an
total of 28 PCRs were performed with forward bar-
Ion OneTouch ES (Life Technologies, Carlsbad, CA,
coded primers (Figure 1 and Additional file 2), and a
U.S.A.). Sequencing of enriched templates bound to ion-
trP1 primer complementary to the tail from the reverse
ospheres was done using the Ion PGM 200 sequencing
primer of the first-step PCR. The 28 bar codes allowed
kit in an Ion PGM Sequencer with either 314 or 316
us to discriminate between the respective DNA pools
chips. FASTQ files of each barcoded group of sequences
after sequencing.
were recovered from the Ion Torrent server for further
First step PCR was carried under the following condi-
analysis. Reads have been deposited in the Sequence
tions: 1X PCR buffer, 2 mM Mg, 0.2 mM dNTPs, 0.2 μM
Read Archive (SRA) from NCBI under study accession
of each forward and reverse primers (Additional file 1),
number: SRP052626.
1 M ethylene glycol, 4% dimethyl sulfoxide (DMSO), 10 ng
of DNA and 1.25 units of Platinum Taq DNA polymerase
(Invitrogen, Burlington, ON, Canada). The PCR protocol Detection of induced mutations in a population of EMS
included an initial denaturation step at 94°C for 3 minutes, mutagenized flax
followed by 5 cycles of 94°C for 20 seconds, 50°C for Procedures were similar to the pilot experiment, unless
30 seconds and 72°C for 1 minute. Finally, an additional stated otherwise. The experimental design was adapted
25 cycles were done by changing the annealing from Tsai et al., 2011 [21]. A total of 28 pools of DNA
temperature to 60°C (touch-up), and a final extension step from distinct individuals (768 lyophilized leaf samples)
was performed at 72°C for 10 minutes. were created to facilitate detection of mutations as de-
The second-step PCR was carried out as follows: 1X scribed in DNA extraction and pooling.
PCR buffer, 2 mM Mg, 0.2 mM dNTPs, 0.2 μM forward A total of eight primer pairs that amplified pectin
bar-coded primer and 0.2 μM reverse trP1 primer methylesterases (PMEs) were designed to target conserved
(Additional files 1 and 3), 1 μL of the DNA amplicon regions presumed to be essential for enzymatic function
dilution (three genes combined per pool) and 1.25 units and tertiary structure stability of these genes [29,31].
of Platinum Taq DNA polymerase (Invitrogen, Burlington, Preliminary tests showed that four of the primers pairs
ON, Canada). The PCR protocol included an initial de- (Additional file 1), gave stronger products, and these
naturation step at 94°C followed by 30 cycles of 94°C for were used for second-step PCR as described above. Separ-
30 seconds, 62°C for 30 seconds and 72°C for 1 minute, ately, 12 primer pairs from three different metabolism-
and a final extension of 72°C for 10 minutes. related genes that constitute important breeding traits
(cyclic peptides, acetolactate synthase and UDP - glucuro-
Purification and quantification of PCR products nosyl/glucosyl transferases) were also designed and four
The products of PCR reactions of 28 pools and 3 genes primer pairs were selected after testing them by PCR
per pool were run on 1.5% agarose gels. To eliminate (Additional file 1).Galindo-González et al. Plant Methods (2015) 11:19 Page 13 of 14
Analysis of Single Nucleotide Variants (SNVs) of the three genes (S20, S411, S900). Gel was run in 1.5% agarose in TAE
Reads obtained from Ion Torrent PGM sequencing were 1X at 90 V for 60 minutes. Size of marker bands is given in bp. Negative
uploaded to the CLC Genomics workbench platform control refers to a PCR with no DNA template.
(CLCbio, Aarhus N, Denmark). Reads were mapped to Additional file 3: Primer sequences (with barcodes) and adaptors
used for second step-pcr.
reference sequences previously confirmed by Sanger ca-
Additional file 4: Sanger-sequenced fragments of references genes
pillary sequencing of target amplicons (data not shown), used in the different experiments.
using the following parameters: masking mode = no mask- Additional file 5: Alignment of sequenced fragments of the pilot
ing, mismatch cost = 2, insertion cost = 3, deletion cost = experiment. The number 1 over the alignment indicates position 1 for
3, length fraction = 0.8 and similarity fraction = 0.8, global reference of mutations found.
alignment = no, non-specific match handling = map ran- Additional file 6: Ion Sphere Particles (ISPs) and read identification
summary. The data is given for two technical replicates runs (A and B) of
domly, output mode = create stand-alone read mapping, PMEs using the Ion Torrent PGM.
create report = yes, collect unmapped reads = yes. Once Additional file 7: Average read count and dispersion among the
the reads were mapped to the reference, the mapped reads mapped reads for two replicate sequencing runs of PME genes.
files were used as input to discover rare variants using Statistics are given for the 28 pools for all mapped reads or for each
individual gene.
quality score with the following parameters: neighborhood
Additional file 8: Python script algorithm description. The
radius = 5, maximum gap and mismatch count = 5, mini- methodology, results and discussion using this script are presented.
mum neighborhood quality = 15, minimum central qual-
ity = 20, ignore non-specific matches = yes, ignore broken
Competing interests
pairs = yes, minimum coverage = 100, minimum variant The authors declare that they have no competing interests. We have no
frequency (%) = 0.1 (selected according to a previous study affiliation or support from any of the manufacturers of equipment named in
[25]), maximum expected alleles = 4, advanced = no, re- this manuscript.
quire presence in both forward and reverse strands = no,
Authors’ contributions
filter454/ion homopolymer indels = yes, create track = yes, LGG designed the experiments and wrote the manuscript. LGG, DPL and
create annotated table = yes, genetic code = 1 standard. EAB carried out the experiments and data analyses. EAB and DCJ wrote the
The whole process was automated by creating a CLC Python script. MKD supervised the experiments and edited the manuscript.
All authors read and approved the final manuscript.
workbench workflow. We also generated a Python
script to automate mutation identification in the future
Acknowledgements
(Additional file 8). We thank Sophie Dang from the Molecular Biology facility (MBSU) at the
Frequency tables were created manually using Micro- University of Alberta for her training in the use of the Ion Torrent PGM.
Funding was provided by Genome Canada (TUFGEN: Total Utilization of Flax
soft Excel per each gene and per each pool after filtering
Genomics program) and the Natural Sciences and Engineering Research
homopolymeric tracts and indel artifacts created by the Council (NSERC) of Canada.
sequencing technology. Graphs showing the frequency
Author details
changes by position for the 28 pools in a specific base 1
Department of Biological Sciences, University of Alberta, Edmonton, AB,
change (e.g. G to A) were done to detect outliers visually Canada, T6G 2E9. 2Department of Computing Sciences, Kings University
which were indicative of a rare variant. SNV candidates College, Edmonton, AB, Canada, T6B 2H3. 3IK Barber School of Arts &
Sciences, University of British Columbia, Okanagan campus, Kelowna, BC,
were chosen if the mutation was present in three inter-
Canada, V1V 1 V7.
secting pools or in two intersecting pools with high fre-
quency (>0.3% in pilot experiment and >0.5% in Received: 22 November 2014 Accepted: 2 March 2015
remaining experiments). DNAs from individuals (M3 gen-
eration) with potential mutations were re-sequenced using
References
Sanger sequencing to confirm the analysis performed with 1. Cullis CA. Mechanisms and control of rapid genomic changes in flax. Ann
Ion Torrent. Bot. 2005;95:201–6.
2. Wang Z, Hobson N, Galindo L, Zhu S, Shi D, McDill J, et al. The genome of
flax (Linum usitatissimum) assembled de novo from short shotgun
sequence reads. Plant J. 2012;72:461–73.
Additional files 3. Alonso JM, Ecker JR. Moving forward in reverse: genetic technologies to
enable genome-wide phenomic screens in Arabidopsis. Nat Rev Genet.
Additional file 1: Primer sequences and adaptors used for pilot and 2006;7:524–36.
test studies. 4. Greene EA, Codomo CA, Taylor NE, Henikoff JG, Till BJ, Reynolds SH, et al.
Additional file 2: Two-step PCR from pilot experiment. A. Products Spectrum of chemically induced mutations from a large-scale reverse-
of first step PCR from the pilot experiment. Amplifications were genetic screen in Arabidopsis. Genetics. 2003;740:731–40.
5. Botticella E, Sestili F, Hernandez-lopez A, Phillips A, Lafiandra D. High
performed with 5 or 10 ng of pooled DNA in the different dilutions that
simulated the inclusion of the mutated individual. Gel was run in 1.5% resolution melting analysis for the detection of EMS induced mutations in
agarose in TAE 1X at 90 V for 40 minutes. Size of marker bands is given wheat SbeIIa genes. BMC Plant Biol. 2011;11:156.
in bp. Negative control refers to a PCR with no DNA template. B. 6. Cooper JL, Till BJ, Laport RG, Darlow MC, Kleffner JM, Jamai A, et al. TILLING
to detect induced mutations in soybean. BMC Plant Biol. 2008;8:9.
Products of second step PCR from the pilot experiment. Amplifications
were performed with 1:100 dilutions of the first-step PCR mixed products 7. Rowland GG. An EMS-induced low-linolenic-acid mutant in McGregor flax
(Linum usitatissimum L.). Can J Plant Sci. 1991;71:393–6.Galindo-González et al. Plant Methods (2015) 11:19 Page 14 of 14
8. Till BJ, Cooper J, Tai TH, Colowit P, Greene EA, Henikoff S, et al. Discovery of 33. Gui B, Shim YY, Datla RSS, Covello PS, Stone SL, Reaney MJT. Identification
chemically induced mutations in rice by TILLING. BMC Plant Biol. 2007;7:19. and quantification of cyclolinopeptides in five flaxseed cultivars. J Agric
9. Xin Z, Wang ML, Barkley NA, Burow G, Franks C, Pederson G, et al. Applying Food Chem. 2012;60:8571–9.
genotyping (TILLING) and phenotyping analyses to elucidate gene function 34. Bruhl L, Matthaus B, Fehling E, Wiege B, Lehmann B, Luftmann H, et al.
in a chemically induced sorghum mutant population. BMC Plant Biol. Identification of bitter off-taste compounds in the stored cold pressed
2008;8:103. linseed oil. J Agric Food Chem. 2007;55:7864–8.
10. Okabe Y, Asamizu E, Saito T, Matsukura C, Ariizumi T, Brès C, et al. Tomato 35. Walsh DT, Babiker EM, Burke IC, Hulbert SH. Camelina mutants resistant to
TILLING technology: development of a reverse genetics tool for the efficient acetolactate synthase inhibitor herbicides. Mol Breed. 2011;30:1053–63.
isolation of mutants from Micro-Tom mutant libraries. Plant Cell Physiol. 36. Loman NJ, Misra RV, Dallman TJ, Constantinidou C, Gharbia SE, Wain J, et al.
2011;52:1994–2005. Performance comparison of benchtop high-throughput sequencing
11. Zhu Q, Smith SM, Ayele M, Yang L, Jogi A, Chaluvadi SR, et al. High- platforms. Nat Biotechnol. 2012;30:434–9.
throughput discovery of mutations in tef semi-dwarfing genes by next- 37. Li X, Buckton AJ, Wilkinson SL, John S, Walsh R, Novotny T, et al. Towards
generation sequencing analysis. Genetics. 2012;192:819–29. clinical molecular diagnosis of inherited cardiac conditions: a comparison of
12. Kurowska M, Daszkowska-Golec A, Gruszka D, Marzec M, Szurman M, bench-top genome DNA sequencers. PLoS One. 2013;8:e67744.
Szarejko I, et al. TILLING: a shortcut in functional genomics. J Appl Genet. 38. Koshimizu E, Miyatake S, Okamoto N, Nakashima M, Tsurusaki Y, Miyake N,
2011;52:371–90. et al. Performance comparison of bench-top next generation sequencers
13. Østergaard L, Yanofsky MF. Establishing gene function by mutagenesis in using microdroplet PCR-based enrichment for targeted sequencing in
Arabidopsis thaliana. Plant J. 2004;39:682–96. patients with autism spectrum disorder. PLoS One. 2013;8:e74167.
14. McCallum CM, Comai L, Greene EA, Henikoff S. Targeting induced local 39. Bragg LM, Stone G, Butler MK, Hugenholtz P, Tyson GW. Shining a light on
lesions IN genomes (TILLING) for plant functional genomics. Plant Physiol. dark sequencing: characterising errors in Ion Torrent PGM data. PLoS
2000;123:439–42. Comput Biol. 2013;9:e1003031.
15. Oleykowski CA, Bronson Mullins CR, Godwin AK, Yeung AT. Mutation 40. Damerla RR, Chatterjee B, Li Y, Francis RJB, Fatakia SN, Lo CW. Ion Torrent
detection using a novel plant endonuclease. Nucleic Acids Res. sequencing for conducting genome-wide scans for mutation mapping
1998;26:4597–602. analysis. Mamm Genome. 2014;25:120–8.
16. Gady ALF, Hermans FWK, Van de Wal MHBJ, van Loo EN, Visser RGF, 41. Quail MA, Kozarewa I, Smith F, Scally A, Stephens PJ, Durbin R, et al. A large
Bachem CWB. Implementation of two high through-put techniques in a genome center’ s improvements to the Illumina sequencing system. Nat
novel application: detecting point mutations in large EMS mutated plant Methods. 2008;5:1005–10.
populations. Plant Methods. 2009;5:13. 42. Walsh PS, Erlich HA, Higuchi R. Preferential PCR amplification of alleles:
17. Liu L, Li Y, Li S, Hu N, He Y, Pong R, et al. Comparison of next-generation mechanisms and solutions. Genome Res. 1992;1:241–50.
sequencing systems. J Biomed Biotechnol. 2012;2012:1–11. 43. Ross MG, Russ C, Costello M, Hollinger A, Lennon NJ, Hegarty R, et al.
18. Bräutigam A, Gowik U. What can next generation sequencing do for you? Characterizing and measuring bias in sequence data. Genome Biol.
Next generation sequencing as a valuable tool in plant research. Plant Biol. 2013;14:R51.
2010;12:831–41. 44. Chan M, Ji SM, Yeo ZX, Gan L, Yap E, Yap YS, et al. Development of a next-
19. Deschamps S, Campbell MA. Utilization of next-generation sequencing generation sequencing method for BRCA mutation screening: a comparison
platforms in plant genomics and genetic variant discovery. Mol Breed. between a high-throughput and a benchtop platform. J Mol Diagn.
2010;25:553–70. 2012;14:602–12.
20. Rigola D, van Oeveren J, Janssen A, Bonné A, Schneiders H, van der Poel 45. Hartwig B, James GV, Konrad K, Schneeberger K, Turck F. Fast isogenic
HJA, et al. High-throughput detection of induced mutations and natural mapping-by-sequencing of ethyl methanesulfonate-induced mutant bulks.
variation using KeyPoint technology. PLoS One. 2009;4:e4761. Plant Physiol. 2012;160:591–600.
46. Thudi M, Li Y, Jackson SA, May GD, Varshney RK. Current state-of-art of
21. Tsai H, Howell T, Nitcher R, Missirian V, Watson B, Ngo KJ, et al. Discovery of
sequencing technologies for plant genomics research. Brief Funct
rare mutations in populations: TILLING by sequencing. Plant Physiol.
Genomics. 2012;11:3–11.
2011;156:1257–68.
47. Aird D, Ross MG, Chen W-S, Danielsson M, Fennell T, Russ C, et al. Analyzing
22. Reddy TV, Dwivedi S, Sharma NK. Development of TILLING by sequencing
and minimizing PCR amplification bias in Illumina sequencing libraries.
platform towards enhanced leaf yield in tobacco. Ind Crops Prod.
Genome Biol. 2011;12:R18.
2012;40:324–35.
48. Rothberg JM, Hinz W, Rearick TM, Schultz J, Mileski W, Davey M, et al. An
23. Quail MA, Smith M, Coupland P, Otto TD, Harris SR, Connor TR, et al. A tale
integrated semiconductor device enabling non-optical genome sequencing.
of three next generation sequencing platforms: comparison of Ion Torrent.
Nature. 2011;475:348–52.
Pacific Biosciences and Illumina MiSeq sequencers. BMC Genomics.
49. Glenn TC. Field guide to next-generation DNA sequencers. Mol Ecol Resour.
2012;13:341.
2011;11:759–69.
24. Hamilton JP, Buell CR. Advances in plant genome sequencing. Plant J.
50. Doyle JJ, Doyle JL. A rapid DNA isolation procedure for small quantities of
2012;70:177–90.
fresh leaf tissue. Phytochem Bull. 1987;19:11–5.
25. Merriman B, Rothberg JM. Progress in ion torrent semiconductor chip based
51. Untergasser A, Cutcutache I, Koressaar T, Ye J, Faircloth BC, Remm M, et al.
sequencing. Electrophoresis. 2012;33:3397–417.
Primer3–new capabilities and interfaces. Nucleic Acids Res. 2012;40:e115.
26. Duguid SD, Kenaschuk EO, Rashid KY. Macbeth flax. Can J Plant Sci.
2003;83:803–5.
27. Kumar S, You FM, Cloutier S. Genome wide SNP discovery in flax through
next generation sequencing of reduced representation libraries. BMC
Genomics. 2012;13:684. Submit your next manuscript to BioMed Central
28. Life Technologies Ion OneTouch System User Guide. Life technologies: and take full advantage of:
Carlsbad; 2012.
29. Pinzon-Latorre D, Deyholos MK. Pectinmethylesterases (PME) and
• Convenient online submission
pectinmethylesterase inhibitors (PMEI) enriched during phloem fiber
development in flax (Linum usitatissimum). PLoS One. 2014;9:e105386. • Thorough peer review
30. Zuker M. Mfold web server for nucleic acid folding and hybridization • No space constraints or color figure charges
prediction. Nucleic Acids Res. 2003;31:3406–15.
• Immediate publication on acceptance
31. Di Matteo A, Giovane A, Raiola A, Camardella L, Bonivento D, De Lorenzo G,
et al. Structural Basis for the Interaction between Pectin Methylesterase and • Inclusion in PubMed, CAS, Scopus and Google Scholar
a Specific Inhibitor Protein. Plant Cell. 2005;17:849–58. • Research which is freely available for redistribution
32. Tranel PJ, Wright TR. Resistance of weeds to ALS-inhibiting herbicides : what
have we learned ? Weed Sci. 2002;50:700–12.
Submit your manuscript at
www.biomedcentral.com/submitYou can also read