Iris Presentation Attack Detection by Attention-based and Deep Pixel-wise Binary Supervision Network
←
→
Page content transcription
If your browser does not render page correctly, please read the page content below
Iris Presentation Attack Detection by Attention-based and
                                                                  Deep Pixel-wise Binary Supervision Network

                                                Meiling Fang1,2 , Naser Damer1,2 , Fadi Boutros1,2 , Florian Kirchbuchner1,2 , Arjan Kuijper1,2
                                                     1
                                                       Fraunhofer Institute for Computer Graphics Research IGD, Darmstadt, Germany
                                                   2
                                                     Mathematical and Applied Visual Computing, TU Darmstadt, Darmstadt, Germany
                                                                           Email: meiling.fang@igd.fraunhofer.de
arXiv:2106.14845v1 [cs.CV] 28 Jun 2021

                                                                  Abstract                                was verified in the LivDet-Iris competitions. The LivDet-
                                                                                                          Iris is an international competition series launched in 2013
                                            Iris presentation attack detection (PAD) plays a vital role   to assess the current state-of-the-art (SoTA) in the iris PAD
                                         in iris recognition systems. Most existing CNN-based iris        field. The two most recent edition took place in 2017 [32]
                                         PAD solutions 1) perform only binary label supervision dur-      and 2020 [5]. The results reported in the LivDet-Iris 2017
                                         ing the training of CNNs, serving global information learn-      [32] databases pointed out that there are still advancements
                                         ing but weakening the capture of local discriminative fea-       to be made in the detection of iris PAs, especially under
                                         tures, 2) prefer the stacked deeper convolutions or expert-      cross-PA, cross-sensor, or cross-database scenarios. Sub-
                                         designed networks, raising the risk of overfitting, 3) fuse      sequently, LivDet-Iris 2020 [5] reported a significant per-
                                         multiple PAD systems or various types of features, increas-      formance degradation on novel PAs, showing that the iris
                                         ing difficulty for deployment on mobile devices. Hence,          PAD is still a challenging task. No specific training data
                                         we propose a novel attention-based deep pixel-wise bi-           was offered and the test data was not publicly available as of
                                         nary supervision (A-PBS) method. Pixel-wise supervision          now for the LivDet-Iris 2020. Therefore, our experiments
                                         is first able to capture the fine-grained pixel/patch-level      were conducted on LivDet-Iris 2017 and other three pub-
                                         cues. Then, the attention mechanism guides the network           licly available databases. By reviewing most of the recent
                                         to automatically find regions that most contribute to an         iris PAD works (see Sec. 2), we find that all CNN-based iris
                                         accurate PAD decision. Extensive experiments are per-            PAD solutions trained models by binary supervision, i.e.,
                                         formed on LivDet-Iris 2017 and three other publicly avail-       networks were only informed that an iris image is bona fide
                                         able databases to show the effectiveness and robustness of       or attack. Binary supervised training facilitates the use of
                                         proposed A-PBS methods. For instance, the A-PBS model            global information but may cause overfitting. Moreover,
                                         achieves an HTER of 6.50% on the IIITD-WVU database              the network might not be able to optimally locate the re-
                                         outperforming state-of-the-art methods.                          gions that contribute the most to make accurate decisions
                                                                                                          based only on the binary information provided.
                                         1. Introduction
                                            In recent years, iris recognition systems are being de-          To target these issues, we introduce an Attention-
                                         ployed in many law enforcement or civil applications [16,        based Pixel-wise Binary Supervision (A-PBS) network (See
                                         2, 3]. However, iris recognition systems are vulnerable to       Fig.1). The main contributions of the work include: 1)
                                         Presentation Attacks (PAs) [32, 5], performing to obfuscate      we exploit deep Pixel-wise Binary Supervision (PBS) along
                                         the identity or impersonate a specific person ranging from       with binary classification for capturing subtle features in
                                         printouts, replay, or textured contact lenses. Therefore, Pre-   attacking iris samples with the help of spatially positional
                                         sentation Attack Detection (PAD) field has received increas-     supervision. 2) we propose a novel effective and ro-
                                         ing attention to secure the recognition systems.                 bust attention-based PBS (A-PBS) architecture, an extended
                                                                                                          method of PBS, for fine-grained local information learn-
                                            Recent iris PAD works [22, 6, 9, 24, 7, 8] are com-
                                                                                                          ing in the iris PAD task, 3) we conduct extensive exper-
                                         peting to boost the performance using Convolution Neural
                                                                                                          iments on LivDet-Iris 2017 and other three publicly avail-
                                         Network (CNN) to facilitate discriminative feature learning.
                                                                                                          able databases indicating that our proposed PBS and A-PBS
                                         Even though the CNN-based algorithms achieved good re-
                                                                                                          solution outperforms SoTA PAD approaches in most experi-
                                         sults under intra-database setups, they do not generalized
                                                                                                          mental settings. Moreover, the A-PBS method exhibits gen-
                                         well across databases and unseen attacks. This situation
                                                                                                          eralizability across unknown PAs, sensors, and databases.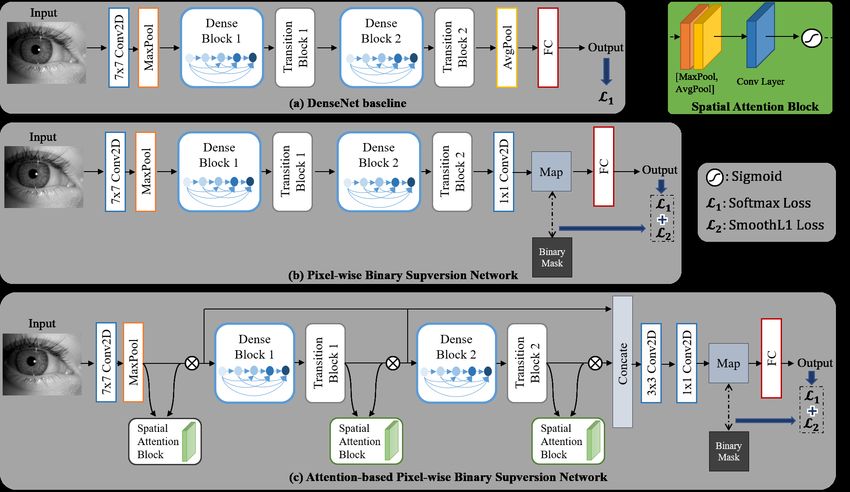
2. Related Works                                                  PBS may also lead to another issue, as the model misses the
                                                                  exploration of important regions due to the ’equal’ focus on
    CNN-based iris PAD: In recent years, many works               each pixel/patch. To overcome some of these difficulties,
[9, 6, 24, 22, 29, 8] leveraged deep learning techniques          we propose the A-PBS architecture to force the network to
and showed great progress in iris PAD performance.                find regions that should be emphasized or suppressed for a
Kuehlkamp et al. [22] explored combinations of CNNs               more accurate iris PAD decision. The detailed introduction
with the hand-crafted features. However, training 61 CNNs         of PBS and A-PBS can be found in Sec. 3.
needs high computational resources and can be considered
as an over-tailored solution. Yadav et al. [29] also employed     3. Methodology
the fusion of hand-crafted features with CNN features and            In this section, we first introduce DenseNet [14] as a pre-
achieved good results. Unlike fusing the hand-crafted and         liminary architecture. Then, our proposed Pixel-wise Bi-
CNN-based features, Fang et al. [6] suggested a multi-layer       nary Supervision (PBS) and Attention-based PBS (A-PBS)
deep features fusion approach (MLF) based on the charac-          methods are described. As shown in Fig. 1, the first gray
teristics of networks that different convolution layers en-       block (a) presents the basic DenseNet architecture with bi-
code the different levels of information. Apart from the          nary supervision, the second gray block (b) introduces the
fusion methods, a deep learning-based framework named             binary and PBS, and the third block (c) is the PBS with the
Micro Stripe Analyses (MSA) [9, 7] was introduce to cap-          fused multi-scale spatial attention mechanism (A-PBS).
ture the artifacts around the iris/sclera boundary and showed
a good performance on textured lens attacks. Yadav et al.         3.1. Baseline: DenseNet
[31] presented DensePAD method to detec PAs by utilizing              DenseNet [14] introduced direct connection between
DenseNet architecture [14]. Furthermore, Sharma and Ross          any two layers with the same feature-map size in a feed-
[24] also exploited the architectural benefits of DenseNet        forward fashion. The reasons motivating our choice of
[14] to propose an iris PA detector (D-NetPAD) evalu-             DensetNet are: 1) whilst following a simple connectivity
ated on a proprietary database and the LivDet-Iris 2017           rule, DenseNets naturally integrate the properties of iden-
databases. Although fine-tuned D-NetPAD achieved good             tity mappings and deep supervision. 2) DenseNet has al-
results on LivDet-Iris 2017 databases with the help of their      ready shown its superiority in ris PAD [31, 24, 5]. As shown
private additional data, scratch D-NetPAD still failed in the     in Fig. 1.(a), we reuse two dense and transition blocks of
case of cross-database scenarios. These works inspired us         pre-trained DenseNet121. Following the second transition
to use DenseNet [14] as the backbone for further design of        block, an average pooling layer and a fully-connected (FC)
network architectures. Very recently, Chen et al. [4] pro-        classification layer are sequentially appended to generate
posed an attention-guided iris PAD method for refine the          the final prediction to determine whether the iris image is
feature maps of DenseNet [14]. However, this work used            bona fide or attack. PBS and A-PBS networks will be ex-
conventional sample binary supervision and did not report         panded on this basic architecture later.
cross-database experiments to verify the generalizability of
                                                                  3.2. Pixel-wise Binary Supervision Network (PBS)
the added attention module.
    Limitations: To our knowledge, current CNN-based iris            From the recent iris PAD literature [9, 6, 24, 22], it
PAD solutions train models only through binary supervi-           can be seen that CNN-based methods outperformed hand-
sion (bona fide or attack). From the above recent iris PAD        crafted feature-based methods. In typical CNN-based iris
literature, it can be seen that deep learning-based methods       PAD methods, networks are designed such that feeding pre-
boost the performance but still have the risk of overfitting      processed iris image as input to learn discriminative fea-
under cross-PA/cross-database scenarios. Hence, some re-          tures between bona fide and artifacts. To that end, a FC
cent methods proposed the fusion of multiple PAD systems          layer is generally introduced to output a prediction score su-
or features to improve the generalizability, which makes          pervised by binary label (bona fide or attack). Recent face
it challenging for deployment. One of the major reasons           PAD works have shown that auxiliary supervision [23, 10]
causing overfitting is the lack of availability of a sufficient   improved their performance. Binary label supervised classi-
amount of variant iris data for training networks. Another        fication learns semantic features by capture global informa-
possible reason might be binary supervision. While the bi-        tion but may cause overfitting. Moreover, such embedded
nary classification model provides useful global informa-         ’globally’ features might lose the local detailed information
tion, its ability to capture subtle differences in attacking      in spatial position. These drawbacks give us the insight that
iris samples may be weakened, and thus the deep features          additional pixel-wise binary along with binary supervision
might be less discriminative. This possible cause motivates       might improve the iris attack detection results. First, such
us to exploit binary masks to supervise the training of our       supervision approach can be seen as a combination of patch-
PAD model, because a binary mask label may help to su-            based and vanilla CNN based methods. To be specific, each
pervise the information at each spatial location. However,        pixel-wise score in output feature map is considered as the
Figure 1. An overview of (a) baseline DenseNet, (b) proposed PBS and (c) proposed A-PBS networks.
score generated from the patches in an iris image. Second, module focuses only on the inter-channel relationship by
the binary mask supervision would be provided for the deep using dedicated global feature descriptors, which leads to
embedding features in each spatial position. Hence, an in- a loss of information (e.g., class-deterministic pixels) and
termediate feature map is predicted before the final binary may result in further performance degradation when the do-
classification layer (as shown in Fig. 1.(b)). The output main is shifted, e.g., different sensors and changing illu-
from the Transition Block 2 is 384 channels with the size mination, 2) the spatial attention module utilizes the inter-
of 14 × 14. A 1 × 1 convolution layer is added to produced spatial relationship of features. Specifically, it focuses on
the map. Finally, a FC layer is used to generates prediction. ’where’ is an informative part, which is more proper for
producing output feature maps for supervision. Moreover,
3.3. Attention-based PBS Network (A-PBS)
based on the fact that the network embeds different layers
The architecture of PBS is designed coarsely (simply uti- of information at different levels of abstraction, the MLF [6]
lizing the intermediate feature map) based on the DenseNet approach confirmed that the fusing deep feature from mul-
[14], which might be sub-optimal for iris PAD task. To en- tiple layers is beneficial to enhance the robustness of the
hance that, and inspired by Convolutional Block Attention networks in the iris PAD task. Nevertheless, we propose to
Mechanism (CBAM) [28] and MLF [6], we propose an A- fuse feature maps generated from different levels directly
PBS method with multi-scale feature fusion (Fig. 1.(c)). inside the network instead of fusing features extracted from
Although PBS can boost performance of iris PAD, it a trained model in MLF [6]. One reason is that finding the
shows imperfect invariation under more complicated cross- best combination of network layers to fuse is a challenging
PA or cross-database scenarios (See results in Tab. 4). As task and difficult to generalize well, especially when target-
a result, it is worth finding the important regions to focus ing different network architectures.
on, although it contradicts learning more discriminative fea- As illustrated in Fig. 1, three spatial attention modules
tures. In contrast, the attention mechanism aims to automat- are added after MaxPool, Transition Block 1, and Transition
ically learn essential discriminate features from inputs that Block 2, respectively. The feature learned from the MaxPool
are relevant to attack detection. Woo et al. [28] presented an or two Transition Blocks can be considered as low-, middle-
attention module consisting of the channel and spatial dis- and high-level features and denoted as
tinctive sub-modules, which possessed consistent improve- Flevel ∈ RC×H×W , level ∈ {low, mid, high}
ments in classification and detection performance with var-
ious network architectures. However, only spatial attention . Then, the generated attention maps Alevel ∈ RH×W
module is adopted in our case due to the following reasons: encoding where to emphasize or suppress are used to re-
0
1) the Squeeze-and-Excitation (SE) based channel attention fine Flevel . The refined feature Flevel can be formulated0
as Flevel = Flevel ⊗ Alevel where ⊗ is matrix multipli- 4. Experimental Evaluation
cation. Finally, such three different level refined features
are concatenated together and then fed into a 1 × 1 convolu- 4.1. Databases
tion layer to produce the pixel-wise feature map for super- The proposed method is evaluated on multiple databases:
vision. It should be noticed that the size of convolutional three databases comprising of textured contact lens at-
kernel in three spatial attention modules is different. As tacks captured by different sensors [17, 18, 30], and
mentioned earlier, the deeper the network layer, the more three databases (Clarkson, Notre Dame and IIITD-WVU)
complex and abstract the extracted features. Therefore, we from the LivDet-Iris 2017 competition [32]. The Warsaw
should use smaller convolutional kernels for deeper features database in the LivDet-Iris 2017 is no longer publicly avail-
to locate useful region. The kernel sizes of low-, middle- able due to General Data Protection Regulation (GDPR) is-
and high-level layers are thus set to 7, 5, and 3, respectively. sues. For the experiments in NDCLD13, NDCLD15, IIIT-
The experiments have been demonstrated later in Sec. 4 and CLI databases, 5-fold cross-validation was performed due
showed that A-PBS network possesses better performance to no pre-defined training and testing sets. For the exper-
and generalizability than the PBS approach. iments in competition databases, we followed the defined
3.4. Loss Function data partition and experimental setting [32]. Subjects in
each fold or defined partition are dis-joint. The summery
For the loss function, Binary Cross Entropy (BCE) loss
of the used databases is listed in Tab 1.
is used for final binary supervision. For the sake of robust
PBS needed in iris PAD, Smooth L1 (SmoothL1) loss is NDCLD13: The NDCLD13 database consists of 5100
utilized to help the network reduce its sensitivity to outliers images and is conceptually divided into two sets: 1)
in the feature map. The equations for SmoothL1 is shown LG4000 including 4200 images captured by IrisAccess
below: LG4000 camera, 2) AD100 comprising of 900 images cap-
1X tured by risGuard AD100 camera. Both the training and the
LSmoothL1 = z test set are divided equally into no lens (bona fide), soft lens
n
(bona fide), and textured lens (attack) classes.
1 · (y − x)2 , if |y − x| < 1
NDCLD15: The 7300 images in the NDCLD15 [17]
where z = 2 1 were captured by two sensors, IrisGuard AD100 and IrisAc-
|y − x| − , otherwise
2 cess LG4000 under MIR illumination and controlled envi-
ronments. The NDCLD15 contains iris images wearing no
where n is the amount number of pixels in the output map
lenses, soft lenses, textured lenses.
(14 × 14 in our case). The equation of BCE is:
IIIT-D CLI: IIIT-D CLI database contains 6570 iris im-
LBCE = −[y · log p + (1 − y) · log(1 − p)] ages of 101 subjects with left and right eyes. For each in-
dividual, three types of images were captured: 1) no lens,
where y in both loss equations presents the ground truth 2) soft lens, and 3) textured lens. Iris images are divided
label. x in SmoothL1 loss presents to the value in feature into two sets based on captured sensors: 1) Cogent dual iris
map, while p in BCE loss is predicted probability. The over- sensor and 2) VistaFA2E single iris sensor.
all loss Loverall is formulated as Loverall = λ·LSmoothL1 + LivDet-Iris 2017 Database: Though the new edition
(1 − λ) · LBCE . The λ is set to 0.2 in our experiments. LivDet-Iris competition was held in 2020, we still eval-
3.5. Implementation Details uate the algorithms in databases provided by LivDet-Iris
2017 for several reasons. First, no official training data
For the databases, whose distribution of bona fides and
was announced in the LivDet-Iris 2020, because the orga-
attacks are imbalanced in the training set, class balancing is
nizers encouraged the participants to use all available data
done by under-sampling the majority class. Data augmen-
(both publicly and proprietary) to improve the effectiveness
tation is performed during training using random horizontal
and robustness. Second, the test data is not publicly avail-
flips with a probability of 0.5. By considering the limited
able. To make a fair comparison with SoTA algorithms
amount of iris data, the model weight of DenseNet, PBS
on equivalent data, we use databases in LivDet-Iris 2017
and A-PBS models are first initialized by the base architec-
for restricting the factors affecting the evaluation to the al-
ture DenseNet121 trained on the ImageNet dataset and then
gorithm itself rather than the data. Third, the LivDet-Iris
fine-tuned by iris PAD data. The Adam optimizer is used
2017 competition databases are still challenging due to the
for training with a initial learning rate of 1e−4 and a weight
cross-PA and cross-database scenario settings. The Clark-
decay of 1e−6 . To avoid overfitting, the model is trained
son and Notre Dame database are designed for cross-PA
with the maximum 20 epochs and the learning rate halved
scenarios, while the IIIT-WVU database is designed for a
every 6 epochs. The batch size is 64. In the testing stage,
cross-database evaluation due to the different sensors and
we use the binary output as the final prediction score. The
acquisition environments. The Clarkson testing set includes
proposed method was implemented using the Pytorch.Database # Training # Testing Type of Iris Images
NDCLD-2015 [17] 6,000 1,300 Real, soft and textured lens
LG4000 3,000 1,200 Real, soft and textured lens
NDCLD-2013 [18]
AD100 600 300 Real, soft and textured lens
Cognet 1,723 1,785 Real, soft and textured lens
IIIT-D CLI [20, 30]
Vista 1,523 1,553 Real, soft and textured lens
Clarkson (cross-PAD) 4937 3158 Real, textured lens, printouts
LivDet-Iris 2017 [32]
Notre Dame (cross-PA) 1,200 3,600 Real, textured lenses
IIITD-WVU (cross-DB) 6,250 4,209 Real, textured lenses, printouts, lens printouts
Table 1. Characteristics of the used databases. All databases have the training and test sets based on their own experimental setting in the
related papers. The Warsaw database in Iris-LivDet-2017 competition are no longer publicly available.
additional unknown visible light image printouts and un- data. Consequently, to make a fair comparison with SoTA
known textured lenses (unknown pattern). Moreover, Notre algorithms on equivalent data, we compare to the Scratch
Dame focused on the unknown textured lenses. However, version of the D-NetPAD results [24], since Pre-trained and
the Warsaw database is no longer publicly available. Fine-tuned D-NetPAD used additional data (including part
4.2. Evaluation Metrics of Notre Dame test data) for training. This was not an issue
with the other compared SoTA methods.
The following metrics are used to measure the PAD al-
gorithm performance: 1) Attack Presentation Classification It can be observed in Tab. 2 that A-PBS architecture
Error Rate (APCER), the proportion of attack images incor- achieves significantly improved performance in compari-
rectly classified as bona fide samples, 2) Bona fide Presen- son to DenseNet and also slightly lower HTER values than
tation Classification Error Rate (BPCER), the proportion of the PBS model in all cases. For instance, the HTER value
bona fide images incorrectly classified as attack samples, 3) on Notre Dame is decreased from 8.14% by DenseNet and
Half Total Error Rate (HTER), the average of APCER and 4.97% by PBS to 3.94% by A-PBS. Although the slightly
BPCER. The APCER and BPCER follows the standard def- worse results on Notre Dame might be caused by the insuf-
inition presented in the ISO/IEC 30107-3 [15] and adopted ficient data in the training set, our PBS and A-PBS methods
in most PAD literature including in LivDet-Iris 2017. The show significant superiority on the most challenging IIITD-
threshold for determining the APCER and BPCER is 0.5 WVU database. Moreover, we plot the PA score distribu-
as defined in the LivDet-Iris 2017 protocol. In addition, for tion of the bona fide and PAs in Fig.2 for further analysis.
further comparison on IIITD-CLI [30, 20] database, we also The score distribution generated by A-PBS shows an evi-
report the Correct Classification Accuracy (CCR), which is dent better separation between bona fide (green) and PAs
the ratio between the total number of correctly classified im- (blue). In addition to reporting the results determined by
ages and the number of all classified presentations. More- a threshold of 0.5, we also measure the performance of
over, the performance of our proposed methods is evaluated DenseNet, PBS, and A-PBS in terms of its TDR at 0.2%
in terms of True Detection Rate (TDR) at a False Detection FDR (to follow SoTA trends []) in Tab. 3. It is worth
Rate (FDR) of 0.2% (TDR at 0.2% FDR is normally used noting that our A-PBS method obtains the highest TDR
to demonstrate the PAD performance in practice). TDR is value (90.00%) on unknown-test set in Notre Dame, while
1 -APCER, and FDR is the same as BPCER. An Equal Er- the second-highest TDR is 76.89% achieved by PBS. We
ror Rate (EER) locating at the intersection of APCER and further evaluate the generalizability of our models under
BPCER is also reported in Tab. 4. The metrics beyond cross-database scenario, e.g., the model trained on Notre
APCER and BPCER are presented to enable a direct com- Dame is tested on Clarkson and IIITD-WVU. As shown in
parison with reported results in SoTAs. Tab. 4, the A-PBS model outperforms DenseNet and PBS in
most cases, which verifying that additional spatial attention
4.3. Results on LivDet-Iris 2017 Database
modules can reduce the overfitting of the PBS model and
Tab. 2 summarizes the results in terms of APCER, capture fine-grained features. Furthermore, the DenseNet
BPCER, and HTER on the LivDet-Iris 2017 databases. We and A-PBS models trained on Notre Dame even exceed
evaluate the algorithms on databases provided by LivDet- the prior SoTAs when testing on the IIIT-WVU database
Iris 2017. The evaluation and comparison on LivDet-Iris (8.81% HTER by DenseNet and 9.49% by A-PBS, while
2020 are not included due to 1) no officially offered training the best prior SoTA achieved 11.13% (see Tab. 2)). It should
data, 2) not publicly available test data. Moreover, LivDet- be noted that the Notre Dame training dataset contains only
Iris 2017 databases are designed for cross-PA and cross- textured lens attacks while Clarkson and IIIT-WVU test-
database scenarios, which is still considered a challenging ing datasets comprise of both textured lens and printouts
task. In this work, we aim to focus on the impact of the algo- attacks, which makes this evaluation scenario partially con-
rithm itself on PAD performance rather than the diversity of sider unknown PAs. In such an unknown-PAs situation, ourPAD Algorithm (%)
Database Metric
Winner [32] SpoofNet [19] Meta-Fusion [22] D-NetPAD [24] MLF [6] MSA [9, 7] DenseNet PBS A-PBS
APCER 13.39 33.00 18.66 5.78 - - 10.64 8.97 6.16
Clarkson BPCER 0.81 0.00 0.24 0.94 - - 0.00 0.00 0.81
HTER 7.10 16.50 9.45 3.36 - - 5.32 4.48 3.48
APCER 7.78 18.05 4.61 10.38 2.71 12.28 16.00 8.89 7.88
Notre Dame BPCER 0.28 0.94 1.94 3.32 1.89 0.17 0.28 1.06 0.00
HTER 4.03 9.50 3.28 6.81 2.31 6.23 8.14 4.97 3.94
APCER 29.40 0.34 12.32 36.41 5.39 2.31 2.88 5.76 8.86
IIITD-WVU BPCER 3.99 36.89 17.52 10.12 24.79 19.94 17.95 8.26 4.13
HTER 16.70 18.62 14.92 23.27 15.09 11.13 10.41 7.01 6.50
Table 2. Iris PAD performance of our proposed methods and existing SoTA algorithms on LivDet-Iris 2017 databases in terms of APCER
(%), BPCER (%) and HTER (%) which determined by a threshold of 0.5. The Winner in first column refers to the winner of each
competition database. Bold numbers indicate the first two lowest HTERs.
TDR (%) @ 0.2% FDR 4.5. Results on IIITD-CLI Database
Database
D-NetPAD DenseNet PBS A-PBS
Clarkson 92.05 92.89 94.02 92.35 Most of the existing works reported the results us-
K 100 99.68 99.78 99.78
Notre Dame
U 66.55 58.33 76.89 90.00 ing CCR metric on IIITD-CLI database [30, 20], we also
IIITD-WVU 29.30 58.97 69.32 72.00 strictly follow its experimental protocol and the experimen-
tal results are compared in Tab.7. In addition, the TDR at
Table 3. Iris PAD performance reported in terms of TDR (%) at 0.2% FDR is reported in Tab.6 . The experiments are per-
0.2% FDR on the LivDet-Iris 2017 databases. K indicates known formed on Cognet and Vista sensor subsets, respectively.
test subset and U is unknown subset. The highest TDR is in bold.
As shown in Tab. 5, our models outperform all hand-crafted
and CNN-based methods by a large margin (99.79% on
A-PBS method achieved significantly improved results.In Cognet subset and 100% on Vista subset). The near-perfect
general, the cross-database scenario is still a challenging classification performance achieved by DenseNet, PBS, and
problem since many D-EER values are above 20% (Tab. 4). A-PBS reveals that despite the improvements of deep learn-
ing models, large-scale iris PAD databases are urgently
needed to be collected for future studies.
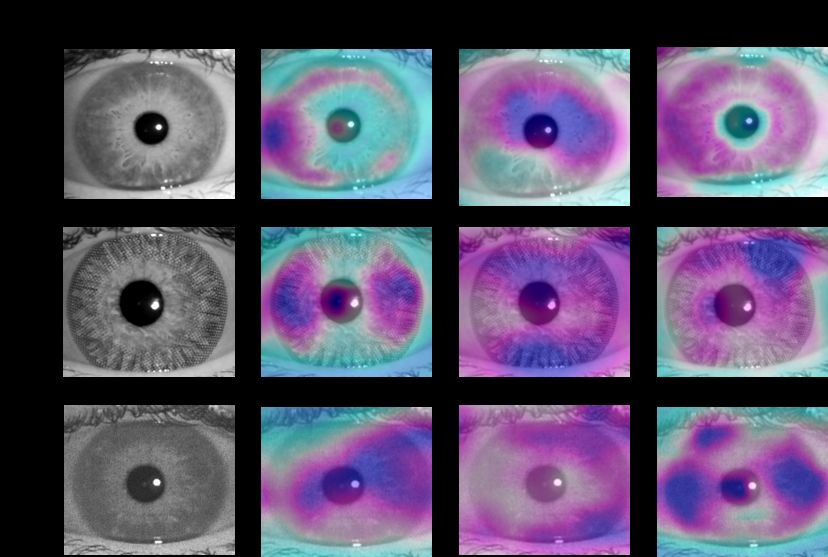
4.6. Visualization and Analysis
Figure 2. Score distribution of bona fide (green) and PAs (blue)
on the IIITD-WVU test set. The histograms from left to right are
produced by DenseNet, PBS, and A-PBS, respectively. The larger
separability (measured by Fisher Discriminant Ratio (FDR)) and
maller overlap indicate higher classification performance.
4.4. Results on NDCLD-2013/2015 Database
Figure 3. Score-CAM visualizations for bona fide and attack sam-
Tab. 5 compares the iris PAD performance of our models ples in the IIITD-WVU test set. The darker the color of the region,
with five SoTA methods on NDCLD2015 and two differ- the higher the attention on this area. The column from left to right
ent subsets in the NDCLD-2013 database. It can be seen refers to the raw samples, maps produced by DenseNet, PBS, and
from Tab. 5 that our A-PBS model performs the best on all A-PBS model, respectively. The first row is the bona fide samples
databases, revealing the excellent effectiveness of a com- and the left rows are textured contact lens and printouts attacks.
bination of PBS and attention module on textured contact PBS is expected to learn more discriminative features by
lens attacks. In addition to comparison with SoTAs, we supervising each pixel/patch in comparison with binary su-
also report the TDR (%) at 0.2% FDR in Tab. 6. Despite all pervised DenseNet. Subsequently, the A-PBS model, an ex-
three models produce similarly good results, A-PBS is still tended model of PBS, is hypothesized to automatically lo-
slightly better than DenseNet and PBS. The near-perfect re- cate the important regions that carry the features most use-
sults on NDCLD-2013/-2015 databases hint at the obsoles- ful for making an accurate iris PAD decision. To further
cence and limitations of the current iris PAD databases and verify these assumptions, Score-Weighted Class Activation
call for the need for more diversity in iris PAD data. Mapping (Score-CAM) [26] is used to generate the visual-Trained Dataset Notre Dame Clarkson IIITD-WVU
Tested Dataset Clarkson IIITD-WVU Notre Dame IIITD-WVU Notre Dame Clarkson
Metric EER HTER EER HTER EER HTER EER HTER EER HTER EER HTER
DenseNet 30.43 32.01 7.84 8.81 22.33 31.11 26.78 42.40 18.33 19.78 22.64 46.21
PBS 44.42 45.31 18.37 17.49 28.61 32.42 25.78 42.48 12.39 16.86 37.24 47.17
A-PBS 20.55 22.46 7.11 9.49 21.33 23.08 24.47 34.17 15.06 27.61 21.63 21.99
Table 4. Iris PAD performance measured under cross-database scenarios and reported in terms of EER (%) and HTER (%). HTER is
determined by a threshold of 0.5. The lowest error rate is in bold.
Presentation Attack Detection Algorithm (%)
Database Metric
LBP[12] WLBP [33] DESIST [21] MHVF [29] MSA [9, 7] DenseNet PBS A-PBS
ACPER 6.15 50.58 29.81 1.92 0.18 1.58 1.09 0.08
NDCLD15 [17] BPCER 38.70 4.41 9.22 0.39 0.00 0.14 0.00 0.06
HTER 22.43 27.50 19.52 1.16 0.09 0.86 0.54 0.07
APCER 0.00 2.00 0.50 0.00 0.00 0.20 0.00 0.00
NDCLD13 (LG4000) [18] BPCER 0.38 1.00 0.50 0.00 0.00 0.28 0.03 0.00
HTER 0.19 1.50 0.50 0.00 0.00 0.24 0.02 0.00
APCER 0.00 9.00 2.00 1.00 1.00 0.00 0.00 0.00
NDCLD13 (AD100) [18] BPCER 11.50 14.00 1.50 0.00 0.00 0.00 0.00 0.00
HTER 5.75 11.50 1.75 0.50 0.50 0.00 0.00 0.00
Table 5. Iris PAD performance of our proposed methods and existing SoTAs on NDCLD-2013/-2015 databases with a threshold of 0.5.
TDR (%) @ 0.2% FDR 5. Conclusion
Database
DenseNet PBS A-PBS
NDCLD15 99.45 99.84 99.96
NDCLD13 (LG4000) 99.75 100 100 In this work, we propose a novel attention-based deep
NDCLD13 (AD100) 100 100 100 pixel-wise binary supervision (A-PBS) method for iris
IIITD-CLI (Cognet) 99.02 99.59 99.57 PAD. The proposed method aimed at 1) capture the fine-
IIITD-CLI (Vista) 100 100 100
grained pixel/patch-level cues with the help of PBS, 2) find
Table 6. Iris PAD performance reported in terms of TDR (%) at regions that the most contribute to an accurate PAD decision
0.2% FDR on NDCLD-2013/-2015databases. automatically by the attention mechanism. Extensive exper-
iments are performed on LivDet-Iris 2017 and other three
PAD Algorithms Cogent Vista
Textural Features [27] 55.53 87.06
publicly available databases to verify the effectiveness and
WLBP [33] 65.40 66.91 robustness of proposed A-PBS methods. The A-PBS model
LBP+SVM [12] 77.46 76.01 outperforms SoTA methods in most experimental cases in-
LBP+PHOG+SVM [1] 75.80 74.45 cluding scenarios with unknown attacks, sensors, databases.
mLBP [30] 80.87 93.91
ResNet18 [13] 85.15 80.97
References
VGG [25] 90.40 94.82 [1] A. Bosch, A. Zisserman, and X. Muñoz. Representing shape
MVANet [11] 94.90 95.11 with a spatial pyramid kernel. In N. Sebe and M. Worring,
DenseNet 99.37 100 editors, Proceedings of the 6th CIVR 2007, Amsterdam, The
PBS 99.62 100 Netherlands, July 9-11, 2007, pages 401–408. ACM, 2007.
A-PBS 99.70 100 [2] F. Boutros, N. Damer, K. Raja, R. Ramachandra, F. Kirch-
buchner, and A. Kuijper. Iris and periocular biometrics
Table 7. Iris PAD performance in terms of CCR (%) on IIITD-CLI. within head mounted displays: Segmentation, recognition,
and synthetic generation. Image Vis. Comput., 2020.
izations for randomly chosen bona fide and attack iris im- [3] F. Boutros, N. Damer, K. Raja, R. Ramachandra, F. Kirch-
ages (these images belong to the same identity) in the IIIT- buchner, and A. Kuijper. On benchmarking iris recogni-
WVU test set. As illustrated in Fig. 3, it is clear that PBS tion within a head-mounted display for ar/vr applications. In
and A-PBS models pay more attention to the iris region, 2020 IEEE IJCB 2020, Sept 28 – Oct 1, 2020. IEEE, 2020.
while the DenseNet model seems to lose some information. [4] C. Chen and A. Ross. An explainable attention-guided iris
By observing the heatmaps produced by PBS, it is noticed presentation attack detector. In IEEE WACV Workshops
that the attention appears to cover almost the whole iris and 2021, Waikola, HI, USA, 2021, pages 97–106. IEEE, 2021.
pupil area. This is consistent with our assumption and ex- [5] P. Das, J. McGrath, Z. Fang, A. Boyd, G. Jang, A. Mo-
pectation for PBS. Furthermore, it is clear in Fig. 3 that the hammadi, S. Purnapatra, D. Yambay, S. Marcel, M. Trok-
use of the spatial attention module has enabled the model ielewicz, P. Maciejewicz, K. W. Bowyer, A. Czajka,
to shift more focus to the circular iris. To be specific, the S. Schuckers, J. E. Tapia, S. Gonzalez, M. Fang, N. Damer,
F. Boutros, A. Kuijper, R. Sharma, C. Chen, and A. Ross. Iris
attention in the corners and boundaries of the image, even
liveness detection competition (livdet-iris) - the 2020 edition.
including the pupil is slightly decreased.In IEEE IJCB, online, 28.09-01.10, 2020, pages 1–9. IEEE, editors, International Conference on Biometrics, ICB 2013,
2020. 4-7 June, 2013, Madrid, Spain, pages 1–7. IEEE, 2013.
[6] M. Fang, N. Damer, F. Boutros, F. Kirchbuchner, and A. Kui- [21] N. Kohli, D. Yadav, M. Vatsa, R. Singh, and A. Noore. De-
jper. Deep learning multi-layer fusion for an accurate iris tecting medley of iris spoofing attacks using DESIST. In 8th
presentation attack detection. In IEEE 23rd FUSION, on- IEEE BTAS 2016, Niagara Falls, NY, USA, September 6-9,
line, July 6-9, 2020, pages 1–8. IEEE, 2020. 2016, pages 1–6. IEEE, 2016.
[7] M. Fang, N. Damer, F. Boutros, F. Kirchbuchner, and A. Kui- [22] A. Kuehlkamp, A. Pinto, A. Rocha, K. W. Bowyer, and
jper. Cross-database and cross-attack iris presentation attack A. Czajka. Ensemble of multi-view learning classifiers for
detection using micro stripes analyses. Image Vis. Comput., cross-domain iris presentation attack detection. IEEE TIFS,
105:104057, 2021. 14(6):1419–1431, June 2019.
[8] M. Fang, N. Damer, F. Kirchbuchner, and A. Kuijper. De- [23] Y. Liu, A. Jourabloo, and X. Liu. Learning deep models
mographic bias in presentation attack detection of iris recog- for face anti-spoofing: Binary or auxiliary supervision. In
nition systems. In 28th European Signal Processing Con- 2018 IEEE CVPR 2018, Salt Lake City, UT, USA, June 18-
ference, EUSIPCO 2020, Amsterdam, Netherlands, January 22, 2018, pages 389–398. IEEE Computer Society, 2018.
18-21, 2021, pages 835–839. IEEE, 2020. [24] R. Sharma and A. Ross. D-netpad: An explainable and in-
[9] M. Fang, N. Damer, F. Kirchbuchner, and A. Kuijper. Micro terpretable iris presentation attack detector. In 2020 IEEE
stripes analyses for iris presentation attack detection. In 2020 International Joint Conference on Biometrics, IJCB 2020,
IEEE International Joint Conference on Biometrics, IJCB online, Sep.28-Oct.1, 2020, pages 1–10. IEEE, 2020.
2020, online, Sep.28 - Oct.1, 2020, pages 1–10. IEEE, 2020. [25] K. Simonyan and A. Zisserman. Very deep convolutional
[10] A. George and S. Marcel. Deep pixel-wise binary supervi- networks for large-scale image recognition. In Y. Bengio and
sion for face presentation attack detection. In 2019 Interna- Y. LeCun, editors, 3rd International Conference on Learning
tional Conference on Biometrics, ICB 2019, Crete, Greece, Representations, ICLR 2015, San Diego, CA, USA, May 7-9,
June 4-7, 2019, pages 1–8. IEEE, 2019. 2015, Conference Track Proceedings, 2015.
[11] M. Gupta, V. Singh, A. Agarwal, M. Vatsa, and R. Singh. [26] H. Wang, Z. Wang, M. Du, F. Yang, Z. Zhang, S. Ding,
Generalized iris presentation attack detection algorithm un- P. Mardziel, and X. Hu. Score-cam: Score-weighted vi-
der cross-database settings. In 2020 IEEE ICPR, Milano sual explanations for convolutional neural networks. In 2020
Congress Center, Italy, 10-15, January 2021. IEEE, 2020. IEEE/CVF CVPR Workshops 2020, Seattle, WA, USA, June
14-19, 2020, pages 111–119. IEEE, 2020.
[12] P. Gupta, S. Behera, M. Vatsa, and R. Singh. On iris spoofing
[27] Z. Wei, X. Qiu, Z. Sun, and T. Tan. Counterfeit iris detection
using print attack. In 22nd International Conference on Pat-
based on texture analysis. In 19th ICPR, Dec. 8-11, 2008,
tern Recognition, ICPR 2014, Stockholm, Sweden, Aug. 24-
Florida, USA, pages 1–4. IEEE Computer Society, 2008.
28, 2014, pages 1681–1686. IEEE Computer Society, 2014.
[28] S. Woo, J. Park, J. Lee, and I. S. Kweon. CBAM: convo-
[13] K. He, X. Zhang, S. Ren, and J. Sun. Deep residual learning
lutional block attention module. In V. Ferrari, M. Hebert,
for image recognition. In IEEE CVPR, Las Vegas, USA, June
C. Sminchisescu, and Y. Weiss, editors, Computer Vision -
27-30, 2016, pages 770–778. IEEE Computer Society, 2016.
15 th ECCV 2018, Munich, Germany, September 8-14, 2018,
[14] G. Huang, Z. Liu, L. van der Maaten, and K. Q. Weinberger. Proceedings, Part VII, volume 11211 of Lecture Notes in
Densely connected convolutional networks. In 2017 IEEE Computer Science, pages 3–19. Springer, 2018.
CVPR 2017, Honolulu, HI, USA, July 21-26, 2017, pages
[29] D. Yadav, N. Kohli, A. Agarwal, M. Vatsa, R. Singh, and
2261–2269. IEEE Computer Society, 2017.
A. Noore. Fusion of handcrafted and deep learning features
[15] International Organization for Standardization. ISO/IEC DIS for large-scale multiple iris presentation attack detection. In
30107-3:2016: Information Technology – Biometric presen- 2018 IEEE CVPR Workshops, Salt Lake City, USA, June 18-
tation attack detection – P. 3: Testing and reporting, 2017. 22, 2018, pages 572–579. IEEE Computer Society, 2018.
[16] A. K. Jain, K. Nandakumar, and A. Ross. 50 years of bio- [30] D. Yadav, N. Kohli, J. S. D. Jr., R. Singh, M. Vatsa, and K. W.
metric research: Accomplishments, challenges, and oppor- Bowyer. Unraveling the effect of textured contact lenses on
tunities. Pattern Recognit. Lett., 79:80–105, 2016. iris recognition. IEEE TIFS, 9(5):851–862, 2014.
[17] J. S. D. Jr. and K. W. Bowyer. Robust detection of textured [31] D. Yadav, N. Kohli, M. Vatsa, R. Singh, and A. Noore. De-
contact lenses in iris recognition using BSIF. IEEE Access, tecting textured contact lens in uncontrolled environment us-
3:1672–1683, 2015. ing densepad. In IEEE CVPR Workshops 2019, Long Beach,
[18] J. S. D. Jr., K. W. Bowyer, and P. J. Flynn. Variation in USA, June 16-20, 2019, page 0. IEEE, 2019.
accuracy of textured contact lens detection based on sensor [32] D. Yambay, B. Becker, N. Kohli, D. Yadav, A. Czajka,
and lens pattern. In IEEE 6th BTAS, 2013, Arlington, VA, K. W. Bowyer, S. Schuckers, R. Singh, M. Vatsa, A. Noore,
USA, Sep.29-Oct. 2, 2013, pages 1–7. IEEE, 2013. D. Gragnaniello, C. Sansone, L. Verdoliva, L. He, Y. Ru,
[19] G. Y. Kimura, D. R. Lucio, A. S. B. Jr., and D. Menotti. H. Li, N. Liu, Z. Sun, and T. Tan. Livdet iris 2017 - iris
CNN hyperparameter tuning applied to iris liveness detec- liveness detection competition 2017. In IEEE IJCB, Denver,
tion. CoRR, abs/2003.00833, 2020. CO, USA, October 1-4, 2017, pages 733–741. IEEE, 2017.
[20] N. Kohli, D. Yadav, M. Vatsa, and R. Singh. Revisiting iris [33] H. Zhang, Z. Sun, and T. Tan. Contact lens detection based
recognition with color cosmetic contact lenses. In J. Fiérrez, on weighted LBP. In 20th ICPR 2010, Istanbul, Turkey, Au-
A. Kumar, M. Vatsa, R. N. J. Veldhuis, and J. Ortega-Garcia, gust 2010, pages 4279–4282. IEEE Computer Society, 2010.You can also read