Taking Over the Stock Market: Adversarial Perturbations Against Algorithmic Traders
←
→
Page content transcription
If your browser does not render page correctly, please read the page content below
Taking Over the Stock Market: Adversarial
      Perturbations Against Algorithmic Traders

     Elior Nehemya?[0000−0001−5363−3723] , Yael Mathov?[0000−0001−7004−1375] ,
     Asaf Shabtai[0000−0003−0630−4059] , and Yuval Elovici[0000−0002−9641−128X]

            Department of Software and Information Systems Engineering,
            Ben-Gurion University of the Negev, Beer-Sheva 8410501, Israel
                       {nehemya,yaelmath}@post.bgu.ac.il
                          {shabtaia,elovici}@bgu.ac.il

        Abstract. In recent years, machine learning has become prevalent in
        numerous tasks, including algorithmic trading. Stock market traders
        utilize machine learning models to predict the market’s behavior and
        execute an investment strategy accordingly. However, machine learning
        models have been shown to be susceptible to input manipulations called
        adversarial examples. Despite this risk, the trading domain remains largely
        unexplored in the context of adversarial learning. In this study, we present
        a realistic scenario in which an attacker influences algorithmic trading
        systems by using adversarial learning techniques to manipulate the input
        data stream in real time. The attacker creates a universal adversarial
        perturbation that is agnostic to the target model and time of use, which
        remains imperceptible when added to the input stream. We evaluate our
        attack on a real-world market data stream and target three different
        trading algorithms. We show that when added to the input stream, our
        perturbation can fool the trading algorithms at future unseen data points,
        in both white-box and black-box settings. Finally, we present various
        mitigation methods and discuss their limitations, which stem from the
        algorithmic trading domain. We believe that these findings should serve
        as a warning to the finance community regarding the threats in this
        area and promote further research on the risks associated with using
        automated learning models in the trading domain.

        Keywords: Adversarial examples, Algorithmic trading.

1     Introduction

In recent history, stock markets have been a significant vehicle for personal and
institutional investing. When buying or selling financial assets via the stock
exchange, traders gain or lose money based on changes in the assets’ value. To
maximize his/her profits, the trader needs to accurately predict changes in the
market. Yet, predicting the prices of financial assets is a challenging task, due to
the complex dynamics of the market’s behavior. To do so, a trader processes a vast
?
    Both authors contributed equally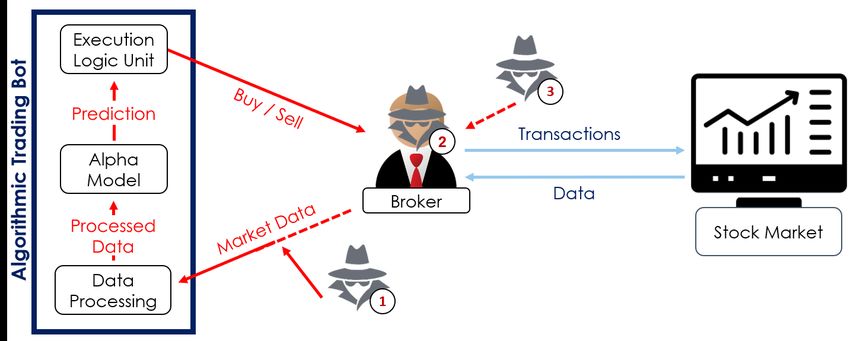
2       E. Nehemya et al.

amount of market data and uses it to try to predict the value of a specific stock.
Based on this prediction, the trader develops an investment strategy concerning
the stock, which results in one of the following actions: (1) selling the stock, (2)
buying more of the stock, or (3) holding his/her assets intact.
     To gain a possible advantage, traders use computers to analyze financial
market data quickly and execute trades automatically; known as algorithmic
trading (AT), this is the most common form of stock trading performed today [28].
Most AT systems use a similar process, consisting of three main steps: data
preprocessing, applying prediction model, and investment strategy execution.
The preprocessed data is used to predict the market’s behavior using a prediction
unit known as the alpha model, and based on this prediction, the best investment
strategy is chosen and executed. In the past, a set of predefined rules was used
to calculate the market predictions and choose the investment strategy [8], but
today, the popularity of machine learning is changing the picture. More traders
are relying on machine learning-based alpha models, such as support vector
machine (SVM) and artificial neural network (ANN) architectures [15], which can
automatically make multiple predictions in milliseconds based a large amount of
data; the edge they provide is especially useful in high-frequency trading (HFT).
However, since most of the methods used to choose the investment strategy are
still rule-based, the alpha model has become the heart of AT systems.
    In recent years, hackers have profited from the stock market by spreading
fake news [10] or published stolen sensitive information [9, 4] on companies as a
means of decreasing their stock price. Additionally, cyber attacks can be used to
compromise various players in the market to affect the market directly (e.g., by
hacking traders’ accounts and performing transactions on their behalf [20, 24]).
Since no one is safe from those threats [21], regulatory authorities fight them
by monitoring the stock market to identify fraudulent activity performed by
malicious or compromised entities. However, the nature of AT makes it challenging
to monitor and understand the bots’ behaviors, especially in HFT systems that
perform many transactions in a short period of time, making it difficult to identify
real-time changes in their operation. Therefore, changes regarding the behavior of
an AT bot can only be identified retrospectively, which may be too late. Moreover,
AT bots can use complex learning algorithms (i.e., ANNs), which remain a focus
of research due to their lack of explainability [14].
    Along with the potential cyber attacks and the monitoring challenges men-
tioned above, a new threat has emerged from the rapid technological improvements
seen in recent years: Machine learning models have been shown to be vulnerable to
adversarial inputs known as adversarial examples, which are maliciously modified
data samples that are designed so that they will be misclassified by the target
model [27]. This vulnerability threatens the reliability of machine learning models
and could potentially jeopardize sensitive applications, such as those used in the
trading domain. By exploiting the existence of adversarial examples, an attacker
can gain control of an AT bot’s alpha model and, as a result, influence the sys-
tem’s actions. Moreover, by gaining control of multiple AT systems, an attacker
could put the entire stock market at risk. Yet, adversarial perturbations in AT
Adversarial Perturbations Against Algorithmic Traders 3
are rare, mainly due to the data, which is extremely dynamic, unpredictable,
and heavily monitored by law enforcement agencies; thus, state-of-the-art attacks
successfully used in other domains may be ineffective in the trading realm. Unlike
images, where the features are pixels that can be easily perturbed, AT data is
extracted from a live stream of the stock market, with numeric features that
are inclined to change rapidly and sometimes in a chaotic manner. Additionally,
since AT alpha models use real-time data, crafting a perturbation for a specific
data point in advance is challenging. Due to the frequent changes in the data, by
the time the attacker has crafted the adversarial perturbation, the data may have
changed completely. Since the attacker cannot predict the market’s behavior,
he/she cannot craft a perturbation in real time.
In this study, we investigate the existence of adversarial perturbations in the
AT domain, taking all of the aforementioned challenges into account. We present
a realistic scenario where an attacker who manipulates the HFT data stream
can gain control of an AT bot’s actions in real time. To achieve this goal, we
present an algorithm that utilizes known market data to craft a targeted universal
adversarial perturbation (TUAP), which can fool the alpha model. The algorithm
is designed to create a small, imperceptible TUAP to avoid detection; the TUAP
created is agnostic to the target alpha model, as well as to the unseen data
samples to which it is added. Our method is evaluated using real-world stock data
and three different prediction models in both white-box and black-box settings.
We also demonstrate different mitigation methods against our attack and discuss
their limitations when used to protect AT systems. Our results suggest that the
risk of adversarial examples in the trading domain is significantly higher than
expected. Based on our review of the literature, it seems that adversarial learning
in the trading domain largely remains an unexplored field of research. Therefore,
we encourage both regulators and traders to address this concern and implement
the methods needed to reduce the risk caused by the use of vulnerable models
for algorithmic trading.
2 Background
2.1 Algorithmic Trading
Algorithmic trading refers to the use of computer programs that perform trading
transactions based on an analysis of the stock market. Both human and AT
system traders aim to maximize their profit by perfecting their ability to predict
a stock’s future price, use it to define an investment strategy, and perform bene-
ficial transactions [28]. Since an accurate prediction results in a more profitable
investment, the AT system maintains an alpha model that models the market’s
behavior. The system also has an execution logic unit which turns the prediction
into a transaction based on risk management policies. A popular type of AT is
HFT, where traders perform a large number of transactions in a short period of
time [28]. Since HFT requires split-second decisions, it relies solely on automated
software [5], and thus, we focus on this type of trading in this paper.4 E. Nehemya et al.
To predict the future stock price, the alpha model obtains data from an
online broker or other external sources. There are two main types of features
used for stock market prediction [15]: fundamental indicators and technical
indicators, which are used for fundamental and technical analysis, respectively.
Fundamental analysis focuses on macro factors that might correlate with the
stock’s price, such as financial records, economic reports, and balance sheets.
Conversely, technical analysis assumes that all of the relevant information is
factored into the stock’s price. More than 80% of alpha models use technical
indicators as input features [15]. Since the AT system’s decisions are based on the
market prediction, traders are constantly seeking new methods to improve their
alpha models. In the past, traders made predictions by manually building trading
strategies based on known patterns in the market data stream [8]. However,
increases in computational capabilities caused traders to switch to sophisticated
statistical methods, which were later replaced by machine learning-based alpha
models that were shown to better estimate the market’s behavior. The emergence
of the big data era introduced new models, and traders requiring rapid analysis
of the massive amount of market data began to use ANNs [11], such as deep
neural networks (DNNs) [1, 7], and recurrent neural networks (RNNs) [6, 23].
2.2 Adversarial Learning
The term adversarial example was first used in [27] to describe a well-crafted
perturbation added to an input sample that fools a target DNN. Crafting an
adversarial example is done by adding an imperceptible perturbation to an input
sample, resulting in misclassification by the model. Additionally, adversarial
perturbations can fool other models, even those trained on different training
sets, which is known as the transferability property of adversarial examples [27].
Those findings caused the research community to delve deeper in order to better
understand this vulnerability and develop new methods for crafting adversarial
perturbations [13, 16]. To use adversarial examples in more realistic scenarios,
some studies utilized the transferability property to perform an attack in black-box
settings. The attacker creates adversarial examples for a surrogate model and then
transfers them to the target model, which he/she knows little about. Initially,
adversarial perturbations were crafted based on a specific data sample; this
changed when the universal adversarial perturbation (UAP) was presented [19].
The UAP is a single perturbation that can fool a learning model when added
to both the samples in the training set and unseen data samples and is also
transferable to other neural networks. Since this method allows an attacker to
craft one perturbation and use it against unseen samples, it can be used in
domains where the data is unknown (e.g., AT).
Initial research targeted images, but recent studies have expanded to other
domains, yet the AT domain remained unexplored. While the simple attacks
targeting AT presented in [2] can easily be identified by regulation authorities,
they demonstrate how AT increases volatility in the market. Therefore, it is
reasonable to suspect that adversarial examples could be used in the trading
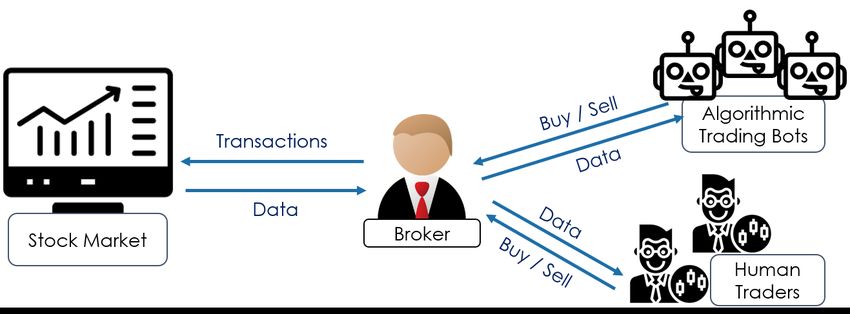
domain since it increasingly relies on machine learning models. An adversarialAdversarial Perturbations Against Algorithmic Traders 5 Fig. 1. A simplified illustration of the HFT ecosystem. All traders (humans and AT bots) collect market data and send transaction requests to the broker. The broker executes the transaction and sends the market data to the trader. learning-based attack was demonstrated with a UAP that was used to identify transactions that manipulate the limit order book data and, as a result, cause the target AT bot to change its behavior [12]. However, this method is limited to stocks with low trading volume because by the time the attacker finalizes the transactions, the limit order book can completely change, which can make the malicious transactions less effective or not effective at all. 3 Problem Description 3.1 Trading Setup We assume the simplified HFT environment presented in Fig. 1, with the following entities: a broker, traders (humans or AT bots), and the stock market. Stock market transactions are limited to trusted members only, which may limit the traders’ ability to exchange assets in the market [25]. Therefore, a broker is a trusted entity that connects traders and the stock market by receiving and executing buy and sell requests on behalf of the traders. Each transaction changes the market’s supply and demand, thus affecting the stock price. Information about the market changes, including changes in stock prices, is sent to the traders via the broker. However, data anomalies are common in HFT due to software bugs, errors in transaction requests, environmental conditions, and more [18]. Thus, some AT systems embed anomaly detection filters during preprocessing and ignore abnormal changes in the data. In this work, we focus on discount brokers who play a major role in HFT by providing online trading platforms to encourage frequent trade execution. The target AT system receives data from the broker, in the form of one-minute intraday stock prices, and processes and feeds it to a machine learning-based alpha model, which tries to predict whether the stock price will increase or decrease. Based on the prediction, the AT system chooses an investment strategy and performs the corresponding action.
6       E. Nehemya et al.

Fig. 2. An illustration of the attack flow. The attacker can be one of the following:
(1) A cyber attacker that targets a specific AT bot, (2) a malicious broker, or (3) a
compromised broker. While (1) manipulates just the data feed for one AT bot, (2) and
(3) perturb the data to all traders that collect data from the broker.

3.2   Threat Model
Since fraudulent behavior or cyber crimes performed by any entity in the stock
market can result in significant financial gain [21], we can assume that even a
broker cannot be trusted. Therefore, we consider the three threat models shown
in Fig. 2: a cyber attacker performs a man-in-the-middle attack on the data
stream sent from the broker to the bot and gains control of the data sent to the
alpha model; a malicious broker manipulates the data he/she sends to the traders
to personally benefit from the effects of the perturbed data on the traders; and a
compromised broker unknowingly sends the traders data that was manipulated by
an attacker. In all cases, the attacker’s goal is to profit financially or personally by
sabotaging one or more AT systems. We assume that the attacker can manipulate
the market stream and send it to the AT system, which uses the data as an input.
Additionally, the attacker is aware of the existence of regulatory monitoring
and the possibility that an anomaly detector might be used to filter significant
changes in the data, and wants to bypass both by performing minor changes in
the data stream. We start by assuming that the attacker has complete knowledge
of the target model, and later this assumption will be dropped. Since the three
threat models share similar characteristics, we examine our solution under a
single scenario in which the attacker can manipulate the input to the AT system
in real time.

4     Proposed Attack
As illustrated in Fig. 2, the attacker wants to perturb the market data stream
to fool the alpha model and control the AT system’s behavior. However, the
trading domain introduces new challenges that need to be addressed to build a
realistic attack against AT systems. First, stock market data rapidly changes over
time, and by the time the attacker crafts the perturbation, it may be no longer
Adversarial Perturbations Against Algorithmic Traders        7

relevant since the prices have likely changed. Second, the attacker does not know
the true label ahead of time, and perturbing the data might create an undesired
outcome; if at a specific time both the target and true labels are ‘increase,’ adding
a perturbation might cause the undesired effect in which the sample is classified
as ‘decrease.’ To address those challenges, we suggest a targeted version of a
UAP [19]. Since the perturbation is effective when added to unseen data, the
attacker can craft one TUAP in advance and apply it to the data stream in real
time. We craft the TUAP using past data samples with equal representation
of all classes to ensure that input samples that were originally classified as the
target class will output the same result after applying the TUAP.
    We define f to be the AT system’s alpha model, which receives a snapshot x
of a stock’s price for a period of k minutes and outputs an estimation f (x) for
the price behavior in the next few minutes (‘increase’ or ‘decrease’). For a set of
snapshots of stock prices X, a target label y, and an alpha model f , the attacker
aims to craft a TUAP v, such that the number of x ∈ X, where f (x + v) = y,
is maximal. Therefore, we define a successful attack using the targeted fooling
rate (TFR): the percentage of x ∈ X such that f (x + v) = y. To maintain the
imperceptibility and make the TUAP look like a normal price fluctuation, the
size of v, kvk2 , should be minimal. Thus, the attacker chooses two thresholds
that determine the attack’s requirements: δ denotes the minimal TFR value for
f (x + v) with regard to y, while  defines the maximal perturbation size.
    To craft the TUAP, Algorithm 1 receives a set of data points X, a target
label y, a classifier f , a minimal TFR δ threshold, and a maximal perturbation
size , and iteratively crafts a TUAP v such that T F R(f (X + v), y) ≥ δ and
kvk2 ≤ . Thus, the TUAP is smaller than , yet it fools f for at least δ% of
X. To calculate the TUAP, we initialize v to a zero vector (line 1) and split
X into batches to improve the convergence time of the optimization process.
Next, we iteratively calculate TUAP v by checking each batch XB in X, and if
T F R(f (XB + v), y) ≥ δ (line 4), we update v as follows: First, we compute a
perturbation vi with minimal size and maximal TFR (line 5) using a modified
version of projected gradient descent [16], which we chose due to its simplicity,
short runtime, and reliable results. Then, to update v (line 6), we use Projection
to project v + vi into an epsilon ball under the L2 distance; thus ensuring that
kvk2 ≤ . If the algorithm finds a TUAP where T F R(f (X + v), y) ≥ δ (line 9),
then it returns v. Otherwise, the loop ends after E iterations without finding a
result, and the attacker should consider changing the constraints (i.e., δ or ).

5     Evaluation Setup
5.1   Dataset
We use real intraday market data from the S&P 500 index from Kaggle [22].
For each stock, the dataset contains the open-high-low-close data at one-minute
intervals between 11/9/2017-16/2/2018. We define an input sample as a stream
of 25 continuous one-minute records, where each record consists of the opening
price, high price, low price, closing price, and the traded stock volume at the end
8 E. Nehemya et al.
Algorithm 1: Crafting a targeted universal adversarial perturbation.
input : Dataset X, target class y, alpha model f , maximal perturbation size ,
minimal expected TFR δ, and maximal number of iterations E.
output : A targeted universal adversarial perturbation v.
initialize v ← 0
for k = 1 up to E do
foreach batch XB in X do
if T F R(f (XB + v), y) < δ then
vi ← arg minr krk2 s.t. T F R(f (XB + v + r), y) ≥ δ
v ← P rojection(v + vi , )
if T F R(f (X + v), y) ≥ δ then
return v
of the minute. The dataset is divided into a set for training the alpha models,
a set for crafting TUAPs, and six test sets to evaluate the attack. The data
between 11/9/2017-1/1/2018 is used to train the alpha models. To craft the
TUAPs, 40 samples are uniformly sampled from each of the three trading days
between 2/1/2018-4/1/2018 (a total of 120 samples). The data between 5/1/2018-
15/2/2018 (five trading days per week) are used to create six test sets: T1 , ..., T6 .
For each week, we build a corresponding test set by uniformly sampling 100
samples that represent an increase of the stock price and an additional 100 that
represent a decrease of the stock price. For 1 ≤ i ≤ 6, Ti denotes the test set of
the i’th week (i.e., we use the first week for T1 , etc.). This sampling method helps
to ensure that imbalances in the data do not influence our evaluation process.
5.2 Feature Extraction
Before feeding the input into the models, we perform preprocessing on the raw
data based on [1]. However, while [1] only uses the closing price of each minute, we
aggregate five groups of five consecutive minutes, and for each group, we extract
the following features: the trend’s indicator, standard deviation of the price, and
average price. The trend indicator is set to be the linear coefficient among the
closing prices of five consecutive minutes. The features extracted from the sliding
window of 25 minutes of the raw data are used to build one input sample for
our alpha model. Each sample is a vector of the following features: the last five
pseudo-log returns, the last five standard deviations of price, the last five trend
indicators, the last minute, and the last hour. The pseudo-log return is calculated
based on the average price of each five-minute group AV Gp1 , ..., AV Gp5 and
AV Gpi
defined as log( AV Gpi−1 ). Thus, the preprocessing takes a sliding window of 25
minutes of the raw data and creates an input sample with 17 features.Adversarial Perturbations Against Algorithmic Traders 9 5.3 Models We use TensorFlow and Keras to implement three supervised alpha models which, for each processed sample, predict the stock’s price movement at the end of the next five minutes. The models differ in terms of their architecture: The DNN is a deep neural network with five hidden dense layers and a softmax layer; the CNN has a 1D convolution layer, two dense layers, and a softmax layer; and the RNN has two LSTM layers, a dense layer, and a softmax layer. Since a model with high directional accuracy (DA) allows the user to develop a profitable investment strategy, the models are trained on the same data to maximize the DA. The models achieve 66.6%-67.2% and 65.6%-68.3% DA on the training and test sets respectively, promising results when compared to the results of other HFT alpha models [11, 1, 6]. Since the models perform binary classification, a DA above 50% can be used to build a profitable trading strategy. 5.4 Evaluation For simplicity, we create TUAPs that force the three alpha models to predict that the stock price will increase. For each model, we evaluate the TUAPs’ performance using the six test sets (T1 − T6 ) with the following measurements: targeted fooling rate (TFR), untargeted fooling rate (UFR), and perturbation size. The TFR denotes the percentage of input samples that are classified as the target label and reflects the attacker’s ability to control the AT system’s decision regardless of the stock’s state. Although technical analysis is common in HFT, to the best of our knowledge, there are no known attacks against HFT AT systems that use technical indicators. Therefore, to demonstrate the attack’s added value, we compare the attack to random perturbations of the same size. However, measuring random perturbations with the TFR fails to reflect the unwanted prediction flips caused by random noise. Thus, we measure the UFR of the perturbations, which is defined as the percentage of input samples that are misclassified. It is important to note that the goal of the TUAP is to cause all samples to be classified as the adversary’s target, regardless of the true label. Therefore, a successful attack is measured with TFR, while UFR measures the randomness effect of the perturbation on the prediction result. The perturbation size is the average percentage of change in the stock’s closing price, ensuring that the perturbation remains undetected for each stock. A TUAP of a dollar size is small for a stock that is $2000 a share, yet dramatic for a penny stock. The relative size is also helpful for comparing the effects of different perturbations on different stocks. Therefore, in this study, all of the perturbations are relative to the target stock price: 0.02% of the price. Our code is available at https://github.com/nehemya/Algo-Trade-Adversarial-Examples 6 White-Box Attack In this experiment, we examine five stocks: Google (GOOG), Amazon (AMZN), BlackRock (BLK), IBM, and Apple (AAPL). For each stock, we use Algorithm
10      E. Nehemya et al.

          (a) DNN                      (b) CNN                      (c) RNN

Fig. 3. The mean TFR (percentage) of five stocks for the TUAP, random perturbation,
and clean data. The TFR is presented for each of the six test sets and the three models.

1 to craft three TUAPs, one for each alpha model, and randomly sample three
perturbations that are the same size as the TUAPs (i.e., 0.02% of the stock’s
price). Then, we evaluate the attack performance on the six test sets T1 −T6 . Since
the perturbations are trained on data from one point in time and evaluated on six
unknown test sets from later periods of time, we expect that the performance of
the TUAPs will gradually degrade as we move away in time from the time period
of the training set; hence, the TUAP will achieve the highest TFR and UFR
for T1 , and the lowest for T6 . Nevertheless, the random perturbations are not
expected to show any predictable behavior, and their effect on the classification
result will not correlate to the time that has elapsed from the training set time.
    We examine the TFR for the TUAP and random perturbation for each of the
three alpha models and compare them to the clean (original) results. As shown
in Fig. 3, the random noise does not have a major impact on any of the models
On average, the random perturbations cause changes in the TFR that do not
exceed 2%, and thus the alpha models’ prediction is not largely affected by them.
However, the TUAP creates dramatic changes in all alpha models’ classification
results, and the average TFR scores obtained by the TUAP are greater than
92%. The results support the hypothesis that the attacker can use the TUAP to
control the alpha model’s prediction. To improve our understanding of the effect
of the random perturbation, we also examine the UFR (see Fig. 4). The results
suggest that the TUAP causes a higher UFR than the random perturbation.
However, Fig. 3 suggests that the classification flips caused by the TUAP are the
result of input samples that have been pushed to be classified as the target label.
Such effects are not demonstrated by the random perturbation.
    As expected, while the effects of the random perturbations do not follow a
certain pattern, the TUAP’s TFR is highest for the earlier test sets (e.g., T1 )
and gradually decreases for the later test sets. However, an exception is found
for T5 , which represents data of 2/2/2018-8/2/2018 and demonstrates poorer
performance than any other test set, including the later test set T6 . This exception
may stem from several massive drops in the market that occurred during this
time period [17, 26]. Although our datasets are balanced, each sample is based on
25 minutes of market data which reflect the drop in the market. Thus, fooling an
Adversarial Perturbations Against Algorithmic Traders 11
(a) DNN (b) CNN (c) RNN
Fig. 4. The mean UFR (percentage) of five stocks for the TUAP and random perturba-
tion. The UFR is presented for each of the six test sets and the three models.
alpha model to predict an increase in a stock value in this week is a challenging
task for a TUAP trained on normal market data.
Additionally, due to the heavy monitoring of the stock market, an attacker
should consider the TUAP’s size: a larger perturbation is more likely to fool
the alpha model, but also has a higher risk of being detected. Therefore, we
examine how the perturbation size affects the fooling rate. Since we can achieve
a high TFR by using TUAPs with a small size relative to the stock’s price (i.e.,
0.02%), we now examine the attack’s effect on stocks in different price ranges,
thus inspecting perturbations from similar absolute sizes (i.e., the number of
dollars). To do so, we define three price categories and randomly choose five
stocks from each category:
– High ($900+): GOOG, GOOGL, AMZN, ISRG, and PCLN.
– Medium ($400 − $650): BLK, REGN, EQIX, AZO, and MTD.
– Low ($100 − $200): ADP, UPS, IBM, AAPL, and AON.
As shown in Table 1, the TUAPs fool the alpha models for stock data from
all price categories examined, with a TFR greater than 89.5%. While the relative
perturbation size is similar, the TUAPs affected each category differently; the
effect on low-priced stocks is the greatest, but the medium-priced stocks are
less affected by the attack. The results regarding the untargeted fooling rate
support the findings from our previous experiment. We note that we examine
the low-priced stocks in data from the S&P 500 index, which contains only large
companies. Since the results indicate that targeting the low-priced stocks is the
safer option for the attacker, we believe that future work should examine stocks
with a price lower than 100$.
7 Black-Box Attack
Assuming the attacker has full knowledge of the target system is unrealistic in
the real world, where traders conceal this information. Therefore, we evaluate the
attack under black-box settings, where the attacker only has access to the model’s
input. Since the attacker can manipulate the market stream, he/she can utilize12 E. Nehemya et al.
Stock Price Average Average Clean TFR UFR UFR
Category Stock Price TUAP Size DA TUAP TUAP Random
High $1100 $0.266 66.65 91.35 41.41 15.64
Medium $545 $0.152 68.01 89.55 39.58 15.96
Low $141 $0.036 67.26 93.93 43.93 18.08
Table 1. Comparison of the TUAP and random perturbation effect on stocks at three
price levels, including the average stock price and average absolute perturbation price.
Each category is evaluated using the directional accuracy on clean data, the TFR and
UFR on data with the TUAP, and the UFR on data with the random perturbation.
Target DNN CNN RNN Size Target DNN CNN RNN Size
DNN - 95.04 95.00 0.027 DNN - 93.7 93.66 0.024
Source
Source
CNN 94.45 - 94.75 0.028 CNN 93.16 - 93.41 0.022
RNN 94.25 95.00 - 0.026 RNN 93.95 94.62 - 0.024
(a) IBM (b) AAPL
Table 2. The transferability (TFR) of the TUAP between the three alpha models on
(a) IBM and (b) Apple data. The rows are the source (surrogate) models, the columns
define the target (unknown) model, and the size denotes the relative TUAP size.
the TUAP’s transferability property to attack AT systems with an unknown alpha
model architecture. Thus, the broker sends compromised market data targeting
one AT system, which could affect other bots and, in turn, potentially influence
the entire market. Since traders are protective of their AT systems’ architecture,
there is a lack of open-source AT implementations, and thus inexperienced traders
often use alpha models with similar architecture; this increases the risk of a
transferable perturbation.
In this experiment, we craft a TUAP for each alpha model and transfer it to
the other two models. The results in Table 2 show that all of the TUAPs are highly
transferable and sometimes achieved a TFR similar to that of the attacked model.
This likely stems from the models’ preprocessing; although the alpha models have
different learning model architectures, they share the same code and vulnerability.
However, our results indicate that an attack from a malicious or compromised
broker targeting a popular open-source AT system implementation could affect
other bots using that software. The presence of multiple compromised AT systems
could cause a misrepresentation of the market’s supply and demand, which might
affect the behavior of AT systems that do not share that vulnerability.
8 Mitigation
While technology is advancing at a rapid pace, government regulation and
enforcement systems are largely unaware of the risks that such advancementAdversarial Perturbations Against Algorithmic Traders 13
poses (e.g., the threat of adversarial examples). Unlike known cyber attacks on
the stock market, which perform notable transactions (e.g., hack, pump and
dump [20]), our attack performs small perturbations that can be considered a
common error in the data. Combining an imperceptible attack and the lack of
knowledge about this threat allows attackers to exploit the market with minimal
risk. Therefore, we call on the finance community to raise awareness of the risks
associated with using machine learning models in AT. Since the traders using the
AT systems will be the first entity to suffer from our attack, we examine several
mitigation methods that can be used to protect AT bots. In this section, we
assume that the TUAP, its training set, and the percentage of perturbed samples
in the test sets are known to the defender, and the attacker cannot tweak the
attack to bypass the defense, as shown in various domains [3]. Although it is an
unrealistic assumption that gives a significant edge to the defender, it allows us
to discuss the challenges of protecting against adversarial perturbations in AT.
A common mitigation approach involves the use of a detector to identify
perturbed data and filter it out. Due to the defender’s unrealistic advantage, we
can use the TUAP to build two simple classifiers, with k-nearest neighbors (kNN)
and ANN architectures, to identify perturbed data. We trained the detectors
on the same training set used to craft the TUAP, but added the perturbation
to 10% of the data. Then, we created T10 , ..., T60 test sets, such that Ti0 is a
combination of 10% perturbed data (i.e., Ti ) and 90% benign data that was
sampled from ith week. Fig. 5 shows that while the kNN detector failed to detect
the perturbed data, the ANN detector identified more samples but obtained a
high false positive rate, which makes it unreliable. A possible explanation for
the results is that identifying adversarial perturbations requires the detector to
model and predict the normal behavior of the market, a challenging task that the
entire AT system tries to perform. Moreover, the performance of both detectors
decreases as time passes; thus, the defender will have to retrain a new detector
every few weeks. This is not feasible since in real life the defender would have to
build the detector for unseen TUAPs without knowing their distribution in the
market data. Additionally, a complex detector adds computational overhead to
the AT system, which can make it irrelevant in HFT. Therefore, some traders
might prefer to risk being attacked in order to maintain an effective AT system.
An alternative approach is to train the model to correctly classifying both
benign and perturbed data samples, which can be achieved by performing ad-
versarial retraining [13]: After training the alpha model, the defender creates
perturbed data, which is labeled as the benign samples and then used to retrain
the model. By doing so, the defender avoids the computational overhead asso-
ciated with an additional component to the AT system. We used the attack’s
TUAP to perform adversarial retraining on the alpha model. As shown in Fig. 6,
the alpha model loses its ability to predict the market when the percentage of
adversarial examples used for retraining increases. When adversarial examples
are 40% of the retraining data, the TFR decreases from more than 90% to around
70%, and the directional accuracy drops from almost 70% to less than 60%, which
indicates that the defense reduces the alpha model’s ability to learn from the14 E. Nehemya et al.
(a) kNN (b) ANN
Fig. 5. The precision (blue) and recall (orange) of supervised detectors trained on the
TUAP training set, with 10% perturbed data: (a) kNN and (b) neural networks.
(a) TUAP (TFR) (b) Clean Data (DA)
Fig. 6. The effects of adversarial retraining for different portions of adversarial examples
in the retraining set on (a) the perturbed evaluation sets (TFR), and (b) on the model’s
ability to predict the market for clean data (DA).
training set. Therefore, improving the model’s robustness to adversarial examples
is unsuitable for this domain.
Finally, we suggest a simple solution in which the trader collects the market
data from several brokers, compares it and filters out mismatches. While the
solution is trivial, it might be expensive for an individual trader who must pay
multiple brokers for the market data. Additionally, in HFT, the data might
contain inaccuracies due to technical issues or mismatches due to time differences
between brokers operating around the world. As a result, traders may prefer to
risk an attack over losing money or decreasing the AT system’s performance.
However, regulatory authorities are not limited by the challenges discussed.
They can perform offline analysis, compare the data from many brokers, and
utilize complex detectors. Even if those methods are not used routinely, they
can be applied when unexplained abnormal behavior is seen in the market.
Although securing the stock market may be challenging and no comprehensive
solution currently exists, the war may already have begun, and efforts to defendAdversarial Perturbations Against Algorithmic Traders 15
against adversarial examples should start with increasing the finance community’s
awareness of the risks of using learning models in the stock market.
9 Conclusions
In this study, we demonstrate how adding a TUAP to the market data stream
in real time, allows an attacker to influence the alpha model’s predictions, thus
controlling the entire AT system. Our results show that HFT systems are highly
susceptible to adversarial inputs. The use of a TUAP ensures that the attack can
be performed in real life, where attackers cannot predict the market’s behavior.
Adversarial perturbations are much stealthier than known manipulations against
the stock market. Since the size of our TUAPs is 0.02% of the stock price, the
attack might not be flagged as such by monitoring systems and instead be viewed
as a common error in the data. Our experiments also showed that TUAPs are
transferable to different AT systems and that a perturbation targeting one alpha
model can also fool another model. Since the manipulated data in this study is
sent by the broker, a TUAP added to the market data can change the behavior
of multiple AT bots, and their actions may start a cascade effect, influencing
other invulnerable systems and possibly the entire market. Given the lack of
diversity in open-source bot implementations online, inexperienced traders often
use alpha models with similar architecture, a situation in which transferable
perturbations can increase the potential damage, as shown in our study. Finally,
we demonstrated potential mitigation methods against adversarial perturbations
and discussed the concerning findings. Since many regulatory authorities and
traders are unfamiliar with adversarial perturbation, we strongly suggest that
the finance community examine this risk and take the steps required to protect
financial markets from such threats.
References
1. Arévalo, A., Niño, J., Hernández, G., Sandoval, J.: High-frequency trading strategy
based on deep neural networks. In: International conference on intelligent computing.
pp. 424–436. Springer (2016)
2. Arnoldi, J.: Computer algorithms, market manipulation and the institutionalization
of high frequency trading. Theory, Culture & Society 33(1), 29–52 (2016)
3. Athalye, A., Carlini, N., Wagner, D.: Obfuscated gradients give a false sense
of security: Circumventing defenses to adversarial examples. In: International
Conference on Machine Learning. pp. 274–283. PMLR (2018)
4. Bianchi, D., Tosun, O.K.: Cyber attacks and stock market activity. SSRN (2019)
5. Bigiotti, A., Navarra, A.: Optimizing automated trading systems. In: The 2018
International Conference on Digital Science. pp. 254–261. Springer (2018)
6. Chen, G., Chen, Y., Fushimi, T.: Application of deep learning to algorithmic trading.
Stanford, https://stanford.io/3dllsMC. Last accessed Jun 2021
7. Chong, E., Han, C., Park, F.C.: Deep learning networks for stock market analysis
and prediction: Methodology, data representations, and case studies. Expert Systems
with Applications 83, 187–205 (2017)16 E. Nehemya et al.
8. Coutts, J.A., Cheung, K.C.: Trading rules and stock returns: Some preliminary
short run evidence from the Hang Seng 1985-1997. Applied Financial Economics
10(6), 579–586 (2000)
9. Domm, P.: False rumor of explosion at white house causes stocks to briefly plunge.
CNBC (2013), https://cnb.cx/35SVKKU. Last accessed Jun 2021
10. Fisher, M.: Syrian hackers claim AP hack that tipped stock market by $136 billion.
Is it terrorism?. Washington Post 23 (2013)
11. Giacomel, F., Galante, R., Pereira, A.: An algorithmic trading agent based on a
neural network ensemble: A case of study in North American and Brazilian stock
markets. In: 2015 IEEE/WIC/ACM International Conference on Web Intelligence
and Intelligent Agent Technology (WI-IAT). Vol. 2, pp. 230–233. IEEE (2015)
12. Goldblum, M., Schwarzschild, A., Cohen, N., Balch, T., Patel, A.B., Goldstein,
T.: Adversarial attacks on machine learning systems for high-frequency trading.
arXiv:2002.09565 (2020)
13. Goodfellow, I.J., Shlens, J., Szegedy, C.: Explaining and harnessing adversarial
examples. arXiv:1412.6572 (2014)
14. Gunning, D.: Explainable artificial intelligence (xai). Defense Advanced Research
Projects Agency (DARPA), nd Web 2, 2 (2017)
15. Kumar, G., Jain, S., Singh, U.P.: Stock market forecasting using computational
intelligence: A survey. Archives of Computational Methods in Engineering pp. 1–33
(2020)
16. Madry, A., Makelov, A., Schmidt, L., Tsipras, D., Vladu, A.: Towards deep learning
models resistant to adversarial attacks. arXiv:1706.06083 (2017)
17. Matt, E.: February was an insane month for the stock market. CNN (2018),
https://cnn.it/3j8Q7Ah. Last accessed Jun 2021
18. Mitchell, C.: Erroneous trade. Investopedia (2021), https://bit.ly/2SxaU5C. Last
accessed Jun 2021
19. Moosavi-Dezfooli, S.M., Fawzi, A., Fawzi, O., Frossard, P.: Universal adversarial
perturbations. In: Proceedings of the IEEE conference on computer vision and
pattern recognition. pp. 1765–1773 (2017)
20. Nakashima, E.: Hack, pump and dump. The Washington Post (2007), https://wapo.
st/3vSsIWs. Last accessed Jun 2021
21. Neyret, A.: Stock market cybercrime. Autorité des Marchés Financiers (2020),
https://bit.ly/3xPE0wg. Last accessed Jun 2021
22. Nickdl: S&P 500 intraday data. Kaggle (2018), https://bit.ly/3gRJgJV. Last ac-
cessed Jun 2021
23. Pang, X., Zhou, Y., Wang, P., Lin, W., Chang, V.: An innovative neural network
approach for stock market prediction. The Journal of Supercomputing 76(3), 2098–
2118 (2020)
24. Rooney, K., Khorram, Y.: Hackers look to buy brokerage log-ins on the dark web
with Robinhood fetching highest prices. CNBC (2020), https://cnb.cx/3zX9an1.
Last accessed Jun 2021
25. Smith, T.: Broker. Investopedia (2020), https://bit.ly/2SVpWCC. Last accessed
Jun 2021
26. Stacey, B.C., Bar-Yam, Y.: The stock market has grown unstable since February
2018. arXiv:1806.00529 (2018)
27. Szegedy, C., Zaremba, W., Sutskever, I., Bruna, J., Erhan, D., Goodfellow, I.,
Fergus, R.: Intriguing properties of neural networks. arXiv:1312.6199 (2013)
28. Treleaven, P., Galas, M., Lalchand, V.: Algorithmic trading review. Communications
of the ACM 56(11), 76–85 (2013)You can also read


