K +Λ photoproduction at forward angles and low momentum transfer
←
→
Page content transcription
If your browser does not render page correctly, please read the page content below
EPJ manuscript No.
                                          (will be inserted by the editor)

                                          K +Λ photoproduction at forward angles and low momentum
                                          transfer
                                          S. Alef1 , P. Bauer1 , D. Bayadilov2,3 , R. Beck2 , A. Bella1,a , J. Bieling2,a , A. Braghieri4 , P.L. Cole5 , D. Elsner1 ,
                                          R. Di Salvo6 , A. Fantini6,7 , O. Freyermuth1 , F. Frommberger1 , F. Ghio8,9 , S. Goertz1 , A. Gridnev3 , D. Hammann1,a ,
                                          J. Hannappel1,b , T.C. Jude1,c , K. Kohl1 , N. Kozlenko3 , A. Lapik10 , P. Levi Sandri11 , V. Lisin10 , G. Mandaglio12,13 ,
                                          F. Messi1,a , R. Messi6,7 , D. Moricciani11 , V. Nedorezov10 , V.A Nikonov2,3,d , D. Novinskiy3 , P. Pedroni4 ,
                                          A. Polonskiy10 , B.-E. Reitz1,a , M. Romaniuk6,14 , A.V Sarantsev2,3 , G. Scheluchin1 , H. Schmieden1 , A. Stuglev3 ,
                                          V. Sumachev3,d , V. Vegna1,a , V. Tarakanov3 , and T. Zimmermann1,a
arXiv:2006.12350v3 [nucl-ex] 1 Mar 2021

                                           1
                                               Rheinische Friedrich-Wilhelms-Universität Bonn, Physikalisches Institut, Nußallee 12, 53115 Bonn, Germany
                                           2
                                               Rheinische Friedrich-Wilhelms-Universität Bonn, Helmholtz-Institut für Strahlen- und Kernphysik, Nußallee 14-16, 53115
                                               Bonn, Germany
                                           3
                                               Petersburg Nuclear Physics Institute, Gatchina, Leningrad District, 188300, Russia
                                           4
                                               INFN sezione di Pavia, Via Agostino Bassi, 6 - 27100 Pavia, Italy
                                           5
                                               Lamar University, Department of Physics, Beaumont, Texas, 77710, USA
                                           6
                                               INFN Roma “Tor Vergata”, Via della Ricerca Scientifica 1, 00133, Rome, Italy
                                           7
                                               Università di Roma “Tor Vergata”, Dipartimento di Fisica, Via della Ricerca Scientifica 1, 00133, Rome, Italy
                                           8
                                               INFN sezione di Roma La Sapienza, P.le Aldo Moro 2, 00185, Rome, Italy
                                           9
                                               Istituto Superiore di Sanità, Viale Regina Elena 299, 00161, Rome, Italy
                                          10
                                               Russian Academy of Sciences Institute for Nuclear Research, Prospekt 60-letiya Oktyabrya 7a, 117312, Moscow, Russia
                                          11
                                               INFN - Laboratori Nazionali di Frascati, Via E. Fermi 54, 00044, Frascati, Italy
                                          12
                                               INFN sezione Catania, 95129, Catania, Italy
                                          13
                                               Università degli Studi di Messina, Dipartimento MIFT, Via F. S. D’Alcontres 31, 98166, Messina, Italy
                                          14
                                               Institute for Nuclear Research of NASU, 03028, Kyiv, Ukraine

                                                      Received: date / Revised version: date

                                                      Abstract. γp → K + Λ differential cross sections and recoil polarisation data from threshold for extremely
                                                      forward angles are presented. The measurements were performed at the BGOOD experiment at ELSA,
                                                      utilising the high angular and momentum resolution forward spectrometer for charged particle identifica-
                                                      tion. The high statistics and forward angle acceptance enables the extraction of the cross section as the
                                                      minimum momentum transfer to the recoiling hyperon is approached.

                                                      PACS. 13.60.Le Photoproduction of mesons 25.20.-x Photonuclear reactions

                                          1 Introduction                                              properties and new resonance discoveries1 . A main moti-
                                                                                                      vation of the study of KY photoproduction channels over
                                                                                                      the last 15 years has been to search for these “missing
                                          Associated strangeness (KY ) photoproduction is a crucial resonances” which may only couple weakly to N π final
                                          area of study to elucidate the nucleon excitation spec- states [11, 12]. The ensuring wealth of high statistics data
                                          trum and the relevant degrees of freedom. There remain from the Crystal Ball @ MAMI [13], CLAS [14,15, 16, 17,
                                          many resonances predicted by constituent quark models 18, 19], SAPHIR [20], LEPS [21, 22] and GRAAL [23] col-
                                          (CQMs) [1, 2, 3, 4], lattice QCD calculations [5], harmonic laborations have rendered the KY channels the closest to
                                          oscillator and hypercentral CQMs [6, 7] and Dyson-Schwingera “complete experiment”, where a judiciously selected set
                                          equations of QCD [8] that have not been observed exper- of polarisation observables permit a complete description
                                          imentally. Significant advancements however have been of the photoproduction mechanism [24]. This is partly due
                                          made, both in the understanding of known resonances to the weak, self analysing decay of the Λ enabling easier
                                                                                                      access to the recoiling baryon (single and double) polar-
                                            a                                                         isation observables. Despite this data and support from
                                               No longer employed in academia
                                           b                                                                  1
                                               Currently, DESY Research Centre, Hamburg, Germany                The Particle Data Group, for example, recognised 10 four
                                           c
                                               Corresponding author: jude@physik.uni-bonn.de                star and 3 three star N ∗ resonances above ground state in
                                           d
                                               Deceased                                                     2010, compared to 13 and 7 in 2020 [9, 10].
2 S. Alef et al.: K + Λ photoproduction at forward angles and low momentum transfer
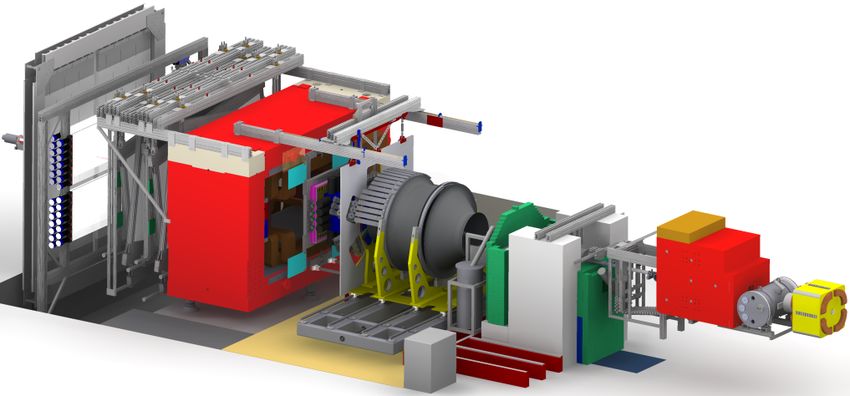
ToF
partial wave analyses (PWA) with dynamical coupled- flux monitoring
driftchambers BGO ball Open Dipole magnet
channel frame works [25, 26, 27, 28], isobar models [29, 30, SciFi y
31,32, 33, 34, 35, 36], and models incorporating Regge tra- MOMO
z
jectories [37, 38, 39] to fix t-channel contributions using x Tagger magnet
data above the resonance region (photon beam energies
larger than 4 GeV), a mutually consistent description be- goniometer
tween theory and data of KY photoproduction channels
forwa
has not been realised. rd sp
ectro e--beam
mete
r cen
The K + Λ threshold at a centre of mass energy of tral dete
ctor beam dump ARGUS
Tagger
1609 MeV, is in the third resonance region where an abun-
dance of s-channel resonances up to high spin states, u- Fig. 1. Overview of the BGOOD setup. The central detector
channel hyperon resonances and t-channel K, K ∗ and region consists of the BGO Rugby Ball, enclosing the MWPCs,
K1 exchanges contribute. The isospin singlet Λ, however, Plastic Scintillating Barrel and the target. Figure taken from
acts as a filter to remove intermediate ∆∗ states which ref. [49].
are present in KΣ channels, enabling a “cleaner” study
of t-channel processes. At forward angles, where the co-
This paper is organised as follows: sect. 2 describes
sine of the centre of mass K + polar angle, cos θCM K
, ex-
the BGOOD experiment and the running conditions dur-
ceeds 0.9, there is a paucity of data to constrain the re-
ing the data taking. Section 3 explains the identification of
action mechanism, and the existing cross section data of
the reaction channel and corresponding systematic uncer-
SAPHIR [20] and CLAS [14, 15, 18] have pronounced in-
tainties. Differential cross sections and recoil polarisation
consistencies2 . This has led to a poor understanding of
measurements are presented and discussed in sect. 4. Con-
the dynamics of the Born terms and t-channel K + and
cluding remarks are made in sect. 5.
K ∗ exchanges which dominate at forward angles (see for
example ref. [40]). PWA solutions have also included dif-
ferent s-channel resonance contributions, depending if the
fits used the SAPHIR or CLAS datasets (see for example 2 BGOOD setup and experimental running
ref. [41]). Data with high cos θCMK
resolution at forward conditions
(and backward) angles is also sensitive to high-spin inter-
mediate states, where the corresponding Legendre polyno- A detailed description of the experimental setup, perfor-
mials change quickly with respect to cos θCM K
. States with mance and analysis procedures is given in ref. [49].
spin 5/2 and 7/2 have been incorporated in previous PWA The data were taken during a 22 day beam time, using
and isobar model solutions (see for example refs. [25, 26, an incident ELSA electron beam energy of 3.2 GeV and a
41]). 6 cm long liquid hydrogen target. The electron beam was
incident upon a thin crystal radiator to produce a continu-
Forward angle kinematics also enables access to a regime
ous spectrum of bremsstrahlung photons. The orientation
where the momentum transfer to the recoiling hyperon is
of the crystal was such that a coherent, polarised peak
minimised. This is a vital input for the description of hy-
was set at a photon beam energy (Eγ ) of 1440 MeV, how-
pernuclei electroproduction at low Q2 [42, 43, 44, 45, 46, 47].
ever the polarisation was not required for the presented
Studying the Y -N interaction is crucial for an SU(3)flavour
analysis. The energy of each photon was determined by
description of baryon interactions and provides impor-
momentum analysing the post-bremsstrahlung electron in
tant astrophysical constraints, for example upon the equa-
the Photon Tagger. This consists of a dipole magnet and
tion of state for neutron stars (see ref. [48] and references
a hodoscope of plastic scintillators to detect the deflection
therein).
angle of the electron. Photon energies were measured from
The BGOOD experiment [49] (shown in fig. 1) at the 10 % to 90 % of the extracted ELSA electron beam energy.
ELSA facility [50, 51] in Bonn, Germany, is ideally suited The photon beam passed through a 7 mm diameter col-
for γp → K + Λ measurements at forward angles. BGOOD limator, with approximately 80 % of the bremsstrahlung
is composed of two distinct parts: a forward magnetic photons impinging upon the target (referred to as the tag-
spectrometer, ideal for the detection of forward going K + , ging efficiency). The photon flux was determined contin-
and a central calorimeter, suited for the identification of ually during the data taking using the Flumo detector
hyperons at low momentum, decaying almost isotropi- downstream from the experiment. This consists of two sets
cally. The presented data resolve discrepancies in existing of three plastic scintillators arranged downstream from
K
datasets for cos θCM > 0.9 from threshold to a centre of each other to detect electron-positrons from pair produc-
K
mass energy, W = 1870 MeV. Due to the high cos θCM tion in the beam. Flumo was calibrated to the photon
resolution, the cross section as the minimum momentum flux by taking separate, low rate runs using a lead glass
K
transfer is approached can be determined in 0.02 cos θCM scintillator, GIM, with 100 % photon detection efficiency.
intervals. The integrated photon flux from 900 to 1500 MeV photon
beam energy (the approximate region of the data shown)
2
The LEPS collaboration data [21, 22] starts at a photon was 8.4 × 10¹² .
beam energy of 1.5 GeV and is generally in agreement with The BGO Rugby Ball, comprised of 480 BGO crystals
CLAS data. individually coupled to photomultipliers, covers polar an-S. Alef et al.: K + Λ photoproduction at forward angles and low momentum transfer 3
gles 25◦ to 155◦ . The fast time read out per crystal allows real data is from π + from other hadronic reactions, and
clean identification of neutral meson decays to photons. positrons from pair production in the beam. The small
A set of two coaxial and cylindrical multiwire pro- peak at 360 MeV/c2 in the lower momentum interval is
portional chambers (MWPCs) and a Plastic Scintillating from pair production in the beam from an ELSA electron
Barrel surround the target within the BGO Rugby Ball bunch adjacent in time (every 2 ns) to the bunch contain-
and are used for charged particle identification and reac- ing the electron responsible for the triggered event. Tim-
tion vertex reconstruction. ing cuts with respect to particle β remove most of these
The Forward Spectrometer is a combination of tracking events, however these selection cuts are very conservative
detectors, an open dipole magnet and time of flight walls. with respect to detector time resolutions to avoid remov-
Two scintillating fibre detectors, MOMO and SciFi, track ing any particles from triggered hadronic reactions.
particles from the reaction vertex in the target. Down-
stream from these is the Open Dipole Magnet, operating
at an integrated field strength of 0.7 Tm and covering po- 70
Events per 7 MeV/c2
500 < p < 600 MeV/c Simulated data
lar angles 1◦ to 12◦ or 8◦ in the horizontal or vertical 60 K+
Real data
planes respectively. Particle trajectories downstream from 50
the Open Dipole Magnet are determined using eight dou-
40
ble layered drift chambers, and particle momentum is sub-
sequently determined by the deflection of the trajectory 30
in the magnetic field. Three time of flight (ToF ) walls at 20
the end of the spectrometer measure particle β. 10
The region between the BGO Rugby Ball and the For- 0
ward Spectrometer is covered by the SciRi detector, which 350 400 450 500 550 600 650 700
Calculated mass [MeV/c2]
is composed of three segmented rings of plastic scintilla-
tors for charged particle detection. SciRi covers a polar
Events per 7 MeV/c2
angle range of 10◦ to 25◦ . 100 700 < p < 800 MeV/c
K+
80
3 Event selection 60
40
K + were identified in the Forward Spectrometer from spa-
tial coincidences between MOMO, SciFi, the Drift Cham- 20
bers and the ToF walls. The momentum calculation used 0
a three dimensional magnetic field description, including 350 400 450 500 550 600 650 700
Calculated mass [MeV/c2]
fringe fields extending beyond the magnet yoke, and par-
ticle energy loss from the target, air and detector mate- Fig. 2. Mass reconstruction for K + candidates in the forward
rials. The particle trajectory was “stepped through” in spectrometer for real and simulated data (red and blue lines
discrete intervals, applying the expected acceleration due respectively). The K + momentum, pK + , intervals are labelled
to the Lorentz force and material energy loss. The interval inset. The dashed lines indicate the selection cut for the median
lengths were dynamically determined to optimise accuracy value of pK + described in the text.
and computational time depending upon the magnitude of
the energy loss and Lorentz force per interval. An iterative
approach was used to determine the optimum trajectory Candidate events were selected over ±2σ of the re-
and momentum, given the hit positions in the detectors constructed K + mass by approximately fitting a Gaus-
and weighted by their spatial resolutions. A momentum sian function to the mass distribution. This varied with
resolution of approximately 5 % of the measured momen- K + momentum, from ±47 MeV/c2 and ±106 MeV/c2 at
tum was achieved. See ref. [49] for details. 450 MeV/c and 1000 MeV/c respectively.
Particle β was determined by time measurements in Due the relatively small cross section compared to non-
the ToF walls, accounting for the trajectory length and strange channels, identification of the decay Λ → π 0 n was
particle energy loss. Contrary to the default track finding required to enhance the signal relative to background. π 0
routine described in ref. [49], a cluster in MOMO was not were identified in the BGO Rugby Ball via the two photon
required to form a forward track due to an efficiency of decay, where the measured invariant mass was required to
only 80 %. If no MOMO cluster was identified, it was suf- be ±30 MeV/c2 from the accepted π 0 mass, correspond-
ficient to use only a SciFi cluster and the target centre as ing to ±2σ. Figure 3 shows the missing mass from the
a space point. The increase in background and reduction K + π 0 system corresponding to the neutron mass for the
in spatial resolution were proved to be negligible. K + Λ channel, plotted against the missing mass from the
The mass of forward particles was calculated from mo- forward K + . Events were selected above the red line.
mentum and β. Figure 2 shows two examples of the recon- Events were rejected if a charged particle was identi-
structed K + mass for different momentum intervals, with fied in either the BGO Rugby Ball (via coincidence with
good agreement between real and simulated events. The the plastic scintillating barrel) or the intermediate SciRi
rising structure towards low masses at 300 MeV/c2 in the detector. The total energy deposition in the BGO Rugby4 S. Alef et al.: K + Λ photoproduction at forward angles and low momentum transfer
(a) Real data 8000
Counts
1400
K+π0 missing mass [MeV]
1000
7000 +
Simulated K Λ
1200 800
6000 Simulated ∆0π+
1000 mn 600 5000
800 400
4000
3000
600 200
mΛ mΣ0 2000
400 0
600 800 1000 1200 1400 1000
K+ missing mass [MeV]
0
(b) Simulated K+Λ and K+Σ0 events 0 100 200 300 400 500 600 700
1400 BGO Rugby Ball Energy Sum [MeV]
K+π0 missing mass [MeV]
1000
Fig. 4. Total energy deposition in the BGO Rugby Ball for
1200
simulated γp → K + Λ and γp → ∆0 π + events (red and blue
800
lines respectively) when a K + candidate was identified in the
1000 mn forward spectrometer and the π 0 from the Λ decay in the BGO
600
Rugby Ball. The dashed black line indicates the maximum en-
800 400 ergy deposition allowed when selecting K + Λ events.
600 200
mΛ mΣ0
400 0
tributed in the highest four energy intervals, and did not
600 800 1000 1200 1400 significantly change the extracted K + Λ yield. For these
K+ missing mass [MeV] intervals, the fit including the additional ∆0 π + missing
Fig. 3. Missing mass recoiling from the K + π 0 system versus
mass spectrum was used for the K + Λ yield extraction if
the missing mass from the K + . (a) Real data. (b) Simulated the reduced χ2 of the fit was improved. This occurred for
K + Λ and K + Σ 0 events, approximately weighted to the mea- the highest two data points, where the reduced χ2 were
sured ratio. Events were selected above the red line. 2.47 and 2.50 without including the ∆0 π + spectra, and
1.45 and 1.42 when including it. Fig. 6 shows the extracted
yields with and without the simulated ∆0 π + data.
Ball was also required to be lower than 250 MeV. The sim-
ulated data shown in fig. 4 demonstrates this removes ap-
proximately half of the most significant background from 3.1 Detection efficiency calculations
falsely identified π + from ∆0 π + events.
Figure 5 shows the K + missing mass for different pho- The detection efficiency was determined using a Geant4 [52]
ton beam intervals. The distribution of the π + and e+ simulation of the experimental setup. This included all
background was described by an equivalent analysis of spatial, energy and time resolutions, efficiencies for all de-
negatively charged particles, where π − and e− have simi- tectors in the forward spectrometer (described in ref. [49])
lar kinematics. Simulated data were used to describe the and the modelling of the hardware triggers described be-
K + Λ signal and the K + Σ 0 background. The simulations low.
followed energy and angular distributions from previously Three hardware trigger conditions, listed in table 1
measured cross sections [15, 16], however the intervals in were implemented for a broad range of experimental re-
K
cos θCM and energy were sufficiently small so that the quirements. Trigger 4 was used for this analysis, where
missing mass spectra could be considered fixed across each approximately 80 MeV minimum energy deposition was
interval. The spectra therefore depended solely on the ex- required in the BGO Rugby Ball and a signal in the SciFi
perimental energy and spatial resolutions, and accurately and ToF detectors, described in table 1 as a Forward
described the real data. A fit was subsequently applied Track.
using the three missing mass spectra as templates with
separate scaling factors in order to extract the K + Λ yield.
To fully understand background contributions, missing Trigger Description
mass spectra from additional simulated channels were in- 0 High BGO energy sum (∼ 200 MeV)
cluded in the fit. The only significantly contributing chan- 1 Low BGO energy sum (∼ 80 MeV) & SciRi
nel proved to be γp → ∆0 π + , where the π + was mistaken 3 SciRi & Forward Track
for a K + . This was already included in the e+ /π + back- 4 Low BGO energy sum & Forward Track
ground (the cyan line in fig. 5), however the inclusion of Table 1. BGOOD hardware triggers. Each trigger also re-
this simulated channel allowed the relative contributions quired a cluster in the Photon Tagger. Trigger 2 is obsolete.
of misidentified e+ and π + to vary. This channel only con-S. Alef et al.: K + Λ photoproduction at forward angles and low momentum transfer 5
900
Yield per photon beam interval
150 Eγ = 976 Eγ = 1049 +
150 χ2/n = 1.45 800 K Λ
χ2/n = 1.57 +
100 K Σ0
100 700
e+/π+ background
50 600
50
500
0 1000 1200 0 1000 1200 400
+
K Missing mass [MeV/c2] K+ Missing mass [MeV/c2]
300
200 Eγ = 1103 Eγ = 1156
150 χ2/n = 1.17 200
2
150 χ /n = 1.85 100
100 100
0
900 1000 1100 1200 1300 1400
50 50 Photon beam energy [MeV]
0 0 Fig. 6. The extracted yields for the K + Λ signal and back-
1000 1200 1000 1200
ground from K + Σ 0 and e+ π + misidentification (red circles,
K+ Missing mass [MeV/c2] K+ Missing mass [MeV/c2]
green triangles and cyan squares respectively). The solid filled
Eγ = 1210 150 Eγ = 1263 data points are without the simulated ∆0 π + background, the
150
χ2/n = 1.92 χ2/n = 1.09 open data points are when including this additional back-
100 100 ground.
50 50
(a)
0 0
Fraction of triggered events
1000 1200 1000 1200 1
K+ Missing mass [MeV/c2] K+ Missing mass [MeV/c2]
150 Eγ = 1317 150 Eγ = 1370 0.8
χ2/n = 0.99 χ2/n = 1.42 Low energy sum
100 0.6
100
High energy sum
0.4
50 50
0.2
0 0
1000 1200 1000 1200 0
K+ Missing mass [MeV/c2] K+ Missing mass [MeV/c2] 0 200 400 600 800 1000
Total BGO energy deposition [MeV]
Fig. 5. Missing mass from forward K + candidates after selec-
tion criteria described in the text. Every other photon beam (b)
Trigger 4 efficiency
energy bin (Eγ ) is shown and labelled in units of MeV, with 1
corresponding reduced χ2 for the fit. The data are the black
points, with fitted spectra from simulated K + Λ and K + Σ 0 and 0.8
e+ /π + background (red, green and cyan lines respectively).
The blue line is the summed total fit. The highest energy bin, 0.6
Eγ = 1370 MeV also includes the simulated ∆0 π + contribution
(purple line). 0.4
0.2
The efficiencies of the BGO Rugby Ball energy sum 0
0.5 0.6 0.7 0.8
triggers, shown in fig. 7(a) were determined via a ratio Forward particle β
of events passing different trigger combinations. The high
energy sum distribution was determined from the ratio of Fig. 7. Modelling of the hardware triggers. (a) The fraction
all events passing both triggers 0 and 3, and all events of events passing the low and high BGO energy sum triggers
passing trigger 3. The low energy sum used in this anal- (blue and red respectively). (b) The efficiency of trigger 4 as a
function of the forward going particle β.
ysis was determined from the ratio of all events passing
both triggers 1 and 4, and all events passing trigger 3.
This ensured that the difference was dependent only upon
the low energy sum efficiency, and not reaction and topo- the efficiency of trigger 4 also had a small dependence
logically specific. These distributions were implemented in upon the particle β. Fig. 7(b) shows this efficiency, deter-
simulated data for an accurate determination of detection mined from a clean selection of forward going protons. For
efficiencies. forward K + from K + Λ, β is approximately 0.65 and 0.90
Due to the small misalignment of trigger timing win- at W = 1680 and 1900 MeV, corresponding to correction
dows and the large time range for forward going particles, factors of 1.09 and 1.06 to the event yields respectively.6 S. Alef et al.: K + Λ photoproduction at forward angles and low momentum transfer
Both the trigger efficiency as a function of the BGO Source % error
energy deposition and the β of forward going particles Beam spot alignment 4.0
were successful in describing the well known γp → ηp Photon flux 4.0
differential cross section, the results of which are presented K + selection 2.0
in ref. [49]. SciFi efficiency 3.0
Shown in fig. 8, the detection efficiency was approxi- Target wall contribution 2.0
mately 2.4 % at threshold, rising smoothly to 5 % at 1400 MeV. Track time selection 2.0
The efficiency also increases at more forward angles. These Target length 1.7
efficiencies also account for the π 0 detection, the Λ → π 0 n ToF wall efficiency 1.5
branching ratio of 36 %, and approximately 50 % of K + MOMO efficiency 1.0
decaying in-flight. These three factors alone limit the de- Drift chamber efficiency 1.0
Beam energy calibration 1.0
tection efficiency to 13 %.
Modelling of hardware triggers 1.0
π 0 identification 1.0
0.08 Forward track geometric selection 1.0
Detection Efficiency
(a) cos θKCM > 0.9 (b)
0.07 0.07 Summed in quadrature 8.0
0.06 0.06 Table 2. Systematic uncertainties contributing to the constant
0.05 0.05 fractional error.
0.04 0.04
0.03 0.03
Eγ = 976 MeV vidual movement of data points. This was estimated from
0.02 0.02
Eγ = 1076 MeV the difference of when including the additional simulated
Eγ = 1156 MeV
0.01 0.01 Eγ = 1290 MeV ∆0 π + events in the background distribution and by also
Eγ = 1370 MeV varying the fit range. An exponential function was fitted
0 0
1000 1200 1400 0.92 0.94 0.96 0.98 to the difference in the cross section to describe the gen-
Photon beam energy [MeV] cos θKCM eral trend. The only significant differences were at the four
K data points at the highest energies where the signal yield
Fig. 8. Detection efficiency for: (a) cos θCM > 0.9 versus photon
K begins to reduce compared to the background and the K +
beam energy and (b) versus cos θCM for selected photon energy
missing mass distribution becomes broader. This gave an
intervals labelled inset. The connecting lines are an aid to guide
the eye.
uncertainty of 0.022 and 0.042 µb/sr at centre of mass en-
ergies 1831 and 1858 MeV respectively. The data stops at
1858 MeV as this uncertainty becomes very large at higher
energies.
To check the consistency of the fitting procedure, the
K
3.2 Systematic uncertainties data were also binned into both 0.03 and 0.02 cos θCM intervals,
where the yield was summed and compared to the total
Systematic uncertainties are divided into two components. K
over the full 0.1 cos θCM interval. This showed good agree-
The scaling uncertainty, the sources of which are listed in ment within the systematic errors. The same fitting sys-
table 2, is a constant fraction of the measured cross sec- tematic uncertainty was assumed for the data binned in
tion. The position of the beam when impinging upon the K
smaller cos θCM intervals, where the reduced statistics pre-
target was the largest source due to the dependence of the vented an accurate determination.
measured production angle and forward acceptance. This
was determined using simulated data. The absolute pho-
ton flux determination is the second largest uncertainty. 4 Results and discussion
This was estimated by measuring well known photopro-
duction cross sections (for example γp → π 0 p and ηp All presented data are tabulated in the appendix. The
shown in ref. [49])), and comparing flux measurements data extends to a photon beam energy of 1400 MeV, cor-
using the tagging efficiency calculations from the Flumo responding to a centre of mass energy of 1858 MeV. Above
and GIM detectors. Flumo measured the tagging efficiency this energy the systematic uncertainty in separating the
continuously during the data taking, whereas GIM mea- signal from background begins to increase very quickly.
sured the tagging efficiency every 12 hours at low rates (an
extracted electron beam of 40 pA compared to 1420 pA).
Despite the different beam conditions, an agreement of 4.1 γp → K + Λ differential cross section
the flux normalisation to within 3 % was achieved. The
K
electron beam position upon the diamond radiator was The differential cross section for cos θCM > 0.9 is shown
also closely monitored by a continuous study of the coher- in fig. 9. The interval range in W is typically 14 MeV
ent edge of the linearly polarised bremsstrahlung photon and determined by the width of the Photon Tagger chan-
energy distribution. nels. This is comparable to the previous data shown from
The fitting uncertainty from extracting the number of the CLAS collaboration [14, 15] and half the size of the
events from the missing mass spectra permits the indi- SAPHIR collaboration data [20]. It should be noted thatS. Alef et al.: K + Λ photoproduction at forward angles and low momentum transfer 7
the CLAS data is at the more backward angle of 0.85 < BS3 models at this energy but at a more backward angle
K K
cos θCM < 0.95, and the SAPHIR data is the only other of cos θCM ≈ 0.4 which is not covered by this new data.
K
dataset at this most forward cos θCM interval. The statis-
tical error, as a fraction of the measured data, is improved The Regge plus resonant (RPR) model of Skoupil and
by approximately a factor of two over most of the mea- Bydžovský [39] (red line) fails to reproduce the bump at
sured energy range. 1720 MeV, where it is considered that the S11 (1650) would
K need to contribute more to describe the data. This new
The available datasets at these forward cos θCM inter-
vals exhibit discrepancies, where the SAPHIR data is con- data with improved statistics will help constrain the RPR
sistently lower than the CLAS data, and the two CLAS model where previously it was fitted to the less precise
datasets also deviate from each other. These new data ap- CLAS and LEPS datasets within this forward region [53].
pear in agreement with the CLAS data of McCracken [15]. There is an improved agreement with the RPR model for
The CLAS data of Bradford [14] appears (by eye) approx- energies beyond 1800 MeV, where the rise is due to the
imately 20 % lower for energies below 1850 MeV and the constructive interference of the D13 (1700) and D15 (1675),
SAPHIR data [20] are lower over the full energy range by however the data exhibits a flatter distribution. Neither
the order of 30 to 40 %. resonances are included in the BS1 or BS3 isobar models,
which may cause the discrepancies at these energies [53].
The flatter distribution of the cross section for energies
BGOOD LEPS (Shiu) RPR greater than 1800 MeV for this data, the CLAS Bradford
dσ/dΩ [µb/sr]
CLAS (McCracken) LEPS (Sumihama) BS1
data and the LEPS data [22, 21] is inherent to Regge based
CLAS (Bradford) BnGa without BGOOD BS3
0.5 SAPHIR BnGa with BGOOD
models which cannot introduce structure, compared to iso-
bar models. The RPR model amplitude within this region
however is still strongly influenced by the parameters from
0.4 the s channel contributions, with the Regge region only
applicable above 3 GeV [53].
0.3
The Bonn-Gatchina BG2019 solution [27], when fit-
ted simultaneously to both the CLAS data is also shown
0.2 in fig. 9 as the magenta line. There is a reduced χ2 of
2.99 between the fit and this data. The fit describes this
data well below 1800 MeV however above this energy the
0.1 fit reduces in strength and does not reproduce the slight
rise of the data points. A new fit additionally including
this data is shown as the cyan line. The fit optimized all
0
1650 1700 1750 1800 1850 1900 1950 K + Λ and K + Σ 0 couplings for the resonant contributions
W [MeV] and t and u channel exchange amplitudes with K + Λ and
K + Σ 0 final states. Only reactions with two body final
Fig. 9. γp → K + Λ differential cross section for cos θCM
K
> 0.90 states were fitted. A full parameter optimisation was then
(black filled circles). The systematic uncertainties on the ab- made, fitting all reactions from the Bonn-Gatchina PWA
scissa are in three components: The shaded blue and red database. Finally, all three body couplings were fixed. The
bars are the scaling and fitting uncertainties respectively, de-
reduced χ2 between this new fit and the data improved to
scribed in sec. 3.2. The grey bars are the total. Previous data
2.41. The only significant changes occurred in the forward
(only including statistical errors) is shown of McCracken et al.
(CLAS) [15] (blue open squares), Bradford et al. (CLAS) [14]
region, with negligible changes to the more backward re-
(red open triangles), Glander et al. (SAPHIR) [20] (green open gion covered by the CLAS data. The inclusion of this data
diamonds), Shiu et al. (LEPS) [22] (orange filled triangle) and changed contributions from the non-resonant amplitudes
Sumihama et al. [21] (orange filled squares). The CLAS data defined by the K 0 (1430) and Σ exchanges. For the reso-
are at the more backward angle of 0.858 S. Alef et al.: K + Λ photoproduction at forward angles and low momentum transfer
Figures 10 and 11 show the differential cross section
dσ/dΩ [µb/sr]
K
in 0.02 cos θCM K
intervals versus cos θCM and W respec- cos θKCM = 0.91
0.5
tively. Near threshold, the distribution is flat, suggesting
s-channel dominating components of the reaction mecha- 0.4
nism. As W increases the cross section becomes more for- 0.3
ward peaked consistent with increasing t-channel K and 0.2
K ∗ exchange processes. In fig. 11, the peak at 1720 MeV
remains approximately constant in strength over the cos θCMK 0.1
range. 0 1650 1700 1750 1800 1850
cos θKCM = 0.93 cos θKCM = 0.95
0.5 0.5
0.4 0.4
0.4 1624 1648 0.3 0.3
0.3
dσ/d Ω [µb/sr]
0.2 0.2 0.2
0.1 0.1 0.1
0.8 0.85 0.9 0.95 0.8 0.85 0.9 0.95
0.4 1669 0 1650 1700 1750 1800 1850
0
1650 1700 1750 1800 1850
0.3 cos θK
CM = 0.97 cos θKCM = 0.99
0.5 0.5
0.2
0.1 1688 0.4 0.4
0.3
0.8 0.85 0.9 0.95 0.8 0.85 0.9 0.95
0.3
0.4
0.3 0.2 0.2
0.2 0.1
0.1 1703 1717 0.1
0.8 0.85 0.9 0.95 0.8 0.85 0.9 0.95 0 0
0.4 1700 1800 1700 1800
0.3 W [MeV]
0.2 Fig. 11. γp → K + Λ differential cross section for intervals
0.1 1732 1746 K
0.8 0.85 0.9 0.95 0.8 0.85 0.9 0.95
of 0.02 in cos θCM (filled black circles). Other data points and
0.4 model fits are the same as described in fig. 9.
0.3
0.2
0.1 1761 1775 t within each two dimensional W and cos θCM K
interval, a
0.8 0.85 0.9 0.95 0.8 0.85 0.9 0.95
generated distribution assumed the differential cross sec-
0.4 tion of the McCracken CLAS data [15]. For each interval
0.3 of the BGOOD data in W and cos θCM K
, the mean average
0.2
0.1 1789 1803 value of t was used
√ as the central value, and the width was
0.8 0.85 0.9 0.95 0.8 0.85 0.9 0.95 determined as 12 RMS. The BGOOD differential cross
0.4 section data with respect to t is shown for each W inter-
0.3 val in fig. 12. The function in eq. 1 was fitted to the data
0.2 to interpolate the cross section to the minimum value of
0.1 1871 1831
0.8 0.85 0.9 0.95 0.8 0.85 0.9 0.95
t achievable for the given W interval, tmin (occurring at
K
0.4 0.4 cos θCM = 1), and to extract the slope parameter, S.
0.3 0.3
0.2 dσ dσ
eS|t−tmin |
0.2
1844 1858 = (1)
0.1 0.1 dt dt t=tmin
0.8 0.85 0.9 0.95 0.8 0.85 0.9 0.95
Fig. 13 shows the differential cross section at tmin and
W [MeV]
the slope parameter S versus W . The shape of the cross
K
Fig. 10. γp → K + Λ differential cross section versus cos θCM
K
section is similar to the most forward cos θCM interval,
for each centre of mass energy, W labelled inset in MeV. Filled with a dominant peak at 1720 MeV. For the first 100 MeV
K
black circles are these data binned into 0.02 cos θCM intervals, above threshold, S remains positive. At higher energies, S
and other data points and model fits are the same as described becomes increasingly negative, indicating the onset of t-
in fig. 9. channel K exchange dominating the reaction mechanism.
K
The data binned finely into 0.02 cos θCM intervals was 4.2 γp → K + Λ recoil polarisation
used to determine the differential cross section with re-
spect to the Mandelstam variable, t = (pγ − pK )2 , where The weak decay of the Λ allows access to the recoil polari-
pγ and pK are the four-momenta of the photon beam sation via the decay distribution. The π 0 four-momentum
and K + respectively. To account for the distribution of from Λ → π 0 n was boosted into the Λ rest frame andS. Alef et al.: K + Λ photoproduction at forward angles and low momentum transfer 9
6 6
16244 1648 6
dσ/dt at t = tmin [µb/GeV2]
4 (a)
2 2 5
0
6 0
6
0 0.02 0.04
166940 0.02 0.04
1688 4
4
2 2 3
6
0 6
0 2
0 0.02 0.04 0 0.02 0.04
4 4 1717
1
2 17032
0
6 0
6 0 1650 1700 1750 1800 1850
0 0.02 0.04
173240 0.02 0.04
1746 (b)
Slope parameter, S
20
4
2 2
10
6
0 6
0
0 0.02 0.04
176140 0.02 0.04
1775
4 0
2 2
−10
6
0 6
0
0 0.02 0.04
178940 0.02 0.04
1803
4
−20
2 2
0
6 0
6 1650 1700 1750 1800 1850
0 0.02 0.04
181740 0.02 0.04 W [MeV]
4 1831
2 2 Fig. 13. (a) K + Λ differential cross section, dσ/dt extrapolated
6
0 6
0 to tmin versus W . (b) The slope parameter S versus W .
0 0.02 0.04
184440 0.02 0.04
4 1858
2 2 uncertainty mostly cancel out. The remaining dominating
0 0 uncertainty is the accuracy of α of 6.2 %.
0 0.02 0.04 0 0.02 0.04
Fig. 12. dσ/dt versus |t − tmin | for intervals of centre of mass
PΛ
energy, W , labelled inset in MeV. Only the statistical error is 1
shown and included in the fit. The red line is eq. 1 fitted to 0.9 < cos θKCM < 1.0
the data.
0.5
the π 0 direction relative to the reaction plane was deter-
0
mined (denoted N↑/↓ ). The recoil polarisation was mea-
sured according to eq. 2. The Λ decay parameter used,
α = 0.642 ± 0.04 [54] is the average value cited by the −0.5
Particle Data Group prior to 20193 .
2 N↑ − N↓ −1
PΛ = (2)
α N↑ + N↓ 1650 1700 1750 1800 1850
W [MeV]
Simulated data were used to determine the success Fig. 14. Recoil polarisation, PΛ for 0.910 S. Alef et al.: K + Λ photoproduction at forward angles and low momentum transfer
30]. The Bonn-Gatchina BG2019 solution prior to includ- 10. P.A. Zyla et al. Prog. Theor. Exp. Phys., 2020, 083C01,
ing this data gives a χ2 of 0.98 for the recoil asymmetry. 2020.
When refitting using the new data as described above, χ2 11. S. Capstick and W. Roberts. Prog. Part. Nucl. Phys.,
changes to 0.95. 45:S241, 2000.
12. U. Löring, B. C. Metsch, and H. R. Petry. Eur. Phys. J.
A, 10:395, 2001.
13. T. C. Jude, D. I. Glazier, D. P. Watts, et al. Phys. Lett.
5 Conclusions B, 735:112, 2014.
14. R. Bradford et al. Phys. Rev. C, 81:035202, 2006.
Differential cross sections for γp → K + Λ for cos θCM
K
> 0.9 15. M. E. McCracken et al. Phys. Rev. C, 81:025201, 2010.
have been measured with high polar angle resolution from 16. B. Dey et al. Phys. Rev. C, 82:025202, 2010.
threshold to W = 1870 MeV. A consistency is observed 17. R. Bradford et al. Phys. Rev. C, 75:035205, 2007.
between this data and the CLAS data of McCracken et 18. J. W. C. McNabb, R. A. Schumacher, L. Todor, et al. Phys.
al. [15], which is also supported by a dedicated Bonn Rev. C, 69:042201, 2004.
Gatchina PWA analysis. The high statistics provide con- 19. D. S. Carman, B. A. Raue, et al. Phys. Rev. C, 79:065205,
straints in determining dominating t-channel K and K ∗ Jun 2009.
exchange at forward angles and low momentum transfer, 20. K.H. Glander et al. Eur. Phys. J. A, 19:251, 2004.
and the cos θCMK
resolution renders the data particularly 21. M. Sumihama et al. Phys. Rev. C, 73:035214, 2006.
sensitive to intermediate high-spin states. Additionally, 22. S. H. Shiu, H. Kohri, et al. Phys. Rev. C, 97:015208, 2018.
23. A. Lleres et al. Eur. Phys. J. A, 31:79, 2007.
the recoil polarisation data for K + Λ is the first dataset
K 24. I. S. Barker and A. Donnachie. Nucl. Phys. B, 95:347,
at this most forward cos θCM interval.
1975.
25. A.V. Anisovich, V. Kleber, E. Klempt, V.A. Nikonov, A.V.
Sarantsev, and U. Thoma. Eur. Phys. J. A, 34:243, 2007.
Acknowledgements 26. A. V. Anisovich et al. Eur. Phys. J. A, 50:129, 2014.
27. J. Müller et al. Phys. Lett. B, 803:135323, 2020.
We thank the staff and shift-students of the ELSA accel- 28. D. Rönchen, M. Döring, and U. G. Meißner. Eur. Phys. J.
erator for providing an excellent beam. A, 54(6):110, 2018.
We thank Dalibor Skoupil and Petr Bydžovský for in- 29. D. Skoupil and P. Bydžovský. Phys. Rev. C, 93:025204,
2016.
sightful input and comparison of the data to their isobar
30. D. Skoupil and P. Bydžovský. Phys. Rev. C, 97:025202,
and RPR models and Eberhard Klempt for help with the
2018.
Bonn-Gatchina PWA.
31. T. Mart and C. Bennhold. Phys. Rev. C, 61:012201, 1999.
This work is supported by SFB/TR-16, DFG project 32. S. Clymton and T. Mart. Phys. Rev. D, 96:054004, 2017.
numbers 388979758 and 405882627, the RSF grant num- 33. F.X. Lee, T. Mart, C. Bennhold, H. Haberzettl, and L.E.
bers 19-42-04132 and 19-12-04132, the Third Scientific Wright. Nuc. Phys. A, 695(1):237, 2001.
Committee of the INFN and the European Union’s Hori- 34. S. Janssen, J. Ryckebusch, D. Debruyne, and T. Van
zon 2020 research and innovation programme under grant Cauteren. Phys. Rev. C, 65:015201, 2001.
agreement number 824093. P.L. Cole gratefully acknowl- 35. W. Van Nespen D. Debruyne S. Janssen, J. Ryckebusch
edges the support from both the U.S. National Science and T. Van Cauteren. Eur. Phys. J. A, 11:105, 2001.
Foundation (NSF-PHY-1307340, NSF-PHY-1615146, and 36. D. G. Ireland S. Janssen and J. Ryckebusch. Phys. Lett.
NSF-PHY-2012826) and the Fulbright U.S. Scholar Pro- B, 562:51, 2003.
gram (2014/2015). 37. L. De Cruz, T. Vrancx, P. Vancraeyveld, and J. Rycke-
busch. Phys. Rev. Lett., 108:182002, 2012.
38. L. De Cruz, J. Ryckebusch, T. Vrancx, and P. Van-
craeyveld. Phys. Rev. C, 86:015212, 2012.
References 39. P. Bydžovský and D. Skoupil. Phys. Rev. C, 100:035202,
2019.
1. S. Capstick and N. Isgur. Phys. Rev. D, 34:289, 1986. 40. P. Bydžovský and D. Skoupil Nucl. Phys. A, 914:14, 2013.
2. S. Capstick. Phys. Rev. D, 46:2846, 1992. 41. T. Mart and A. Sulaksono. Phys. Rev. C, 74:055203, 2006.
3. S. Capstick and W. Roberts. Phys. Rev. D, 49:4570, 1994. 42. A1 Collaboration, P. Achenbach, A. Esser, C. Ayerbe
4. D. O. Riska and G. E. Brown. Nucl. Phys. A, 679:577, Gayoso, et al. Nuc. Phys. A, 881:187, 2012.
2001. 43. A1 Collaboration, P. Achenbach, C. Ayerbe Gayoso, et al.
5. R. G. Edwards, J. J. Dudek, D. G. Richards, and S. Wal- Eur. Phys. J. A, 48(2):14, 2012.
lace. Phys. Rev. D, 84:074508, 2011. 44. F. Garibaldi et al. Phys. Rev. C, 99:054309, 2019.
6. E. Klempt and B.Ch. Metsch. Eur. Phys. J. A, 48:127, 45. T. Motoba, P. Bydžovský, M. Sotona, and K. Itonga. Prog.
2012. Theor. Phys. Suppl., 185:224, 2010.
7. M.M. Giannini and E. Santopinto. Chin. J. Phys., 46. P. Bydžovský and T. Mart. Phys Rev. C, 76:065202, 2007.
53:020301, 2015. 47. T. Motoba K. Itonaga K. Ogawa P. Bydžovský, M. Sotona
8. H.L.L Roberts, L. Chang, I.C. Cloët, and C. D. Roberts. and O. Hashimoto. Nucl. Phys. A, 199:881, 2012.
Few-Body Systems, 51:51, 2011. 48. J. Haidenbauer, U. G. Meißner, N. Kaiser, and W. Weise.
9. K. Nakamura et al. (Particle Data Group). J. Phys. G, Eur. Phys. J. A, 53(6):121, 2017.
37:075021, 2010. 49. S Alef et al. Eur. Phys. J. A, 56:104, 2020.S. Alef et al.: K + Λ photoproduction at forward angles and low momentum transfer 11
50. W. Hillert. Eur. Phys. J. A, 28:139, 2006. Appendix: Tabulated data
51. W. Hillert et al. EPJ Web Conf., 134:05002, 2017.
52. J. Allison et al. Nucl. Instrum. Meth. A, 835:186, 2016.
53. D. Skoupil and P. Bydžovský. Private communication,
2020.
54. M. Tanabashi et al. Phys. Rev. D 98, 030001, 2018. K
0.9012 S. Alef et al.: K + Λ photoproduction at forward angles and low momentum transfer
K K
0.92S. Alef et al.: K + Λ photoproduction at forward angles and low momentum transfer 13
K
0.90You can also read