Irrigation quality and management determine salinization in Israeli olive orchards
←
→
Page content transcription
If your browser does not render page correctly, please read the page content below
Geosci. Model Dev., 15, 129–143, 2022
https://doi.org/10.5194/gmd-15-129-2022
© Author(s) 2022. This work is distributed under
the Creative Commons Attribution 4.0 License.

Irrigation quality and management determine salinization
in Israeli olive orchards
Vladimir Mirlas1 , Yaakov Anker1 , Asher Aizenkod2 , and Naftali Goldshleger3,
1 Department of Chemical Engineering and the Eastern R&D Center, Ariel University, Ariel, Israel
2 ThePlant Protection and Inspection Services of the Ministry of Agriculture and Rural Development, Rishon LeTsiyon, Israel
3 Department of civil engineering, Ariel University, Ariel, Israel
 deceased, 2019

Correspondence: Yaakov Anker (kobia@ariel.ac.il)

Received: 10 July 2020 – Discussion started: 6 August 2020
Revised: 29 October 2021 – Accepted: 30 October 2021 – Published: 10 January 2022

Abstract. Olive (Olea europaea L.) orchard brackish water         ies had shown that these processes were enhanced by a semi-
irrigation with incorrect irrigation management reduces soil      confined shallow aquifer (Kruseman and De Ridder, 1976),
fertility and degrades soil health through soil salinization.     causing upward water flow during winter and spring seasons
This study was conducted in the Beit She’an Valley, one of        and reducing downward rain and irrigation percolation dur-
the main agricultural regions in Israel, in an olive orchard in   ing the summer and fall seasons (Gafni and Salinger, 1992).
which a combination of soil salinization and poor drainage           Most of the soil salinization problems in the Beit She’an
conditions impedes plant development and causes severe            Valley are associated with the use of poor-quality irriga-
economic damage. By combining various research methods,           tion water (conductivity above 3 dS m−1 ). The soil salinity is
including soil salinity monitoring, field experiments, remote     constantly increasing owing to irrigation with high-salinity-
sensing (frequency domain electromagnetic – FDEM), and            treated wastewater and blocking of the natural drainage to the
unsaturated soil profile saline water movement modeling, the      underlying groundwater (Mirlas et al., 2006a; Mirlas, 2012).
salinization processes were quantified. Irrigation water con-     At a lemon tree plantation in the Jordan Valley, it was found
ductance of 3.13 dS m−1 points to salinization within the tree    that an increase in irrigation water salinity to 3.7 times fresh-
upper root zone, whereas the modeling results suggest that        water salinity increased soil salinity by 3.8 to 4.1 times in
salinization danger is greater with brackish treated wastewa-     a few years (Abu Awwad, 2001). An additional effect of
ter rather than with lower-salinity brackish irrigation ground-   treated effluent irrigation in the Jordan Valley was decreas-
water and that irrigation with potable water can help reduce      ing pH in parallel to soil salinity increase (Mohammad and
salt accumulation and recover damaged plots.                      Mazahreh, 2003). In the Beit She’an Valley, high saline–
                                                                  sodic concentration in irrigation damaged the soil’s hydraulic
                                                                  conductivity, increasing runoff and causing silt–clay chalk
                                                                  soil erosion (Mandal et al., 2008a; Bhardwaj et al., 2008).
1   Introduction                                                     While global-scale land surface–soil–biosphere–
                                                                  atmosphere models enable a regional water balance
Soil salinity surveys and studies across the world and Israel     (Boone et al., 2017; Guimberteau et al., 2018; Katz et
indicate that irrigation with poor water quality and improper     al., 2018), understanding water and solute movement pro-
irrigation management causes soil salinization and degrada-       cesses in unsaturated soil layers requires a mathematical
tion, and damages soil fertility (Wada et al., 2016; Pandit et    description and numerical model development (Leij et al.,
al., 2020). Soil salinity monitoring in the Jezre’el Valley be-   1991; Simunek and van Genuchten, 1995; van Genuchten
gan in 1987, following a soil salinity survey that showed in-     and Wagenet, 1989; Celia et al., 1990; Kool et al., 1985).
tensive salinization and often alkalinization of the upper soil   Principal component analysis (PCA) suggests that soil
horizons (Benyamini et al., 2005, 1998, 2000). Earlier stud-

Published by Copernicus Publications on behalf of the European Geosciences Union.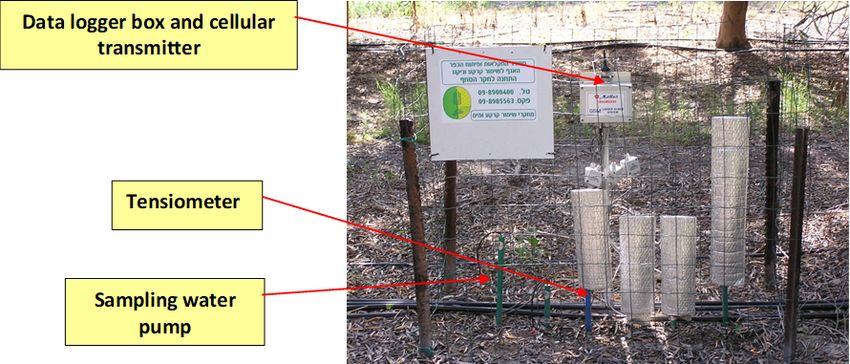
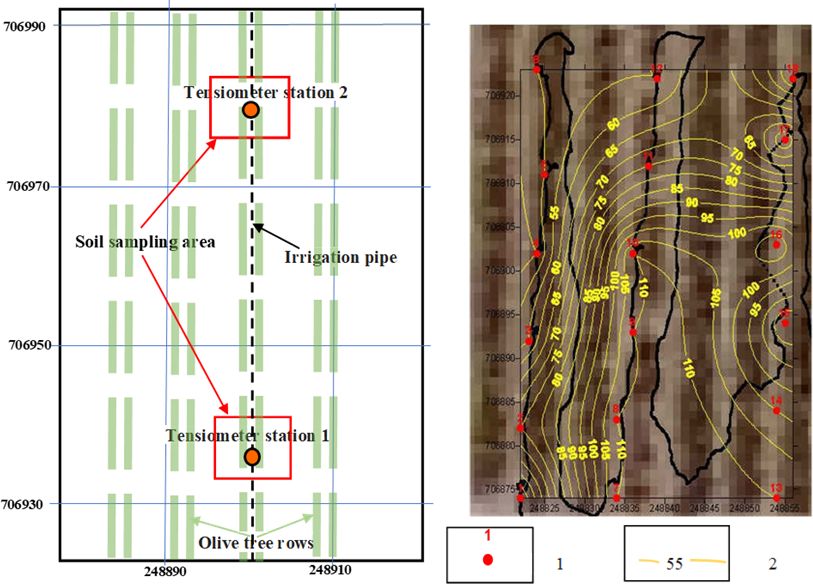
130                                                                        V. Mirlas et al.: Olive orchard salinization prevention

hydraulic conductivity is one of the factors affecting soil             The soils of the Beit She’an Valley were selected for re-
quality (Mandal et al., 2008b). Water and solute movement            search as it is one of the most important agricultural ar-
models in an unsaturated soil layer are based on Richards’           eas in Israel. They consist of brown clay soils (grumusols)
equation for one-dimensional movement of water under sat-            and calcritic soils, with the latter’s profile characterized by
uration variability (Celia et al., 1990; Bear, 1972), and root       thin layers and formation layers of marl with high water ab-
water uptake is calculated by the van Genuchten equation             sorption capacity. The soil stratification influences the poten-
(van Genuchten, 1987). In such models, the soil hydraulic            tial to drain and wash excess salts that accumulate during
conductivity coefficient in the saturated media varies as a          the irrigation season, which preserve ventilated root condi-
function of the soil’s hydraulic conductivity.                       tions. Sodium-rich soil has up to 30 % cation exchangeable
   Soil moisture may be evaluated through atmospheric con-           capacity, which exacerbates the ventilation conditions nec-
ditions (Garrigues et al., 2015) or calculated as a function         essary for plants. The combination of soil stratification and
of suction (pressure head) and hydraulic conductivity in an          poor drainage conditions impedes plant development, and,
unsaturated condition. Salt leaching and accumulation are            in some cases, soil structure destruction and salt accumu-
significant in arid and semi-arid areas (Wada et al., 2016).         lation in the root zone cause plant degeneration due to wa-
Salt motion models are commonly based on the Fickian                 ter absorption difficulties (Machado and Serralheiro, 2017).
convection–dispersion equation for solute transport (Toride          Consequently, crop irrigation by brackish water in the Beit
et al., 1993) and complex models that should also consider           She’an area might cause economic damage.
absorption processes, anion and cation exchange, and more.              The irrigation water sources in the area are of variable
Several modeling platforms such as HYDRUS (Simunek                   quality: springs and Jordan River water are considered of ac-
et al., 1998) and WASTRC-1 (Mirlas et al., 2006b) are                ceptable quality (fresh), while groundwater and effluent wa-
widely used. WASTRC-1, a one-dimensional water and so-               ter might be of poor quality (brackish). In this latter case,
lute movement model under saturated conditions, was found            irrigation without clear irrigation criteria might steadily dam-
to fit the soil characteristics of Hula Valley irrigated fields in   age soil fertility. Defining an irrigation regime for local soil
Israel. In both the HYDRUS and WASTRC-1 models, vari-                and water quality conditions is therefore of great importance
ous soil hydraulic conditions such as drainage, irrigation, and      for preventing crop and economic damage in the Beit She’an
layer saturation depth can be considered. Soil density, satu-        Valley. The required knowledge should indicate how water
rated hydraulic conductivity, field moisture, suction, and root      and salt move in soil and correlate with salinity processes
zone development among other factors are prerequisites for           and irrigation management capability (Pandit et al., 2018).
model calibration, parameter validation, and, consequently,          Combining remote sensing (FDEM) methods with water and
proper water and solute movement simulation (Garrigues et            salt movement models in the unsaturated soil layer may en-
al., 2015).                                                          able the effective identification of soil salinization processes.
   Salinization during irrigation is a dynamic process as the        In turn, this may result in improved planning and control for
number of salts in the soil and their composition change dur-        irrigation systems.
ing irrigation in both the surface area and in the soil pro-            As integrative knowledge of harvesting demonstration
file. Soil salinity mapping by the traditional sampling method       needed for irrigation management, this study’s objective was
is expensive and time-consuming, with mapping accuracy               to assess soil salinization processes because of low-quality
directly depending on the distance between the sampling              irrigation at the Kibbutz Meirav olive plantation in the Beit
points (Pandit et al., 2018). Remote sensing technologies that       She’an Valley.
are based on active electromagnetic (EM) radiation are be-
ing widely adopted for soil salinity mapping. Ground-based
EM methods measure electrical conductivity (EC) in subsur-           2     Materials and methods
face and substratum horizons and can thus recognize salinity
anomalies in the field before salinization approaches the sur-       2.1    Research site background and geographical
face (Farifteh et al., 2007). EM induction sensors measure the              framework
soil profile salinity by recording the soil’s apparent electrical
conductivity (ECa).                                                  The Beit She’an area is a unique agricultural area due to a
   Frequency domain electromagnetic (FDEM) techniques                combination of warm and dry climate (potential annual evap-
are a powerful tool for mapping soils and detecting changes          oration of 2400 mm at the meteorological service, Eden Farm
in soil types related to salinity. FDEM sensors work within a        Station), saline water irrigation, and heavy soils. The study
range of 30 cm to 5 m of depth and perform best while scan-          site is a mature (2002) olive plantation located 1100 m north
ning the area from about 1 m above the ground (Ben Dor et            of the Kibbutz Meirav (Fig. 1).
al., 2009a). By applying FDEM with other active and passive             The planting intervals between the trees and rows are 7
remote sensing methods, EC values in given soil layers were          and 4 m. The rainfall amount at the study site was 154, 253,
attained for the soil in the Jezre’el Valley (Ben Dor et al.,        and 281 mm in 2007/2008, 2008/2009, and 2009/2010 hy-
2009b).                                                              drological years, respectively. The soil at the study site is lay-

Geosci. Model Dev., 15, 129–143, 2022                                                   https://doi.org/10.5194/gmd-15-129-2022
V. Mirlas et al.: Olive orchard salinization prevention                                                                             131

Figure 1. Study site location (regional map: after CIA factbook, 2021; photo: Survey of Israel, 2021).

ered, with a practically impervious shallow layer of travertine         mainly due to high sodium chloride concentrations (Flexer et
found in different locations of the plantation as well as layers        al., 2006). The chloride concentration is in a range of 800–
of marl at greater depth. Soil salinity stains were observed            1700 mg L−1 and electrical conductivity is above 3.5 dS m−1 .
together with trees suffering from lack of ventilation, salting,        Local authorities intend to dilute the local water with effluent
and excess irrigated water. Following the soil sample particle          water and reduce the chloride concentration in the water to
size analysis results, the soil mechanical components at the            800 mg L−1 . The acceptable amount of irrigation from May
research site consist of clay (40 %–50 %), silt (25 %–30 %),            to November is 0.285 mm h−1 .
and sand (20 %–30 %) (Fig. 2).                                             The olive plantation drip irrigation regime in one extension
   The Kibbutz Meirav olive plantation irrigation water qual-           along the row that was used for the study calibration was
ity test results for different seasons during the study period          1 L s−1 every 40 cm daily, with a cumulative water amount
are presented in Table 1. The main irrigation water sources in          from April to November (harvest) between 631 and 1272 m3
the area are Jordan River water and local groundwater whose             per 1000 m2 . Nitrogen fertilizer given by dosing pumps was
salinity and SAR (sodium adsorption ratio) are very high,               15–20 kg for the season regardless of the amount of water.

https://doi.org/10.5194/gmd-15-129-2022                                                        Geosci. Model Dev., 15, 129–143, 2022
132                                                                             V. Mirlas et al.: Olive orchard salinization prevention

Table 1. Quality of irrigation at Kibbutz Meirav olive plantation.

        Date                pH         EC      SAR         Cl        Ca + Mg        Na         K    N−NO3       N−NH4           B
                                   dS m−1              mg L−1         mg L−1    mg L−1    mg L−1    mg L−1      mg L−1     mg L−1
        13 June 10          7.9        2.90     5.1        862           266        310      14.1                            0.139
        22 August 10        8.2        3.74     6.4       1005           317        425      17.6
        19 December 10      8.1        3.19    5.21        845           315        345      12.5
        5 May 11            8.9        2.84    5.71        841           258        345      12.1       N.D.         1.9     0.110
        23 August 11        8.2        3.64    5.66        848           277        352      16.4       N.D.         0.8     0.200

                                                                          cluded soil sampling to measure soil moisture and soil salin-
                                                                          ity coupled to FDEM mapping. The integration of the vari-
                                                                          ous data processing types and modeling finally yielded a soil
                                                                          salinization spatial–temporal illustration of the different irri-
                                                                          gation regimes (Fig. 4).

                                                                          2.3     Research procedures

                                                                          2.3.1    Soil suction monitoring

                                                                          Continuous soil suction monitoring included two transmit-
                                                                          ting tensiometer stations (Mottes Tensiometers, Ltd.). The
                                                                          two stations were installed 50 m from each other. At each
                                                                          station, four tensiometers were installed, measuring the soil
                                                                          suction at depths of 20, 40, 60, and 70 cm from the soil
                                                                          surface and under the olive tree rows. The tensiometer sys-
                                                                          tem sampled soil suction values (in mBar) every 30 min that
                                                                          were transmitted to the company’s website (https://www.
                                                                          tensiograph.com/?action=lang=en, last access: 12 June 2021)
Figure 2. The mechanical composition (soil texture triangle) of soil      every 4 h, enabling online data availability through a client
at the research site. The depth range of the travertine layer is from     interface. During the study, selected soil solution samples
110 cm at the southern edge to 55–60 cm at the northern edge of the       were pumped from the tensiometers and analyzed at the lab
site (Fig. 3).                                                            (Fig. 5).

                                                                          2.3.2    Soil salinity and moisture monitoring
2.2   Research methodology
                                                                          Soil moisture and salinity monitoring were made by simul-
                                                                          taneous soil sampling every 2 weeks from September until
This study integrates field experiments with water and salt
                                                                          December 2011. Soil samples were taken at depths of 0–20,
movement models in the unsaturated soil strata. Field experi-
                                                                          40–60, 20–40, and 70 cm or down to the depth of the traver-
ments including a remote sensing method (FDEM) were uti-
                                                                          tine layer. Drilling was done along the olive rows between
lized to supply the required data for water and salt movement
                                                                          the trees. Each sample characterized a particular tensiome-
modeling and soil salinity mapping during soil salinization
                                                                          ter depth as well as the distance from the irrigation pipe and
monitoring under different irrigation conditions (Corwin and
                                                                          closest dripper. The laboratory salt composition delineation
Lesch, 2005). The suction and soil moisture monitoring dur-
                                                                          included electrical conductivity (EC), saturation percentage
ing the irrigation period was conducted near two tensiometer
                                                                          (SP), sodium adsorption ratio (SAR), Na, Ca + Mg, Cl, and
stations characterizing suction and soil moisture conditions.
                                                                          SO4 ion concentrations, general chalk, mechanical compo-
The first station characterized irrigation by about 80 % of the
                                                                          sition, and soil moisture. Soil moisture weight is calculated
acceptable amount of irrigation (lack of water) and the sec-
                                                                          by subtracting the weight of the dry soil from the weight of
ond station characterized irrigation by about 120 % of the
                                                                          the moist soil and then dividing by the weight of the dry soil,
acceptable amount of irrigation (excess water). The field ex-
                                                                          which is expressed by a unitless fraction number.
periment was conducted in spring before the beginning of
summer irrigation, which made it possible to evaluate the soil
salinization dynamics when water enters practically dry soil
after winter precipitation salt washing. The experiment in-

Geosci. Model Dev., 15, 129–143, 2022                                                        https://doi.org/10.5194/gmd-15-129-2022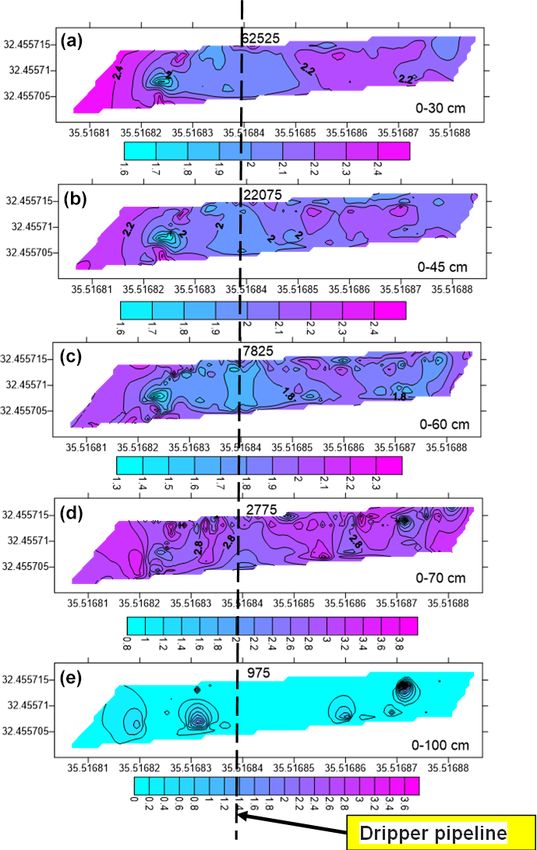
V. Mirlas et al.: Olive orchard salinization prevention                                                                                133

Figure 3. Depth of the travertine layer from the soil surface in centimeters (background aerial photo is an insert from Fig. 1; orthophoto).
1 – lithological borehole; 2 – isoline of travertine layer depth from the soil surface.

2.3.3   Field experiment                                                2.3.4    FDEM measurements and mapping of soil
                                                                                 electrical conductivity
From 22 to 28 March 2011, a field experiment was conducted
with the purpose of obtaining soil salinity parameters before           Measurements were done along the control lines and in the
the irrigation season. These parameters were needed to build            area between the tree row in the experiment site. Three mea-
and adapt the moisture and salt motion model for the up-                suring lines with 7 m length were spaced 0.5 m apart near
per soil unsaturated layer. The experiment included moisture            the first tensiometer station. The measurement lines were
and salinity measurements through manual soil sampling and              made perpendicular to the irrigation dripper pipeline. Map-
FDEM soil salinity mapping. Near each tensiometer station,              ping was done after 3 h of irrigation. The device was hung
three control lines were marked perpendicular to the dripper            by a strap at the height of 1 m above the ground, with
line, whereas the line center was positioned near the dripper.          the operator walking along the sampling lines without stop-
Near the first tensiometer station, the distance between the            ping within the line. Five frequency channels (62525, 22075,
control lines (1A, 1B, 1C) was 50 cm, and near the second               7825, 2275, and 975 Hz) were used for characterizing soil
tensiometer station (2A, 2B, 2C) it was 40 cm (according to             layer depth intervals at 0–30, 0–45, 0–60, 0–75, and 0–
distance changes between the drippers so that each control              100 cm, respectively. Interpolation and spatial soil salinity
line was extended from the middle between the three rows).              mapping (in EC, dS m−1 ) were performed using SURFER
Soil sampled for laboratory salt composition and moisture               software (Surfer Ver. 7.02, 2000).
tests was taken for each control line, at a central point ad-
jacent to the dripper, and 30, 80, 180, and 330 cm distances
from the central sampling point on both sides. Together with            2.3.5    Water and salt movement mode development and
soil sampling, values of soil suction from the tensiometers                      application for soil salinization assessment and
were also measured. The first soil sampling was done at                          prediction
08:30 UTC+2 before irrigation on control lines 1A and 2A.
At 09:00 UTC+2, drip irrigation began with an intensity of              The water and salt movement model in the upper unsaturated
1.6 L h−1 and stopped at 10:15 UTC+2. At 12:15 UTC+2 im-                soil layer and up to the travertine layer was made in the HY-
mediately after the irrigation finished (2 h after irrigation           DRUS 1D software. The one-dimensional model character-
commences), sampling was done on lines 1B and 2B at the                 izes the cross section to a depth of 60 cm above the travertine
central point and 30 cm distance from it on both sides. On              layer.
23 and 24 March, a total of 30 mm of rain fell, which was                  The water and salt movement, a basic mathematical model
recorded by the rainfall automatic monitoring system.                   of one-dimensional equations for an unsaturated soil state,

https://doi.org/10.5194/gmd-15-129-2022                                                        Geosci. Model Dev., 15, 129–143, 2022
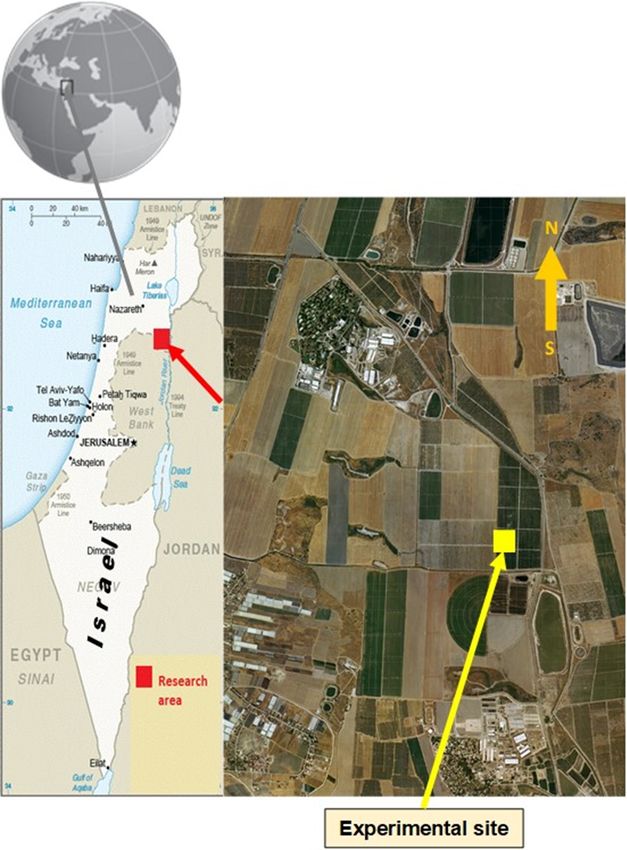
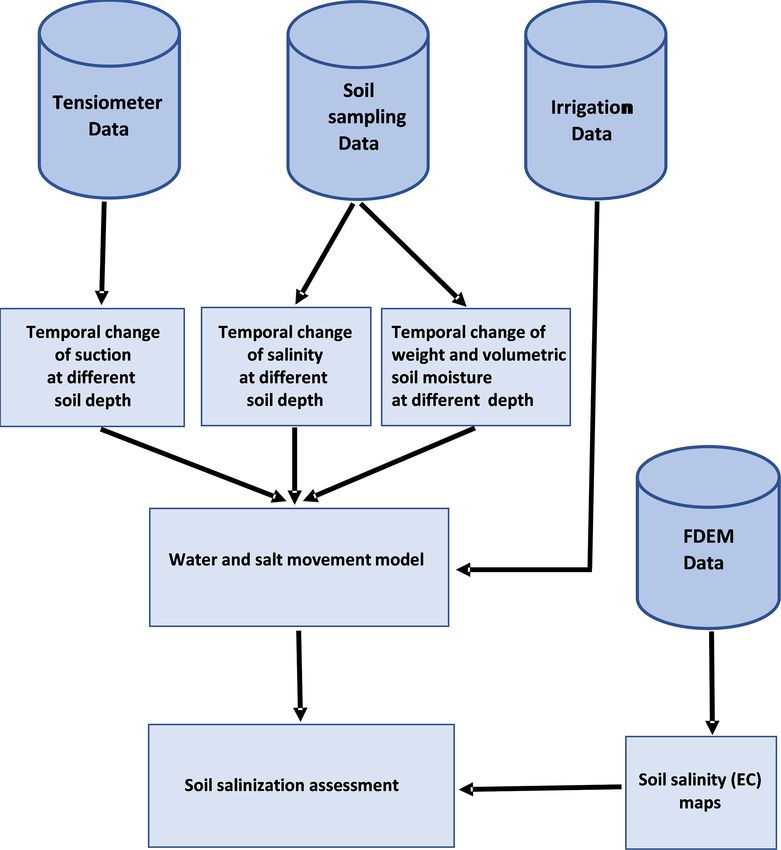
134                                                                         V. Mirlas et al.: Olive orchard salinization prevention

Figure 4. The conceptual working process applied to soil salinization assessment.

Figure 5. Transmitting tensiometer station.

Geosci. Model Dev., 15, 129–143, 2022                                                    https://doi.org/10.5194/gmd-15-129-2022
V. Mirlas et al.: Olive orchard salinization prevention                                                                          135

was                                                                  moisture increased from 0.22–0.25 to 0.33 at the top of the
                                                                     soil profile. Then, before the rainfall in mid-December, soil
∂W/∂t = ∂/∂x[K(W )(∂H /∂x)] − E(W, x),                        (1)    salinization gradually increased, and the most intense salin-
K(W ) = f (Ks, W ),                                           (2)    ization growth to 14 dS m −1 was found in the upper layer
                      ∗                                              (0–20 cm) of soil. The weight moisture values gradually de-
∂W C/∂t = ∂/∂x[D (∂C/∂x)] − ∂V C/∂x − S(C),                   (3)
                                                                     creased to 0.2–0.25, whilst the highest values were noted in
where W is volumetric moisture, H is suction, K(W ) is hy-           the upper layer of the soil profile.
draulic conductivity of unsaturated soil state, E is plant root         Near the second tensiometer station with a travertine layer
moisture absorption function, Ks is hydraulic conductivity of        depth of about 70 cm and irrigation by about 120 % of the
soil in a saturated state, C is soil solution salt concentration,    acceptable amount of irrigation (excess water), soil salinity
D ∗ is the soil salt diffusion coefficient, S is the soil salt ab-   was lower: between 2.0 and 4.0 dS m −1 . In the upper layer
sorbing (or releasing) function because of moisture changes,         (0–20 cm), soil salinity exceeded 6 dS m −1 , and after the last
and t is time.                                                       irrigation cycle at the beginning of October, it increased to
   The hydraulic model used was the van Genuchten–                   14 dS m −1 with a gradual decrease to previous values dur-
Mualem (no hysteresis) single porosity model (van                    ing November–December. The moisture weight values were
Genuchten, 1980). As a soil salinization model, Crank–               almost the same throughout the soil profile and gradually de-
Nicolson was used as a time weighting scheme (Crank and              creased from 0.35 to 0.2 during the monitoring period.
Nicolson, 1947) and the Galerkin finite scheme (Fletcher,               The SAR values under irrigation conditions of about 80 %
1983) was used for a space weighting scheme equilibrium              of the acceptable amount of irrigation ranged from 4 to 12.
model. For water movement relation with the root zone, the           The SAR values increased with soil profile depth. Under ir-
Feddes water uptake reduction model (Feddes et al., 2001)            rigation conditions of about 120 % of the acceptable amount
was used, with maximum concentration to passive root so-             of irrigation (excess water), SAR values were found to be
lute uptake of 0.5 (cRoot). The one-dimensional model cal-           lower, ranging from 3 to 6, with an increase toward the upper
culated the volumetric moisture and total salinity in a soil         soil layer.
profile down to the model’s lower boundary. In the HYDRUS               Near the first tensiometer station with a depth of about
1D software, the unsaturated layer parameters are automat-           60 cm of the travertine layer and irrigation by about 80 % of
ically determined by the soil type. The lower boundary of            the acceptable amount of irrigation (lack of water) at the end
the water movement model was calculated as a constant flow           of September, the chloride concentration was high through-
along with the travertine layer.                                     out the soil profile and ranged from 3200 to 3500 mg L−1 .
   The irrigation input to the soil profile through the model’s      At the end of the irrigation period, the chloride concentra-
upper boundary was calculated as the water supply according          tion again increased to a range of 3500–4000 mg L−1 in the
to an incremental irrigation regime. Evapotranspiration and          upper layer (20 cm). After the last irrigation cycle at the be-
transpiration values as well as root zone activity were deter-       ginning of October, the chloride concentration decreased to
mined from the field data and changed during the irrigation          1000 mg L−1 in the upper layer (20 cm). After the end of irri-
season. The models were calibrated according to the field ex-        gation, the chloride concentration again increased to a range
periment data. The calibrated model was used to assess and           of between 3500 and 4000 mg L−1 in this layer. The sul-
predict soil salinization due to irrigation with different water     fate concentration hardly changed and ranged from 300 to
quality: 3.13 dS m −1 (available today), 1.5 dS m −1 (potable        550 mg L−1 throughout the soil profile.
water), and 5.5 dS m −1 (brackish water). The time step of              Near the second tensiometer station with a travertine layer
the model was a month, and the salinity and moisture distri-         at a depth of about 70 cm and irrigation of about 120 % of
butions during this month were used as the initial conditions        the acceptable amount of irrigation (excess water), chloride
for the following month.                                             concentrations were found to be lower, ranging from 400
                                                                     to 3000 mg L−1 during the study period. The chloride con-
3     Results and discussion                                         centration increased during irrigation and decreased at the
                                                                     end of irrigation in the deeper soil layers. No clear relation-
3.1    Soil moisture and salinization dynamics in the                ship was found between the chloride concentration and the
       autumn following the intensive summer irrigation              soil moisture. The sulfate concentration ranged from 100 to
                                                                     600 mg L−1 throughout the soil profile.
Near the first tensiometer station at a depth of about 60 cm            The amount of general chalk in the soil was very high and
of the travertine layer and irrigation by about 80 % of the ac-      hardly changed during the study period. The amount of gen-
ceptable amount of irrigation (lack of water), the soil salin-       eral chalk ranged from 70 % to 85 % and did not depend on
ity was about 11–12 dS m −1 in the soil profile in September         soil moisture and irrigation regime.
(Fig. 6). After the last irrigation cycle at the beginning of
October, the soil salinity decreased to 4–8 dS m −1 through-
out the soil profile, especially in the top layer. Soil weight

https://doi.org/10.5194/gmd-15-129-2022                                                   Geosci. Model Dev., 15, 129–143, 2022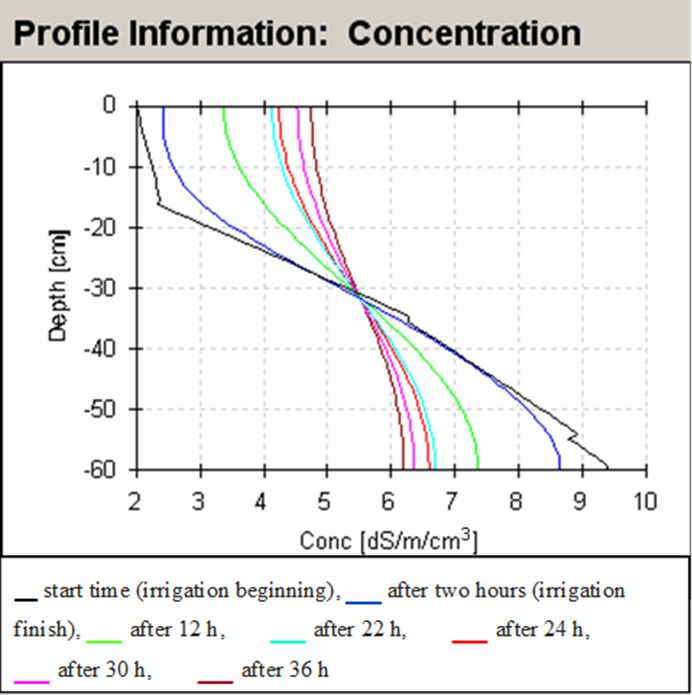
136                                                                          V. Mirlas et al.: Olive orchard salinization prevention

Figure 6. Changes in soil salinity (EC) and soil weight moisture (W) during the autumn near the first tensiometer station.

Figure 7. Changes in soil salinity (EC) and soil weight moisture (W) during the autumn near the second tensiometer station.

3.2   Assessment of drip irrigation effect on soil
      salinization

The soil suction that was measured in situ using the first ten-
siometer station is shown in Fig. 8. In station 1, the soil suc-
tion before irrigation varied from 140 to 300 mbar depending
on the depth of the measured soil layer, while after irrigation
it dropped to 40–130 mbar. Due to the highest moisture, the
maximal soil suction decrease was observed in the upper soil
layer (0–20 cm), while in the upper soil layer (0–20 cm) si-
nusoidal oscillations were observed due to daily (day–night)
changes in temperature and humidity. At other depths, once
settled, the suction had a small tendency to increase during
the study period.
   Laboratory soil salinity measurements characterized the
dissolved salt concentration in the soil saturated solution near         Figure 8. Soil suction on the different depths of the soil profile mea-
the drippers. Soil salinity near the first tensiometer station           sured at the first tensiometer station.
ranged from 1.5 dS m−1 before irrigation to 7.5 dS m−1 after
22 h from when irrigation commenced. Salinity differences

Geosci. Model Dev., 15, 129–143, 2022                                                        https://doi.org/10.5194/gmd-15-129-2022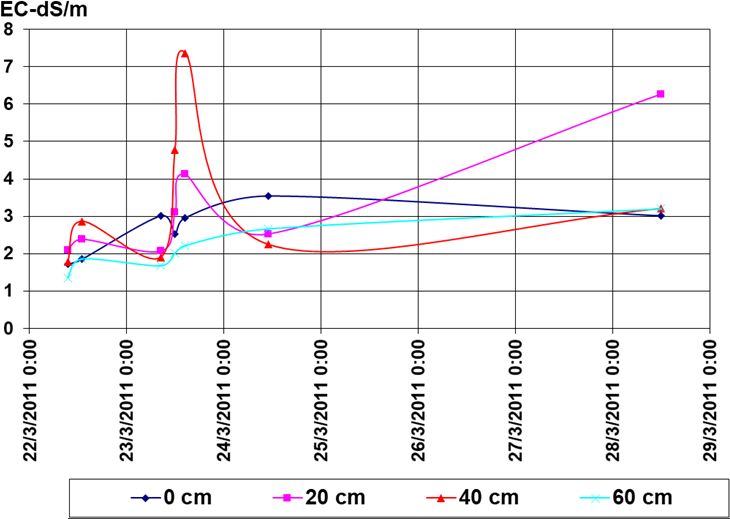
V. Mirlas et al.: Olive orchard salinization prevention                                                                            137

                                                                       Figure 10. Weighted soil moisture at different distances from the
Figure 9. Soil salinity at different soil profile depths measured at   dripper pipeline around the first tensiometer station.
the first tensiometer station.

                                                                       conditions (ECsat ). Otherwise, the correlation between soil
by depth are irregular, but the rain event on 23 March 2011            moisture and salinity is necessary. This relationship depends
was noticed at 40 cm and the increase of 20 cm during the              on the lithological and chemical composition of the local soil
following days may indicate capillary movement (Fig. 9).               profile. Figure 12 shows the correlation between the ratio of
   The highest soil salinity from 4.1 to 7.4 dS m −1 was de-           laboratory EC measurements (ECsat ) to FDEM EC measure-
tected at depths of 20–40 cm. The presence of a salinization           ments and weighted soil moisture according to soil charac-
peak in the soil layer at a depth of up to 40 cm was associ-           teristics of the study site.
ated with the leaching of salts to a depth with irrigation wa-            Thus, under a weighted soil moisture content of 0.2, the
ter. The subsequent increase in salinization of the upper soil         EC values obtained using the FDEM device (EC FDEM) will
layer was caused by the evaporative concentration of salts             be approximately 3 times lower than those measured in the
at the soil surface. SAR values varied from 9±1 to 3±1 de-             soil saturation extract laboratory measurements (EC (sat)).
pending on the depth of the soil layer, and its distribution           Provided the weighted soil moisture is greater than 0.32, EC
was like the salinity distribution. Active chalk values ranged         measurements using FDEM would be close to the laboratory
from 15 %–20 % to 30 %–33 %, with higher concentration at              soil test results.
a depth of 20–60 cm, which did not change during the ex-
periment. Weighted soil moisture ranged from 0.14 to 0.36,             3.4   Water and salt movement modeling for soil
which increased with depth.                                                  salinization prediction of different irrigation water
   During the study, the period-averaged weighted soil mois-                 quality
ture varied from 0.25 to 0.30, with a dependency on distances
from the dripper with an affected radius of up to 30 cm. Soil          Fitting the model to the study site conditions was based on
moisture increased with irrigation right away in the upper soil        comparing the model calculation results with measurements
layer under the dripper from 0.14 to 0.37 after 2 and 22 h; af-        taken during the field experiment. The comparison was made
ter irrigation stopped it decreased to 23 % (Fig. 10).                 for soil volumetric moisture and soil salinity values in EC.
                                                                       The best fit between model calculation and soil mechanical
3.3   Soil salinity mapping using FDEM device                          composition field measurements was obtained for the silty
                                                                       clay type soil (Fig. 2). The volumetric moisture model cal-
EC values obtained from FDEM measurements character-                   ibration was like the calculated results (Fig. 13). The hy-
ize the dissolved salt amount and soil moisture. The maps              draulic conductivity of the soil saturated conditions accord-
show the salt flushing area progressing to a depth of 50–              ing to the model was 0.02 cm h−1 .
60 cm (Fig. 11). The salt flushing area width was about 0.5 m,            Differences between soil volumetric moisture measured in
demonstrating EC lower than 2 dS m−1 and reaching EC val-              the field and calculated in the model were maximal −0.0187
ues of 2.5 dS m−1 between rows. At a depth of 60–80 cm, the            (5.9 % of the measured), minimal −0.0029 (0.88 %), and on
soil salinity had a maximum of 2.5–3.0 dS m−1 . The traver-            average −0.0077 (2.39 %). The soil salinity values calculated
tine layer from a depth of 80 cm is probably dry, which does           in the model were similar to the salinity distribution obtained
not enable ion movement; this appears as very low salinity             from the soil samples at the study site. However, differences
values. This suggests that for matching EC values with lab-            between soil salinity measured in the field and the one cal-
oratory results, the FDEM strata should be in full saturation          culated in the model ranged from 34 % to 11 % and were on

https://doi.org/10.5194/gmd-15-129-2022                                                     Geosci. Model Dev., 15, 129–143, 2022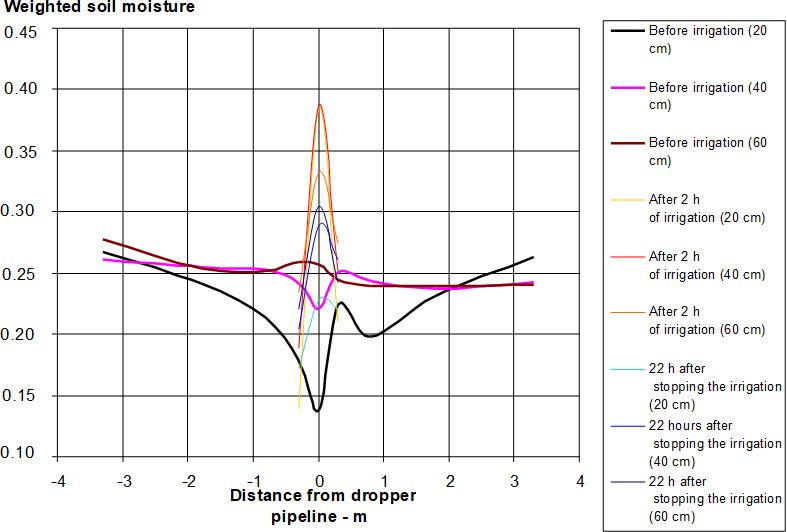
138                                                                            V. Mirlas et al.: Olive orchard salinization prevention

Figure 11. FDEM EC values for the different depths of the soil profile from the soil surface: (a) up to 30 cm; (b) up to 45 cm; (c) up to 60 cm;
(d) up to 70 cm; (e) up to 100 cm.

average −28.8 % (1.08 (dS m−1 )). This is because the soil                changes in soil suction. Moisture increased immediately af-
salt movement model did not include the salts’ release and                ter irrigation in the upper soil layer from 0.33 to 0.36 al-
absorption processes in the soil. Soil suction, according to              most to a saturated state. After 2 h (end of irrigation) the
the calibrated model calculations, decreased in the upper soil            moisture began decreasing. The results in the model show
layer (up to 20 cm of depth) immediately after the irrigation             that in the deep layers (below 30 cm from the soil surface)
began.                                                                    the moisture continued to decrease, probably due to a rather
   In deeper layers, it started after 2 h, while 12 h after ir-           small amount of water and irrigation span. As a result of irri-
rigation ended soil suction began to rise owing to soil dry-              gation by relatively saline water (3.13 dS m−1 ), soil salinity
ing. Changes in volume soil moisture were consistent with                 (salt concentration) increased in the upper soil layer (up to

Geosci. Model Dev., 15, 129–143, 2022                                                         https://doi.org/10.5194/gmd-15-129-2022
V. Mirlas et al.: Olive orchard salinization prevention                                                                              139

Figure 12. Correlation between the ratio of EC (sat) to EC FDEM
and the weighted soil moisture at the Kibbutz Meirav mature olive
plantation test site.

                                                                     Figure 14. Changes in soil salinity in the soil profile calculated in
                                                                     the model. Calibration results of the model.

                                                                     Figure 15. Changes in salt concentration calculated in the model at
Figure 13. Comparison of volumetric moisture values measured in      the upper model boundary (TOP), at the root zone bottom (about
a study section with computerized values in the model. Model cali-   35 cm from the ground surface) (ROOT), and the lower model
bration results.                                                     boundary (BOT).

30 cm of depth) but decreased at the bottom of the soil profile      9.2 to 6.2 dS m−1 , which is probably related to the horizon-
(Fig. 14). In both model and field measurements, the border          tal movement of water together with dissolved salts from the
between these opposite salinity dynamics approximately cor-          dripper to the travertine layer.
responded to the root system depth, as intensive development            The soil-salinity-calibrated model simulates soil salinity
of trees appears at depths below 35 cm.                              patterns, with different water quality irrigation between April
   Figure 15 shows the process of salts accumulating (or             and December. The data input to the model for calculating
washing away) at the model’s outer boundaries. Near the              the irrigation duration per day and daily evapotranspiration
soil surface at the TOP boundary, the salt concentration ini-        included the olive plantation irrigation and daily evaporation
tially decreased due to soil washing by irrigation, and after        as well as evapotranspiration from the Eden Farm meteoro-
irrigation finished it gradually increased over 36 h owing to        logical station (Table 2).
evaporation from 2.5 to 4.7 dS m−1 . At the root zone bot-              Initial salt concentration values in the model soil profile
tom (ROOT boundary), the salt concentration was constant,            (the 1 April) were taken from the field experiment soil sam-
with a small tendency to decrease. The salt concentration at         pling results. Soil profile and salt accumulation predictions
the lower model boundary (BOT) gradually decreased from              during the irrigation season show that under current water

https://doi.org/10.5194/gmd-15-129-2022                                                    Geosci. Model Dev., 15, 129–143, 2022
140 V. Mirlas et al.: Olive orchard salinization prevention
Table 2. Irrigation and evaporation data used in the model.
Month Date Days Hours Irrigation Irrigation Irrigation Daily
from start from start duration (hours) (mm) (mm h−1 ) evaporation (mm)
April 0–10 10 240 7 2 0.286 2.00
11–20 20 480 7 2 0.286 2.00
21–30 30 720 10.6 3.02 0.285 3.02
May 0–10 40 960 12.9 3.69 0.286 3.69
11–20 50 1200 12.9 3.69 0.286 3.69
21–31 61 1464 17.6 5.01 0.285 5.01
June 0–10 71 1704 13.5 3.85 0.285 3.85
11–20 81 1944 13.5 3.85 0.285 3.85
21–30 91 2184 13.8 3.93 0.285 3.93
July 0–10 101 2424 13.8 3.93 0.285 3.93
11–20 111 2664 13.8 3.93 0.285 3.93
21–31 122 2928 12.8 3.66 0.286 3.66
August 0–10 132 3168 14.1 4.02 0.285 4.02
11–20 142 3408 16.7 4.75 0.284 4.75
21–31 153 3672 13.9 3.97 0.286 3.97
September 0–10 163 3912 13.9 3.97 0.286 3.97
11–20 173 4152 13.9 3.97 0.286 3.97
21–30 183 4392 10.1 2.88 0.285 2.88
October 0–10 193 4632 9.3 2.66 0.286 2.66
11–20 203 4872 9.3 2.66 0.286 2.66
21–31 214 5136 4 1.15 0.288 1.15
November 0–10 224 5376 3.6 1.02 0.283 1.02
11–20 234 5616 3.6 1.02 0.283 1.02
21–30 244 5856 1.2 0.34 0.283 0.34
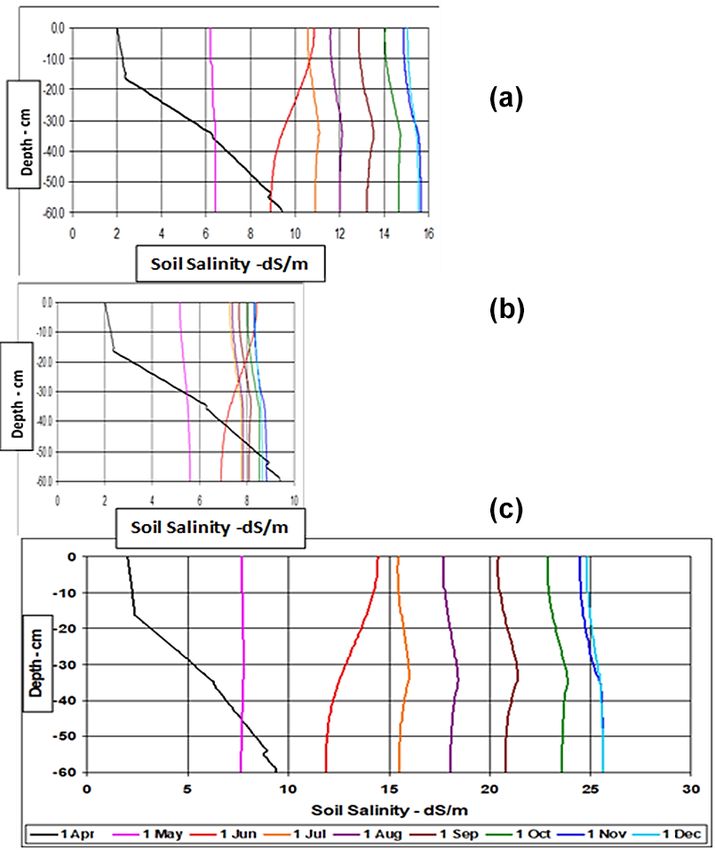
quality conditions (3.13 dS m−1 ) soil salinity may rise to 15– ment of calcritic soils in an irrigated olive plantation in the
16 dS m−1 (Fig. 16a). The most intense soil salinity change Beit She’an Valley. Under the existing drip irrigation regime,
from 2.0 to 4.0 dS m−1 per month was in June, immediately water with a dissolved salt content of 3.13 dS m−1 , and the
after irrigation increased. The model calculation results are presence of an impermeable travertine layer close to the soil
consistent with soil salinity monitoring during 2011 (Fig. 6). surface, the salinization process is characterized by salt ac-
Irrigation by potable water (Fig. 16b) reduced soil salinity to cumulation tendency in the trees’ upper root zone after the
7–9 dS m−1 . summer irrigation season. During irrigation, the soluble salts
Irrigation by brackish water during the summer months are rapidly leached in the soil layer upper 20–30 cm down to
(Fig. 16c) caused substantial increases in soil salinity, reach- the dripper depth and sides. However, within 24 h after the
ing a very high EC value of about 24–26 dS m−1 . Irrigat- irrigation cycle completion, as the soil dries through evapo-
ing with such water during the summer months might in- transpiration the soil salinity level near the surface begins to
crease EC in 2–3 dS m−1 per month on average owing to increase again.
salt accumulation in the soil profile. Brackish water irriga- The FDEM device made it possible to study the dissolved
tion (EC>5 dS m−1 ) might cause the entire soil profile to turn salts’ spatial distribution and concentration, with reference
saline to a point that could harm the trees. to the soil’s existing weight moisture distribution at the time
of measurement. The FDEM EC maps show the salt flush-
ing area development at a depth of 50–60 cm and a width of
4 Conclusions ∼50 cm. The soil salinity and moisture field sampling com-
bination and the FDEM measurements demonstrated corre-
The combined use of various research methods, including lation in EC for a given soil type. This relationship indi-
soil salinity monitoring, field experiments, remote sensing cates that the soil FDEM salinity mapping accuracy and cost-
(FDEM), and water and salt movement modeling in the un-
saturated soil profile, allowed salinization process assess-
Geosci. Model Dev., 15, 129–143, 2022 https://doi.org/10.5194/gmd-15-129-2022V. Mirlas et al.: Olive orchard salinization prevention 141
Figure 16. Salt accumulation predictions in the soil during the irrigation season under different water salinity: (a) 3.13 dS m−1 (available
today); (b) 1.5 dS m−1 (potable water); (c) 5.5 dS m−1 (brackish water).
effective upscaling potential will probably turn it into a stan- Supplement. The supplement related to this article is available on-
dard method in future agriculture. line at: https://doi.org/10.5194/gmd-15-129-2022-supplement.
The one-dimensional model created for water and dis-
solved salt transport showed the danger of using brackish
water for irrigation. Since soil salinization exceeds an accept- Author contributions. VM designed and carried out the field exper-
able level for trees, the use of potable water for irrigation, if iments and performed the HYDRUS simulations. NG designed and
possible, will help to reduce soil salinization. To enable a carried out the field experiments and performed measurements and
mapping of the soil electrical conductivity using an FDEM device.
tailor-made irrigation scheme, a database including changes
AA did the irrigation data processing, and YA analyzed the results
in physical and chemical parameters affecting soil salting and prepared the paper with contributions from all co-authors.
processes should be established, which will enable contem-
porary mapping and salinity forecasting as well as the effect
of hydrochemical factors on various soil and irrigation con- Competing interests. The contact author has declared that neither
ditions for the database-specific region. they nor their co-authors have any competing interests.
Code and data availability. Data and code are available in the Sup-
plement.
https://doi.org/10.5194/gmd-15-129-2022 Geosci. Model Dev., 15, 129–143, 2022142 V. Mirlas et al.: Olive orchard salinization prevention
Disclaimer. Publisher’s note: Copernicus Publications remains 24 March 1998, Israel Geog. Soc., Tel-Aviv, Israel, 128–129,
neutral with regard to jurisdictional claims in published maps and 1998.
institutional affiliations. Benyamini, Y., Marish, S., Mirlas, V., and Gotesman, M.: Impact of
Subsurface Drainage on Groundwater Regime in Irrigated Fields
in Israel, in: Proc. Inter. Conf. “Water and Environment: Resolv-
Acknowledgements. This article is based on the results of scien- ing Conflicts in the Development of Dry Lands”, Beer-Sheba,
tific research carried out as project 855-0066-12 “Identification and The Center for Water Science and Technology (CWST), Ben-
assessment of soil salinization risk as a result of agricultural activ- Gurion University of the Negev, Israel, 4–7 June, 56–57, 2000.
ity in the Beit She’an Valley” by a team of researchers and techni- Benyamini, Y., Mirlas, V., Marish, S., Gotesman M., Fizik, E., and
cal personnel of the Soil Erosion Research Station of the Ministry Agassi, M.: A survey of soil salinity and groundwater level con-
of Agriculture and Rural Development (MOAG), Israel: Vladimir trol systems in irrigated fields in the Jezre’el Valley, Israel, J.
Mirlas (main researcher), Naftaly Goldshleger (researcher), Asher Agricultural Water Management, 76, 181–194, 2005.
Aizenkod (researcher, field survey center, MOAG), Roei Ben- Bhardwaj, A. K., Mandal, U. K., Bar-Tal, A., Gilboa, A., and
Binyamin (technician), Yochai Barnay-Betsalel and Moshe Gottes- Levy, G. J.: Replacing saline-sodic irrigation water with treated
man (technicians), and Ivan Sapogineth (technician, the Eastern wastewater: effects on saturated hydraulic conductivity, slaking
R&D Center, Ariel University). and swelling, J. Irrigation Science, 26, 139–146, 2008.
The authors particularly thank the technical team of the SERS and Boone, A., Samuelsson, P., Gollvik, S., Napoly, A., Jarlan, L., Brun,
the Eastern R&D Center, Ariel University: Roei Ben-Binyamin, E., and Decharme, B.: The interactions between soil–biosphere–
Yochai Barnay-Betsalel, Moshe Gottesman, Efraim Fizik, and Ivan atmosphere land surface model with a multi-energy balance
Sapogineth for their assistance in the field investigations. (ISBA-MEB) option in SURFEXv8 – Part 1: Model description,
The authors wish to thank David Wilson, Ruishan Chen, Douglas Geosci. Model Dev., 10, 843–872, https://doi.org/10.5194/gmd-
Karlen, and also the two anonymous reviewers for their helpful con- 10-843-2017, 2017.
tribution to the paper. Celia, M. A., Bououtas, E. T., and Zarba, R. L.: A general mass-
The paper is dedicated to our friend Naftali Goldshleger, who conservative numerical solution for the unsaturated flow equa-
passed away in 2019. tion, Water Resour. Res., 26, 1483–1496, 1990.
CIA: The world factbook, Israel, picture inventory, available at:
https://www.cia.gov/the-world-factbook/countries/israel/, last
Financial support. This research has been supported by the Min- access: 12 June 2021.
istry of Agriculture and Rural Development (MOAG), Israel (grant Corwin, D. L. and Lesch, S. M.: Apparent soil electrical conductiv-
no. 855-0066-12), and the Jewish National Fund (KKL–JNF) (grant ity measurements in agriculture, Computer Electronics in Agri-
no. 855-0066-12). culture, 46, 11–43, 2005.
Crank, J. and Nicolson, P.: A practical method for numerical eval-
uation of solutions of partial differential equations of the heat-
conduction type, P. Camb. Philos. Soc., 43 pp., 50–67, 1947.
Review statement. This paper was edited by Bethanna Jackson and
Farifteh, J., van der Meer, F., Atzberger, C., and Carranza, E. J. M.:
reviewed by two anonymous referees.
Quantitative analysis of salt-affected soil reflectance spectra: A
comparison of two adaptive methods (PLSR and ANN), Remote
Sens. Environ., 110, 59–78, 2007.
References Feddes, R., Hoff, H., Bruen, M., Dawson, T., de Ros-
nay, P., Dirmeyer, P., Jackson, R. B., Kabat, P., Klei-
Abu Awward, A., M.: Influence of different water quantities and don, A., Lilly, A., and Pitman, A. J.: Modeling root wa-
qualities on lemon trees and soil salt distribution at the Jordan ter uptake in hydrological and climate models, B. Am.
Valley, J. Agricultural Water Management, 52, 53–71, 2001. Meteorol. Soc., 82, 2797–2809, https://doi.org/10.1175/1520-
Bear, J.: Dynamics of Fluid in Porous Media, Elsevier, New York, 0477(2001)0822.3.CO;2, 2001.
NY, 39–63, 1972. Fletcher, C.: Computational Galerkin Methods, Springer-Verlag
Ben Dor, Y., Metternicht, G., Goldshleger, N., Mor, E., Mirlas, V., New York Inc, 303 pp., https://doi.org/10.1007/978-3-642-
and Basson, U.: Review of remote sensing-based methods to as- 85949-6, 1983.
sess soil salinity, in: Remote sensing of soil salinization, Impact Flexer, A., Anker, Y., Davidson, L., Rosenthal, E., Yellin-Dror, A.,
on land management, edited by: Metternicht, G. and Zinck, J. A., and Guttman, J.: Groundwater salinization in the Jordan Valley –
CRC Press, Taylor and Francis Group, LLC, New York, USA, Quo Vadis, in: Water in the Middle East, edited by: Hambright,
39–63, https://doi.org/10.1201/9781420065039, 2009a. K. D., Ragep, F. J., and Ginat, J., University of Oklahoma Press:
Ben Dor, Y., Goldshleger, N., Mor, E., Mirlas, V., and Basson, U.: Norman, 100–110, 2006.
Combined active and passive remote sensing methods for as- Gafni, A. and Salinger, Y.: Hydraulic and salinity regime of two
sessing soil salinity: a case study from Jezre’el Valley, Northern affected sites in the Jezre’el Valley, Israel, J. Hydrol. Proc., 6,
Israel, in: Remote sensing of soil salinization, Impact on land 55–65, 1992.
management, edited by: Metternicht, G. and Zinck, J. A., CRC Garrigues, S., Olioso, A., Carrer, D., Decharme, B., Calvet,
Press, Taylor and Francis Group, LLC, New York, USA, 236– J.-C., Martin, E., Moulin, S., and Marloie, O.: Impact of
253, https://doi.org/10.1201/9781420065039, 2009b. climate, vegetation, soil and crop management variables on
Benyamini, Y., Marish, S., Mirlas, V., and Gotesman, M.: Soil multi-year ISBA-A-gs simulations of evapotranspiration over a
Salinization and Rehabilitation, in: Proc., The Ann. Meeting, 22–
Geosci. Model Dev., 15, 129–143, 2022 https://doi.org/10.5194/gmd-15-129-2022V. Mirlas et al.: Olive orchard salinization prevention 143 Mediterranean crop site, Geosci. Model Dev., 8, 3033–3053, Pandit, R., Parrotta, J. A., Chaudhary, A. K., Karlen, D. L., Mas- https://doi.org/10.5194/gmd-8-3033-2015, 2015. cia Vieira, D. L., Anker, Y., Chen, R., Morris, J., Harris, J., and Guimberteau, M., Zhu, D., Maignan, F., Huang, Y., Yue, C., Dantec- Ntshotsho, P.: Responses to halt land degradation and to restore Nédélec, S., Ottlé, C., Jornet-Puig, A., Bastos, A., Laurent, P., degraded land, in: IPBES Assessment Report on Land Degrada- Goll, D., Bowring, S., Chang, J., Guenet, B., Tifafi, M., Peng, tion and Restoration, edited by: Montanarella, L., Scholes, R. J., S., Krinner, G., Ducharne, A., Wang, F., Wang, T., Wang, X., and Brainich, A., 435–528, UNEP, UNDP, FAO, Geneva, United Wang, Y., Yin, Z., Lauerwald, R., Joetzjer, E., Qiu, C., Kim, H., Nations, 2018. and Ciais, P.: ORCHIDEE-MICT (v8.4.1), a land surface model Pandit, R., Parrotta, J. A., Chaudhary, A. K., Karlen, D. L., Luis, for the high latitudes: model description and validation, Geosci. D., Vieira, M., Anker, Y., Chen, R., Morris, J., Ntshotsho, P., Model Dev., 11, 121–163, https://doi.org/10.5194/gmd-11-121- Pandit, R., Parrotta, J. A., Chaudhary, A. K., Douglas, L., Luis, 2018, 2018. D., Vieira, M., Anker, Y., Chen, R., Morris, J., and Harris, J.: Katz, H., Farber, R., Chaniel, G., Ankar, Y., Cohen, H., and Ca- A framework to evaluate land degradation and restoration re- han, R.: Rhamnolipid-enhanced Pseudomonas putida biofilm sponses for improved planning, Ecosyst. and People, 15, 1–18, formation on hydrophilic surfaces with toluene as the bac- 2020. terium’s sole carbon source, Int. Biodeterior. Biodegr., 127, 87– Simunek, J. and van Genuchten, M. T.: Numerical model for sim- 94, https://doi.org/10.1016/j.ibiod.2017.11.019, 2018. ulating multiple solute transport in variably-saturated soil, in: Kool, J. B., Parker, J. C., and van Genuchten, M. T.: Determining Proc. “Water Pollution III: Modeling, Measurement, and Predic- soil hydraulic properties from one-step outflow experiments by tion”, edited by: Wrobel, L. C. and Latinopoulos, P., Computa- parameter estimation: I, Theory and numerical studies, Soil Sci. tion Mechanics Publ, Ashurst Lodge, Ashjur, Southamption, UK, Soc. Am. J., 49, 1348–1354, 1985. 21–30, 1995. Kruseman, G. P. and De Ridder, N. A.: Analysis and Evaluation of Simunek, J., Sejna, M., and van Genuchten, M. T.: The HYDRUS- Pumping Test Data, International Institute for Land Reclamation 1D software package for simulating the one-dimensional move- and Improvement/ILRI, Wageningen, International Institute for ment for water, heat, and multiple solutes in variably-saturated Land Reclamation, The Netherlands, 18–20 pp., 1976. media, version 2.0, IGWMC-TPS 70. U.S., Salinity laboratory, Leij, F. G., Skaggs, T. H., van Genuchten, M. T.: Analytical so- Agricaltural Research Service, U.S. Department of Agriculture, lutions for solute transport in three-dimensional semi-infinite Riverside, California, 1998. porous media, Water Resour. Res., 27, 2719–2733, 1991. Surfer Ver.7.02, Surface Mapping System, Golden Software, Machado, R. M. A. and Serralheiro, R.: Soil Salinity: Ef- Inc., available at: https://www.goldensoftware.com/products/ fect on Vegetable Crop Growth, Management Practices to surfer (last access: 12 June 2021), 2000. Prevent and Mitigate Soil Salinization, Horticulturae, 3, 30, Survey of Israel, National orthophoto layer 0.5 m resolution, avail- https://doi.org/10.3390/horticulturae3020030, 2017. able at: https://www.govmap.gov.il/?c=204000,595000&z=0& Mandal, U. K., Bhardwaj, A. K., Warrington, D. N., Goldstein, D., b=2, last access: 6 December 2021. Bar-Tal, A., and Levy, G. J.: Changes in soil hydraulic conduc- Toride, N., Leij, F. J., and van Genuchten, M. T.: A comprehensive tivity, runoff, and soil loss due to irrigation with different types set of analytical solution for no equilibrium solute transport with of saline-sodic water, Geoderma, 144, 509–516, 2008a. first-order decay and zero-order production, Water Resour. Res., Mandal, U. K., Warrington, D. N., Bhardwaj, A. K., Bar-Tal, A., 29, 2167–2182, 1993. Kautsky, L., Minz, D., and Levy, G. J.: Evaluating impact if ir- van Genuchten, M. T.: A Closed-form Equation for Pre- rigation water quality on a calcareous clay soil using principal dicting the Hydraulic Conductivity of Unsaturated component analysis, Geoderma, 144, 189–197, 2008b. Soils, J. Soil Science Society of America, available at: Mirlas, V.: Assessing soil salinity hazard in cultivated areas using https://doi.org/10.2136/sssaj1980.03615995004400050002x, MODFLOW model and GIS tools: A case study from the Jezre’el 1980. Valley, Israel, J. Agriculture Water Management, 109, 144–154, van Genuchten, M. T.: A numerical model for water and solute 2012. movement in and below the root zone, Research Report No Mirlas, V., Benyamini, Y., Gottesman, M., Fizik, E., and Agassi, M.: 121, U.S. Salinity laboratory, USDA, ARS, Riverside, Califor- Long-term changes in groundwater regime of a semi-confined nia, 1987. aquifer in Jezre’el Valley, Israel, J. Soil Water Conserv., 1, 98– van Genuchten, M. T. and Wagenet, R. J.: Two-site/two region mod- 112, 2006a. els for pesticide transport and degradation: Theoretical develop- Mirlas, V., Benyamini, Y., Miron, M., Peres, M., and Yasur, E.: ment and analytical solutions, Soil Sci. Soc. Am. J., 53, 1303– Development of groundwater flow and salt transport models for 1310, 1989. the non-saturation zone of the soil in the Hula Valley, Annual Wada, Y., Flörke, M., Hanasaki, N., Eisner, S., Fischer, G., Tram- meeting of the Israel Geography Society, 1–3 January 2006, berend, S., Satoh, Y., van Vliet, M. T. H., Yillia, P., Ringler, Jerusalem, Israel, 63–64, 2006b, (in Hebrew). C., Burek, P., and Wiberg, D.: Modeling global water use for Mohammad, M., J. and Mazahreh, N.: Changes in soil fertility the 21st century: the Water Futures and Solutions (WFaS) ini- parameters to irrigation of forage crops with secondary treated tiative and its approaches, Geosci. Model Dev., 9, 175–222, wastewater, J. Communication in Soil Science and Plant Analy- https://doi.org/10.5194/gmd-9-175-2016, 2016. sis, 34, 1281–1294, 2003. https://doi.org/10.5194/gmd-15-129-2022 Geosci. Model Dev., 15, 129–143, 2022
You can also read