Isoconversional Model of Kinetics of Thermally Induced Processes in Chalcogenide Glass Sb37S48I15
←
→
Page content transcription
If your browser does not render page correctly, please read the page content below
ACTA PHYSICA POLONICA A                                                            No. 3     Vol. 140     (2021)

                         Isoconversional Model of Kinetics of
                             Thermally Induced Processes
                           in Chalcogenide Glass Sb37 S48 I15

                                   R.R. Raonić∗ , N.M. Ćelić,
                             S.R. Lukić-Petrović and G.R. Štrbac
     University of Novi Sad, Faculty of Sciences, Department of Physics,
     Trg Dositeja Obradovića 4, 21000 Novi Sad, Serbia

                                   Received: 02.06.2021 & Accepted: 01.09.2021

                                                                  ∗
     Doi: 10.12693/APhysPolA.140.235                                  e-mail:   rados.raonic@df.uns.ac.rs

     In this paper, we have made isoconversional modeling and analyses of kinetics of thermally induced
     processes for Sb37 S48 I15 chalcogenide glass. The non-isothermal differential scanning calorimetry was
     used and for four different heating rates the corresponding curves were obtained with this method. The
     change in the apparent activation energy with the extent of conversion for three thermally induced
     processes (glass transition, crystallization and melting) was analyzed by using two different isoconver-
     sional methods — the isoconversional form of Kissinger model and the Vyazovkin method. The values
     of activation energy during the glass transition indicated the domination of cooperative movements of
     structural units while the decrease of this parameter with temperature (the extent of conversion) implied
     that these movements are becoming freer. The found dynamic fragility index value of m = 23.2(10)
     indicated that significant configuration changes are not present near the glass transition temperature.
     Crystallizations of two structural units, SbSI and Sb2 S3 , were detected. For SbSI, the activation energy
     increased from Eα = 103 eV for the extent of conversion of α = 5% to Eα = 162 eV for the extent of
     conversion of α = 95%. This is related to the influence of the initial stage of parallel crystallization of
     the new structural unit Sb2 S3 . Activation energy for crystallization of Sb2 S3 changed from Eα = 140 eV
     to Eα = 167 eV for the same values of the extent of conversion. A small change in energy indicates a
     volume nucleation with a constant number of nuclei. The isoconversional analysis of melting of SbSI has
     shown that the activation energy decreased with the extent of conversion from Eα = 526 eV (α = 4%)
     to Eα = 341 eV (α = 96%) and that it was not a single-step process. The results from both applied
     methods were in agreement.
     topics: heat capacity, crystallization, glass transitions, differential thermal analysis (DTA)

                 1. Introduction                              certain elements, their properties can significantly
                                                              change and application possibilities are particularly
   Chalcogenide glasses have attracted great atten-           increased [9–15].
tion over the years and have often been the subject              Specifically, chalcogenide glasses containing Sb
of research because of their interesting properties           are of importance because of their potential ap-
which make them attractive for different applica-             plications in thermal imaging, nonlinear optics and
tions. These applications include materials for elec-         lasers [16]. Their thermal properties (thermal sta-
tronic elements in telecommunication systems [1]              bility and glass forming ability) can vary with
such as devices tailored for high speed signal pro-           Sb concentration [17]. Some chemical elements,
cessing [2], infrared materials for night vision [3],         among which is Sb, are found to modify chalco-
electrical switching phenomenon which can poten-              genide glasses at the nanoscale, inducing signifi-
tially be used for information storage, power con-            cant changes in their physical properties and mak-
trol, phase change memories (PCM) [4] and many                ing those chalcogenide alloys attractive materials
more. They are primarily investigated for their               for many applications, including (nano)optics and
optical and electrical qualities (optical parameters          (nano)electronics [18–21]. Several researches have
such as optical band gap and refractive index, trans-         reported that the potential candidates for new gen-
parency in visible and infrared spectrum, electri-            eration narrow-bandgap media can be engineered on
cal conductivity) [1, 5–8]. If they are alloyed with          the basis of chalcogenide glasses (ChGs) modified at

                                                        235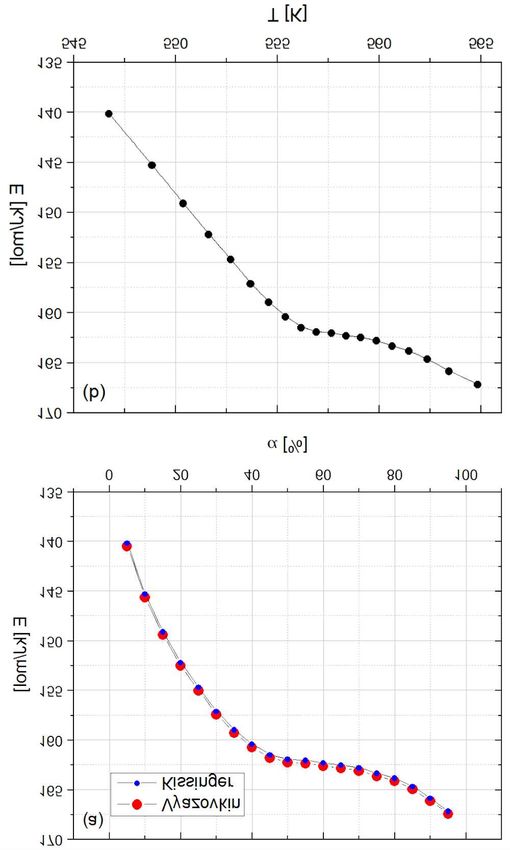
R.R. Raonić et al.

the nanoscale by Bi, Sb, and Ga dopants [22–24].              transition temperature. According to Angell’s the-
The Bi and Sb are even reported to convert some               ory, they do not belong to the strong liquids, for
chalcogenide glasses generally highly insensitive to          which m ≈ 16 [36, 37].
metal doping into n-type semiconductors [25, 26].
All of the above applications rest on the effects
of formation of ordered regions of desired size and                             2. Experiment
concentration in the amorphous matrix by modify-
ing the process of their synthesis or using external             According to the protocol by which the syntheses
impacts, such as thermal treatment [27].                      of the other glasses from the system were done ear-
   For chalcogenide glasses containing Sb, there is           lier [34, 35], the investigated Sb37 S48 I15 glass was
a possibility of thermal induction of ferroelectric           prepared using the melt–quenching technique. The
centers SbSI, which makes them promising glass–               sample was synthesized from elementary compo-
ceramics materials for future applications. Some              nents of purity starting from 99.99%, manufactured
antimony sulphoiodide (SbSI) properties distin-               by Sigma–Aldrich. The measured masses were
guish this chalcogenide compound from other fer-              based on the calculations for the synthesis of 8 g of
roelectrics and make it suitable for use in uncooled          the sample, and analytical balance METTLER B-6
pyrooptic and pyroelectric infrared detectors: high           with the accuracy of ±5 × 10⁻⁸ kg was used. The
values of the dielectric constant, spontaneous po-            samples were placed and sealed in cylindrical quartz
larization, and pyroelectric and pyrooptic coeffi-            ampoules, and evacuated to a pressure of 10−3 Pa.
cients [28–30]. Consequently, examination of ther-            They were then exposed to a cascade heating tem-
mally induced processes in chalcogenide glasses con-          perature program and air-quenched.
taining Sb is of large importance. As it is usually              The heating rate in the first stage was 100 K/h.
the case, all these properties are highly dependent           After heating the elementary components from
on the preparation conditions and ratio of their              room temperature to 473 K, they were maintained
components.                                                   on that temperature plateau for the next 4 h. In all
   Unfortunately, Sb–S–I type glasses can be ob-              other stages, heating rates were 50 K/h, and the
tained in a relatively narrow range of ratios of con-         next two plateaus were at 673 K and 823 K with
centrations by the cooling method and the sto-                the retention of 3 h. The last plateau corresponds
ichiometric composition of the ferroelectric SbSI             to a maximum synthesis temperature of 923 K and
compound lies outside of the Sb–S–I system glass-             at this temperature the ampoule was maintained
forming region. Investigations of the existence of            for more than 12 h. From this maximum synthesis
the glass phase in the three-component Sb–S–I sys-            temperature, the ampoule was taken out into the
tem [31] have determined that compact glass can be            air, and then placed in a thermally inert material
obtained in a narrow area, of an island character,            (Al2 O3 powder) for annealing and reducing of me-
in the vicinity of the composition Sb37 S48 I15 . The         chanical stresses in the material.
phase diagram from this system was determined by                 The differential scanning calorimetry (DSC) mea-
Turjanica and Koperles [32].                                  surement was done using a Mettler Toledo 822 de-
   In this paper, thermally induced processes are             vice, which is operational from room temperature
analyzed using an isoconversional model. Isocon-              to 973 K, with temperature measurement preci-
versional analysis provides a deeper insight into             sion of 0.2 K. Samples with mass of about 10 mg
the nature of the glasses themselves. In terms                were placed in aluminium pans (volume of pans
of the chemical nature of glass, there are two ex-            was 40 µl) and measurements were done for four
tremes: molecular liquids with weak isotropic forces          different heating rates, in the nitrogen atmosphere.
and strong liquids with dominant covalent networks            Nitrogen flow during measurement was 50 ml/min.
characterized by strong directional bonds. These              The samples were selected to have at least one flat
two extreme configurations exhibit very different             surface, in order to enable contact with the bottom
molecular motions and configuration changes dur-              of the pan, and through it, with the ceramic FRS5
ing the glass transition process. The molecular               sensor of the device. The obtained DSC curves were
liquids are usually modeled as continuum char-                further analyzed using the Star Software. Mathe-
acterized by mean isotropic force field in which              matical analysis of the obtained data was done in
an increase of free-volume significantly facilitates          Wolfram Mathematica and Origin programs.
the movement of structural units. On the other                   In order to confirm the crystallized structural
hand, strong liquids have rigid covalent bonds and            units after exposing the sample to the appropri-
well-defined short-range in which breaking of co-             ate temperature program, an X-ray diffraction spec-
valent bonds dominates the structural units’ mo-              trum was recorded. The XRD was carried out us-
tions [33]. Based on the values of the fragility              ing Rigaku MiniFlex 600 instrument, with CuKα
parameter, m, previous analyses of the kinetics               radiation.
of thermally induced processes in the examined                   Thermally induced processes by DSC were con-
glass [34, 35] and other glasses from the same sys-           sidered using the isoconversional analysis. The rela-
tem, it was shown that these glasses do not exhibit           tion that describes the rate of thermally stimulated
large configuration changes right above the glass             processes is [38, 39]

                                                        236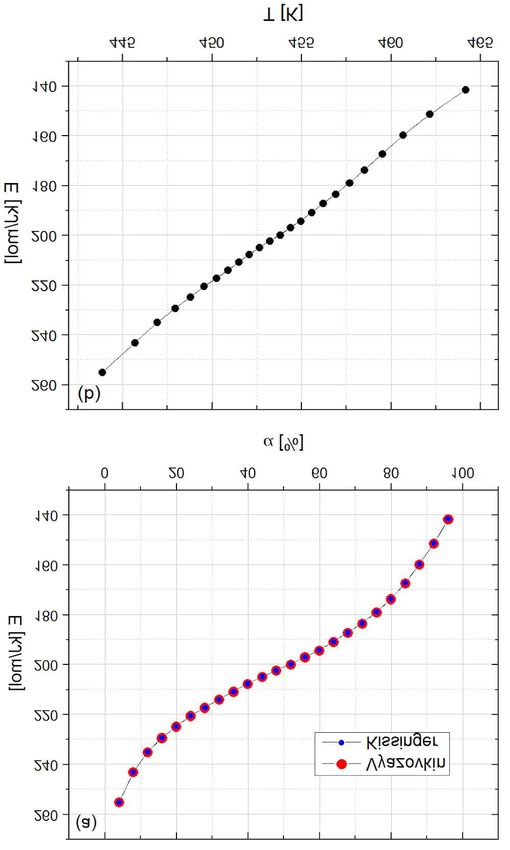
Isoconversional Model of Kinetics of Thermally Induced Processes. . .
dα Eα
= k (T ) f (α) = A exp − f (α) , (1)
dt RT
where α stands for the extent of conversion, t is
the time, k(T ) is the rate constant and f (α) is the
reaction model. The rate constant can be writ-
ten in the form of Arrhenius equation, where A
is the pre-exponential factor, Eα is the activation
energy, R is the universal gas constant, and T is
the temperature. The extent of conversion can
be defined as the ratio of the current change in
heat, and the total heat change during the observed
process.
The basic principle for isoconversional methods
is the following: the rate of the process, for a con-
stant extent of conversion, is a function of tempera-
ture only. This allows the elimination of a reaction Fig. 1. DSC curve for Sb37 S48 I15 glass system at
model from the starting equation. four different heating rates.
The starting equation (1) can be represented in
the integral form as The minimum is found for each extent of con-
Zα Zt version value, which corresponds to the activation
dα E energy. For the calculation of temperature integral,
g (α) = = A dt exp − , (2)
f (α) RT the Gorbachev approximation is used [45]
0 0
ZT
where for temperature raised at a constant rate
E
T = T0 + βt (β is the heating rate, t is the time, I (E, T ) = dT exp − =
RT
and T0 is the starting temperature for t = 0), the 0
integration over time can be replaced with integra- 2
!
RT 1
tion over temperature
2RT
e−E/(RT ) . (7)
E 1+
ZT E
A E A
g (α) = dT exp − = I(ET ), (3)
β RT β
T0 3. Results and discussion
where I(E, T ) is the temperature integral which is
often approximated in different ways. The obtained DSC curves for Sb37 S48 I15 glass are
shown in Fig. 1. Three different peaks can be ob-
The Kissinger–Akahira-Sunose (KAS) isoconver-
served: endothermic peak at about 450 K, complex
sional method [40, 41] uses an approximation of the
exothermic peak at 560 K and complex endother-
temperature integral (3) given by Coats and Red-
mic peak at about 670 K. These peaks correspond
fern [42]
! to, respectively, processes of glass transition, crys-
βi RA Eα tallization of different structural units within the
ln = ln − =
2
Tα,i Eα g(α) RTα,i glass, and melting.
Eα 3.1. Glass transition
const. − , (4)
RTα,i The extent of conversion as a function of tem-
2
where a linear function between ln βi /(Tα,i and perature was determined (see Fig. 2) and the acti-
1/Tα,i is gained for each α. The index i identifies vation energies for each values of the extent were
an individual heating rate. The slope of the func- calculated. The calculations were made in Wolfram
tion is equal to the current activation energy value. Mathematica by using the Kissinger and Vyazovkin
The Vyazovkin isoconversional method is based linear isoconversional methods, namely with (4)
on finding the minimum of the difference between and (6), (and the Gorbachev approximation (7)).
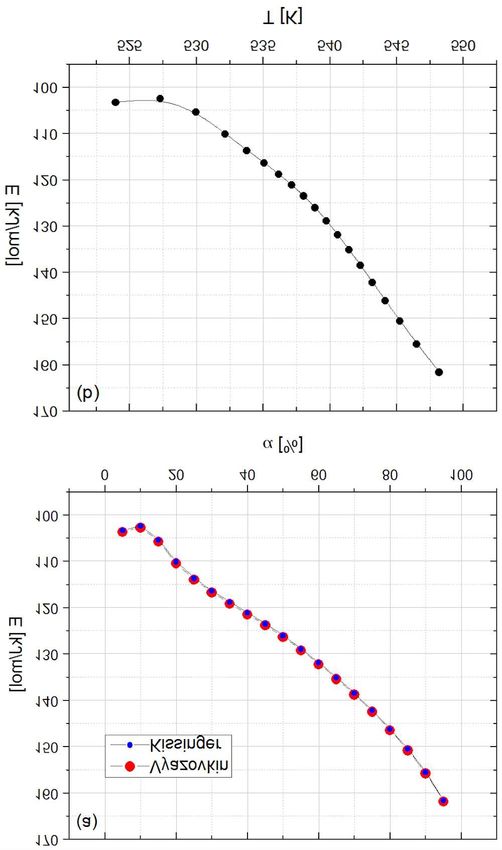
two terms of the equation [43, 44] Figure 3 shows the decrease of apparent activa-
n X
n
tion energy with extent of conversion and tempera-
X I (Eα , Tα,i ) βj ture and shows a typical behavior for most glasses.
− n(n − 1) = min (5)
I (Eα , Tα,j ) βi Both methods of calculation give approximately the
i=1 j6=i
same values. Considering the fact that activation
where n is the number of different heating rates. energies are high in the initial stage (in the order
The difference moves towards a minimal value when of magnitude of hundreds of kJ/mol), this part of
the left term of the equation reaches minimum the glass transition process is described in terms
n X n of α-relaxation (α-processes), which is character-
X I (Eα , Tα,i ) βj
Φ (Eα ) = = min . (6) ized by a cooperative movement of molecules and
I (Eα , Tα,j ) βi
i=1 j6=i structural units. In the second part of the curve,
237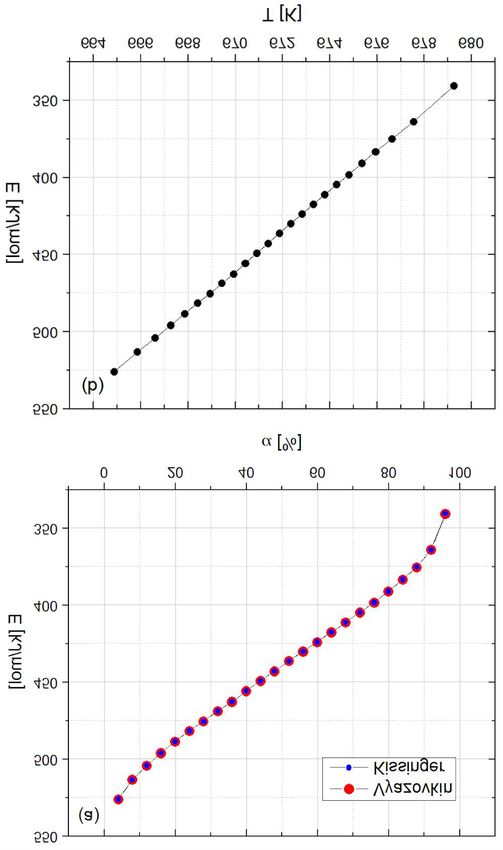
R.R. Raonić et al.

                                                                corresponds to a small extent of conversion (it rep-
                                                                resents the initial stage of glass transition), the val-
                                                                ues obtained through isoconversional methods are
                                                                in good agreement.
                                                                   Dynamic fragility parameter of the glass is also
                                                                determined by using
                                                                             Eg
                                                                    m=              ,                                (8)
                                                                         ln 10RTg
                                                                where Eg is the apparent activation energy of glass
                                                                transition and Tg is the glass transition temper-
                                                                ature. The fragility parameter can be estimated
                                                                with (8), whereby values that correspond to a con-
                                                                version rate of α = 0.5 can be selected for the acti-
                                                                vation energy and the glass transition temperature
                                                                (see Fig. 3). The obtained value was m = 23.2(10)
  Fig. 2. The extent of conversion as a function of             and it indicates that this glass does not undergo
  temperature for glass transition process.                     significant configuration changes near glass transi-
                                                                tion temperature, but still cannot be considered as
                                                                a strong melt.

                                                                                 3.2. Crystallization
                                                                   As it can be seen from the shapes of crystalliza-
                                                                tion peaks in Fig. 1, crystallization of this chalco-
                                                                genide glass is a complex process. Based on the po-
                                                                sition of the melting peaks of the crystallized units
                                                                (as it will be shown later) and analyses in similar
                                                                systems [46], it can be separated into two differ-
                                                                ent processes — crystallization of SbSI and Sb2 S3
                                                                structural units. Deconvolution of peaks was made
                                                                before isoconversional analysis. The small exother-
                                                                mic effect that can be detected at low heating rates
                                                                probably corresponds to the change in the crystal-
                                                                lization mechanism. The energy of such transforma-
                                                                tion is small, i.e., the crystallization of SbSI is ex-
                                                                tremely dominant, hence the deconvolution of these
                                                                two processes within the first peak was not made.
                                                                   The dependence of the extent of conversion on
                                                                temperature for the first peak (see Fig. 4) was used
                                                                to determine Tα for each α.
                                                                   The change of activation energy with the extent
                                                                of conversion and temperature for the first peak is
                                                                shown in Fig. 5.

  Fig. 3. Activation energy change with the extent
  of conversion (a) and temperature (b) for glass tran-
  sition process.

the activation energies drop to twice lower values.
As the process carries on, free volume grows, the re-
arrangement of structural units becomes easier and
they begin to move in non-cooperative manner.
  The use of non-isoconversional methods on the
investigated glass has revealed that the values of
activation energy for onset glass transition temper-
ature are about 300 kJ/mol [34]. Considering that                 Fig. 4. The extent of conversion as a function of
glass transition temperature defined in this way                  temperature for the first peak of crystallization.

                                                          238
Isoconversional Model of Kinetics of Thermally Induced Processes. . .
Fig. 6. The extent of conversion as a function of
temperature for the second peak of crystallization.
Fig. 5. Activation energy change with the extent
of conversion (a) and temperature (b) for the first
peak of crystallization.
The application of different non-isoconversional
models has shown that for this glass, crystalliza-
tion of SbSI structural unit occurs through vol-
ume nucleation and three-dimensional growth, but
the number of centers of crystallization does not
change significantly during the experiment [34].
The change in activation energy is unexpectedly
large considering that most of the energy should be
associated with crystal growth. The increase of Eα
with the extent of conversion can be explained by
the influence of the initial stage of parallel crystal-
lization of the new structural unit Sb2 S3 . The acti-
vation energy for peak maximum Eα = 130 kJ/mol
obtained through other, non-isoconversional meth- Fig. 7. Activation energy change with the extent
ods [34] is in accordance with the value obtained by of conversion (a) and temperature (b) for the second
using the Vyazovkin and Kissinger isoconversional peak of crystallization.
method of Eα = 126 kJ/mol (for the extent of con-
version α = 0.5, which approximately corresponds
to crystallization maximum). structural unit crystallizes, the change in activation
The relevant graphs for the second peak of energy is under 10%, so the activation energy can
crystallization of Sb37 S48 I15 chalcogenide glass are therefore be considered approximately constant.
shown in Figs. 6 and 7. Earlier analyses of glasses with antimony [34]
The second peak corresponds to crystallization have shown that for this composition for crystal-
of the Sb2 S3 structural unit. Taking into considera- lization of this structural unit there is, again, a vol-
tion that — at lower values of the extent of conver- ume nucleation with a constant number of nu-
sion — two parallel crystallizations take place, and clei. The activation energy does not refer to nucle-
analyzing from the moment where only the Sb2 S3 ation, but mostly to crystal growth and therefore
239R.R. Raonić et al.
significant changes in the activation energy were
not to be expected [47]. The fact that activa-
tion energy does not change significantly provides
a confirmation of validity of application of dif-
ferent non-isoconversional methods in the analy-
sis of crystallization mechanisms, which are based
on the assumption that the activation energy is
constant. In this case, there is a good accor-
dance of the values of activation energy obtained
through non-isoconversional methods for crystal-
lization peak (∼ 170 kJ/mol [34]) and isoconver-
sional methods Eα=0.5 = 162 kJ/mol.
3.3. Melting
Melting of Sb37 S48 I15 is, like crystallization,
a complex process, consisting of more than one
transformation. The process was separated into two
different peaks. A small endothermic effect, notice-
able at low heating rates, could be a confirmation
of the observed transformation within crystalliza-
tion of SbSI. In the recorded peaks, at ∼ 670 K,
there is a domination of melting of the crystallized
SbSI structural unit.
The relevant graphs for the peak of melting of
SbSI are shown in Figs. 8 and 9. A characteristic,
expected decrease of activation energy with tem-
perature is observed, which is noticed in other ma-
terials as well [48]. Values obtained through both
applied methods are in accordance. The activation
energy changes from Eα = 526 eV (α = 4%) to Fig. 9. Activation energy change with the extent
Eα = 341 eV (α = 96%). The activation energy of conversion (a) and temperature (b) for the peak
change is 30%, which implies that this is a com- of melting.
plex, not a single-step process. If we compare
melting temperatures observed in our experiment
(T = 667.20 (20) K at heating rate of 10 K/min)
and in [49] (T = 665.15K), they are in accordance,
which is a confirmation of crystallization and melt-
ing of this structural unit.
As it can be found in literature [49], melting of
Sb2 S3 occurs at significantly higher temperatures
(T = 823.15 K). However, the thermal decomposi-
tion of the material starts at temperatures higher
Fig. 10. Control recording of Sb37 S48 I15 glass.
than 700 K. This was concluded based on the de-
tected mass difference of the samples before and
after DSC measurement. Full analysis of this pro-
cess was not made in order to protect the furnace
and DSC sensors from contamination. Still, a con-
trol measurement was done, with only one heating
rate (see Fig. 10). As it can be seen in Fig. 10,
Fig. 8. The extent of conversion as a function of there is an endothermic peak which corresponds to
temperature for the peak of melting. melting of the Sb2 S3 structural unit at expected
240Isoconversional Model of Kinetics of Thermally Induced Processes. . .
with a constant number of nucleation centers. The
small changes in activation energy provide a con-
firmation of validity of application of different non-
isoconversional methods in the analysis of crystal-
lization mechanisms.
Isoconversional analysis of melting of crystallized
SbSI structural unit has shown that it is also a com-
plex process and not a single-step one. The activa-
tion energy change from Eα = 526 eV (α = 4%) to
Eα = 341 eV (α = 96%) has been detected. The
values of melting temperatures and XRD pattern of
the annealed sample were the confirmation of crys-
tallized structural units.
Acknowledgments
Fig. 11. XRD pattern ofSb37 S48 I15 glass after
annealing.
The authors acknowledge financial support of the
Ministry of Education, Science and Technological
temperature. This is an indirect proof that this Development of the Republic of Serbia (Grant No.
structural unit has indeed crystallized during the 451-03-9/2021-14/200125).
crystallization process.
Direct evidence of crystallization of structural References
units is the recorded XRD (see Fig. 11) of the sam-
ple annealed at the temperatures where crystalliza-
[1] C. Quémard, F. Smektala, V. Couderc,
tion peaks appear on DSC curves. The presence
A. Barthélémy, J. Lucas, J. Phys. Chem.
of two structural units has been confirmed accord-
Solids 62, 1435 (2001).
ing to the JCPDS 42-1393 for Sb2 S3 and JCPDS
21-0050 for SbSI. [2] M.D. Pelusi, V.G. Ta’eed, L. Fu, E. Magi,
IEEE J. Sel. Top. Quantum Electron. 14,
529 (2008).
4. Conclusions
[3] C. Plesa, D. Turcanu, C. Todirică,
I. Nicola, Chalcogenide Lett. 12, 633
Analysis of thermally stimulated processes by
(2015).
using two different isoconversional methods in
Sb37 S48 I15 chalcogenide glass was made. Activa- [4] S. Asokan, K. Lakshmi, J. Indian Inst. Sci.
tion energies obtained from both methods and for 91, 319 (2011).
all detected processes are in accordance, which is [5] L. Calvez, C.R. Phys. 18, 314 (2017).
an indicator of their reliability. [6] K.O. Čajko, D.L. Sekulić, D.M. Sekulić,
Apparent activation energy change with the ex- N. Ćelić, V. Labaš, M. Kubliha, S. Lukić-
tent of conversion (temperature) for glass transi- Petrović, J. Electron. Mater. 48, 6512
tion is a typical decreasing curve found in most (2019).
glasses. This is related to an increase of the free
[7] R. Kaplan, B. Kaplan, Acta Phys. Pol. A
volume, which enables the structural units to tran-
135, 332 (2019).
sit from cooperative movements together with the
closest neighbors, to move freely, in non-cooperative [8] M. Ganaie, M. Zulfequar, Acta Phys. Pol.
manner. A 128, 59 (2015).
The dynamic fragility index is also determined [9] L. Zhu, D. Yang, L. Wang, J. Zeng,
for the extent of conversion of 0.5, and its value Q. Zhang, M. Xie, P. Zhang, S. Dai, Opt.
of m = 23.2(10) indicates that this glass does not Mater. 85, 220 (2018).
undergo significant configuration changes near glass [10] D. Yin, D. Tu, B. Che, F. Zhang, C. Lin,
transition temperature. S. Dai, J. Inorg. Mater. 29, 279 (2014).
Crystallization of Sb37 S48 I15 is complex, consist-
ing of crystallization of at least two structural units, [11] K.O. Čajko, S.R. Lukić-Petrović,
i.e., SbSI and Sb2 S3 . The increase of activation G.R. Štrbac, T.B. Ivetić, Acta Phys.
energy of SbSI with the extent of conversion has Pol. A 129, 509 (2016).
been explained by the influence of the initial stage [12] A. Andreev, Z. Borisova, E. Bichkov,
of parallel crystallization of the new structural unit Y. Vlasov, J. Non-Cryst. Solids 35–36,
Sb2 S3 . The value of activation energy of crystalliza- 901 (1980).
tion does not change significantly during the pro- [13] E.A. Zhilinskaya, V.N. Lazukin, E.A. By-
cesses which is a consequence of the mechanism chkov, I.L. Likholit, J. Non-Cryst. Solids
of crystallization characterized by crystal growth 119, 263 (1990).
241R.R. Raonić et al.
[14] H. Kim, W.H. Lee, J.H. Lee, D.K. Kwon, [30] E. Fatuzzo, G. Harbeke, W.J. Merz,
Y.S. Song, Y.G. Choi, Ceram. Int. 45, R. Nitsche, H. Roetschi, W. Ruppel, Phys.
12010 (2019). Rev. 127, 2036 (1962).
[15] M. Šiljegović, S. Lukić-Petrović, D. Petro- [31] G.E. Vinogradova, Stakloobrazovaniye i
vić, I. Videnović, I. Turyanytsa, Acta Phys. fazovyravnovetsiya v halkogenidskikh sis-
Pol. A 129, 488 (2016). temakh, Izdatelstvo Nauka, Moscow 1984
[16] A. Yang, M. Zhang, L. Li, Y. Wang, J. Am. (in Russian).
Ceram. Soc. 99, 12 (2016). [32] I.D. Turyanitsa, B.M. Koperles, Neorg.
[17] E.R. Shaaban, H.A. Elshaikh, M.M. So- Mater. 9, 851 (1973) (in Russian).
raya, Phys. Pol. A 128, 358 (2015). [33] T.D. Tran, D.L. Sidebottom, J. Am.
[18] L.X. Qin, X.C. Pan, F.Q. Song et al., Appl. Ceram. Soc. 96, 2147 (2013).
Phys. Lett. 112, 032102 (2018). [34] G.R. Štrbac, S.R. Lukić-Petrović,
[19] H. Zhang, C.X. Liu, X.L. Qi, X. Dai, D.D. Štrbac, D.M. Petrović, J. Non-
Zh. Fang, Sh.Ch. Zhang, Nat. Phys. 5, Cryst. Solids 358, 1146 (2012).
438 (2009). [35] G.R. Štrbac, F. Skuban, S.R. Lukić,
[20] L. Wang, C.D. Wright, M.M. Aziz, C. Hui D.D. Štrbac, J. Optoelectron. Adv. Mater.
Yang, G. Wei Yang, Jpn. J. Appl. Phys. 9, 1690 (2007).
53, 028002 (2014). [36] C.A. Angell, D.R. Macfarlane, M. Oguni,
[21] B. Srinivasan, A. Gelle, F. Gucci, Ann. NY Acad. Sci. 484, 241 (1986).
C. Boussard-Pledel, B. Fontaine, R. Gau- [37] C.A. Angell, Science, 267, 1924 (1995).
tier, J.F. Halet, M. Reece, B. Bureau, [38] M. Brown, D. Dollimore, A. Galwey, Reac-
Inorg. Chem. Front. 6, 63 (2019). tions in the Solid State in series Compre-
[22] R. Golovchak, YA. Shpotyuk, J. Szlezak, hensive Chemical Kinetics, Vol. 22, Else-
A. Dziedzic, A. Ingram, J. Cebulski, Opt. vier, Amsterdam 1980.
Lett. 43, 387 (2018).
[39] J. Šesták, Ber. Bunsen. Phys. Chem.
[23] P. Lucas, Z. Yang, M.K. Fah, T. Luo, 12D, 721 (1985).
S. Jiang, C. Boussard-Pledel, M.L. Anne,
[40] H. Kissinger, Anal. Chem. 29, 1702
B. Bureau, Opt. Mater. Express 3, 1049
(1957).
(2013).
[41] T. Akahira, T. Sunose, Res. Report Chiba
[24] J.L. Adam, X. Zhang, Glasses: Prepara-
Inst. Technol. 16, 22 (1971).
tion, Properties and Applications, Wood-
head Publishing Limited, Cambridge 2014. [42] A. Coats, J. Redfern, Nature 201, 68
(1964).
[25] R.J. Mehta, Y. Zhang, C. Karthik,
B. Singh, R.W. Siegel, T. Borca-Tasciuc, [43] S. Vyazovkin, J. Comput Chem. 22, 178
G. Ramanath, Nat. Mater. 11, 233 (2012). (2001).
[26] C. Vautier, Solid State Phenom. 71, 249 [44] S. Vyazovkin, D. Dollimore, Chem. Inf.
(2000). Comput. Sci. 36, 42 (1996).
[27] R. Golovchak, M.J. Seage, J. Szlezak, [45] V.M. Gorbachev, J. Therm. Anal. 8, 349
Y. Shpotyuk, D. Płoch, F. Chevire, (1975).
C. Boussard-Pledel, B. Bureau, J. Alloy. [46] F. Skuban, S.R. Lukić, D.M. Petrović,
Compd. 835, 155224 (2020. I. Guth, G.R. Štrbac, J. Optoelectron. Adv.
[28] D. Savytskii, M. Sanders, R. Golovchak, Mater. 9, 3100 (2007).
B. Knorr, V. Dierolf, H. Jain, J. Am. [47] M. Abu El-Oyoun, Mater. Chem. Phys.
Ceram. Soc. 97, 198 (2014). 131, 495 (2011).
[29] E.I. Gerzanich, V.A. Lyakhovitskaya, [48] S. Vyazovkin, Isoconversional Kinetics of
V.M. Fridkin, B.A. Popovkin, in: Current Thermally Stimulated Processes, Springer
Topics in Materials Science, Ed. E. Kaldis, Int. Pub., Switzerland 2015.
North-Holland Publishing, Amsterdam [49] Handbook of Chemistry and Physics, Ed.
1982, p. 55. C. Weast, CRC Press, USA 1974.
242You can also read