J.P. Morgan Healthcare Conference - January 11, 2022 (Nasdaq: OCDX) - Investor Relations ...

Page created by Frederick Sullivan
 
CONTINUE READING
J.P. Morgan Healthcare Conference - January 11, 2022 (Nasdaq: OCDX) - Investor Relations ...
J.P. Morgan
                 Healthcare
                 Conference
                 January 11, 2022

(Nasdaq: OCDX)
J.P. Morgan Healthcare Conference - January 11, 2022 (Nasdaq: OCDX) - Investor Relations ...
© Ortho Clinical Diagnostics 2022

       Forward-Looking Statements
This presentation and the oral remarks may contain “forward-looking statements” within the meaning of Section 27A of the Securities Act of 1933, as amended, and Section 21E of the Securities Exchange Act of
1934, as amended. Forward-looking statements include, among others, statements concerning (i) Ortho Clinical Diagnostics Holdings plc (the “Company’s”) unaudited preliminary financial information for the
fiscal fourth quarter and the fiscal year ended January 2, 2022 and (ii) the benefits of the business combination transactions involving Quidel Corporation and the Company, including the combined company’s
future financial and operating results, plans, objectives, expectations and intentions and other statements that are not historical facts. The preliminary financial information set forth in this presentation is subject
to the completion of the Company’s audit process and subject to change. The estimated preliminary results included in this presentation should not be viewed as a substitute for the Company’s annual financial
statements prepared in accordance with U.S. generally accepted accounting principles (“GAAP”). There can be no assurance that the estimated preliminary results will be realized, and you are cautioned not to
place undue reliance on the preliminary financial information, which reflects management’s current expectations and anticipated results of operations, all of which are subject to known and unknown risks,
uncertainties and other factors that may cause our actual results, performance or achievements, market trends, or industry results to differ materially from those expressed or implied by such forward-looking
statements. Therefore, any statements contained herein that are not statements of historical fact may be forward-looking statements and should be evaluated as such. Without limiting the foregoing, the words
as “anticipate,” “expect,” “suggest,” “plan,” “believe,” “intend,” “project,” “forecast,” “estimates,” “targets,” “projections,” “should,” “could,” “would,” “may,” “might,” “will,” and the negative thereof and similar words
and expressions are intended to identify forward-looking statements. Factors that might materially affect such forward looking statements include: the ongoing global coronavirus (COVID-19) pandemic; risks
related to the proposed acquisition of us by Quidel Corporation (“Quidel”), including (i) failure to complete the proposed transaction on the proposed terms or on the anticipated timeline, or at all, (ii) risks and
uncertainties related to securing the necessary regulatory and shareholder approvals, the sanction of the High Court of Justice of England and Wales and satisfaction of other closing conditions to consummate
the proposed transaction, (iii) the occurrence of any event, change or other circumstance that could give rise to the termination of the definitive transaction agreement relating to the proposed transaction, (iv) the
challenges and costs of closing, integrating, restructuring and achieving anticipated synergies, (v) the ability to retain key employees, and (vi) economic, business, competitive, and/or regulatory factors affecting
the businesses of Ortho Clinical Diagnostics and Quidel; increased competition; manufacturing problems or delays or failure to develop and market new or enhanced products or services; adverse developments
in global market, economic and political conditions; our ability to obtain additional capital on commercially reasonable terms may be limited or non-existent; our inability to implement our strategies for improving
growth or to realize the anticipated benefits of any acquisitions and divestitures, including as a result of difficulties integrating acquired businesses with, or disposing of divested businesses from, our current
operations; a need to recognize impairment charges related to goodwill, identified intangible assets and fixed assets; inability to achieve some or all of the operational cost improvements and other benefits that
we expect to realize; our ability to operate according to our business strategy should our collaboration partners fail to fulfill their obligations; risk that the insurance we maintain may not fully cover all potential
exposures; product recalls or negative publicity may harm our reputation or market acceptance of our products; decreases in the number of surgical procedures performed and the resulting decrease in blood
demand; fluctuations in our cash flows as a result of our reagent rental model; terrorist acts, conflicts, wars and natural disasters that may materially adversely affect our business, financial condition and results
of operations; the outcome of legal proceedings instituted against us and/or others; risks associated with our non-U.S. operations, including currency translation risks, the impact of possible new tariffs and
compliance with applicable trade embargoes; the effect of the United Kingdom’s withdrawal from the European Union; our inability to deliver products and services that meet customers’ needs and expectations;
failure to maintain a high level of confidence in our products; significant changes in the healthcare industry and related industries that we serve, in an effort to reduce costs; reductions in government funding and
reimbursement to our customers; price increases or interruptions in the supply of raw materials, components for our products and products and services provided to us by certain key suppliers and
manufacturers; our ability to recruit and retain the experienced and skilled personnel we need to compete; work stoppages, union negotiations, labor disputes and other matters associated with our labor force;
consolidation of our customer base and the formation of group purchasing organizations; unexpected payments to any pension plans applicable to our employees; our inability to obtain required clearances or
approvals for our products; failure to comply with applicable regulations, which may result in significant costs or the suspension or withdrawal of previously obtained clearances or approvals; the inability of
government agencies to hire, retain or deploy personnel or otherwise prevent new or modified products from being developed, cleared or approved or commercialized in a timely manner; disruptions resulting
from President Biden’s invocation of the Defense Production Act; results of clinical studies, which may be delayed or fail to demonstrate the safety and effectiveness of our products; costs to comply with
environmental and health and safety requirements, or costs related to liability for contamination or other potential environmental harm; healthcare fraud and abuse regulations that could result in liability, require
us to change our business practices and restrict our operations in the future; failure to comply with the anti-corruption laws of the United States and various international jurisdictions; failure to comply with anti-
terrorism laws and regulations and applicable trade embargoes; failure to comply with the requirements of federal, state and international laws pertaining to the privacy and security of health information; our
inability to maintain our data management and information technology systems; data corruption, cyber-based attacks, security breaches and privacy violations; our inability to protect and enforce our intellectual
property rights or defend against intellectual property infringement suits against us by third parties; risks related to changes in income tax laws and regulations; risks related to our substantial indebtedness; our
ability to generate cash flow to service our substantial debt obligations; difficulties complying with Nasdaq rules regarding the composition of our Board of Directors and certain committees now that we are no
longer a “controlled company”; risks related to the ownership of our ordinary shares; and other factors beyond our control. Unless legally required, we assume no obligation to update any such forward-looking
information to reflect actual results or changes in the factors affecting such forward-looking information.

Information contained in this presentation concerning our industry and the markets in which we operate, including our general expectations and market position, market opportunity and market size, is based on
information from various sources, on assumptions that we have made that are based on such information and other similar sources and on our knowledge of, and expectations about, the markets for our service
offerings. This information involves a number of assumptions and limitations, and you are cautioned not to give undue weight to such estimates.                                                               2
J.P. Morgan Healthcare Conference - January 11, 2022 (Nasdaq: OCDX) - Investor Relations ...
© Ortho Clinical Diagnostics 2022

       Forward-Looking Statements (continued)

Additional Information and Where to Find it

This communication does not constitute an offer to sell or the solicitation of an offer to buy any securities or a solicitation of any vote or approval. The proposed business combination transaction among Ortho
Clinical Diagnostics Holdings plc (“Ortho Clinical Diagnostics”), Quidel Corporation (“Quidel”) and Coronado Topco, Inc. (“Topco”) will be submitted to the shareholders of Ortho Clinical Diagnostics and Quidel
for their consideration. Ortho Clinical Diagnostics and Topco expect to file with the Securities and Exchange Commission (“SEC”) a registration statement on Form S-4 that will include a prospectus of Ortho
Clinical Diagnostics and Topco and a proxy statement of Ortho Clinical Diagnostics. Ortho Clinical Diagnostics and Topco also plan to file other documents with the SEC regarding the proposed transaction.
INVESTORS AND SECURITY HOLDERS OF ORTHO CLINICAL DIAGNOSTICS ARE URGED TO READ THE PROXY STATEMENT, PROSPECTUS AND OTHER RELEVANT DOCUMENTS THAT WILL BE
FILED WITH THE SEC CAREFULLY AND IN THEIR ENTIRETY WHEN THEY BECOME AVAILABLE BECAUSE THEY WILL CONTAIN IMPORTANT INFORMATION ABOUT THE PROPOSED
TRANSACTION. Investors and security holders will be able to obtain free copies of the proxy statement, prospectus and other documents containing important information about Ortho Clinical Diagnostics,
Quidel and Topco, once such documents are filed with the SEC, through the website maintained by the SEC at http://www.sec.gov. Copies of the documents filed with the SEC by Ortho Clinical Diagnostics,
when and if available, can be obtained free of charge on Ortho Clinical Diagnostics’ website at https://www.orthoclinicaldiagnostics.com/en-us/home/ or by directing a written request to
OrthoCareTechnicalSolutions@orthoclinicaldiagnostics.com.

Ortho Clinical Diagnostics and certain of its respective directors, executive officers and certain members of management may be deemed to be participants in the solicitation of proxies from the shareholders of
Ortho Clinical Diagnostics in connection with the proposed transaction. Information about the directors and executive officers of Ortho Clinical Diagnostics is set forth in its annual report on Form 10-K, which
was filed with the SEC on March 19, 2021. Other information regarding the participants in the proxy solicitation and a description of their direct and indirect interests, by security holdings or otherwise, will be
contained in the prospectus and proxy statement and other relevant materials when and if filed with the SEC in connection with the proposed transaction.

                                                                                                                                                                                                                   3
J.P. Morgan Healthcare Conference - January 11, 2022 (Nasdaq: OCDX) - Investor Relations ...
© Ortho Clinical Diagnostics 2022

      Non-GAAP Financial Measures
This presentation contains financial measures, such as core revenue excluding SARS-CoV-2 assay sales, constant currency growth rate, adjusted EBITDA, adjusted net income, adjusted diluted
EPS and adjusted free cash flow, which are considered non-GAAP financial measures under applicable U.S. Securities and Exchange Commission rules and regulations. These non-
GAAP financial measures should be considered supplemental to, and not a substitute for, financial information prepared in accordance with GAAP. Adjusted EBITDA, adjusted net income,
adjusted diluted EPS and adjusted free cash flow eliminate impacts of certain non-cash, unusual or other items that that we do not consider indicative of our ongoing operating performance. The
Company’s definitions of these non-GAAP measures may differ from similarly titled measures used by others. The Company generally uses these non-GAAP financial measures to facilitate
management’s financial and operational decision-making, including evaluation of the Company’s historical operating results, comparison to competitors’ operating results and determination of
management incentive compensation. These non-GAAP financial measures reflect an additional way of viewing aspects of the Company’s operations that, when viewed with GAAP results and
the reconciliations to corresponding GAAP financial measures, may provide a more complete understanding of factors and trends affecting the Company’s business. Because non-GAAP financial
measures exclude the effect of items that will increase or decrease the Company’s reported results of operations, management strongly encourages investors to review the Company’s
consolidated financial statements and publicly filed reports in their entirety. Reconciliations of the non-GAAP financial measures to the most directly comparable GAAP financial measures are
included in the appendix to this presentation. For example, such reconciling items include the impact of unrealized foreign currency exchange gains or losses, gains or losses that are unusual or
nonrecurring in nature as well as discrete taxable events. We cannot estimate or project these items and they may have a substantial and unpredictable impact on our results presented in
accordance with GAAP.

                                                                                                                                                                                                     4
J.P. Morgan Healthcare Conference - January 11, 2022 (Nasdaq: OCDX) - Investor Relations ...
OUR MISSION
We improve and save lives
with diagnostics.
We enable our customers to
optimize the long-term value for
patients through our innovative
IVD solutions and services.
J.P. Morgan Healthcare Conference - January 11, 2022 (Nasdaq: OCDX) - Investor Relations ...
© Ortho Clinical Diagnostics 2022

Our History and Future Focus

 75                                          5                                           3
    FIRST                             CARVE-OUT                                          PAST

                1939 – 2014                                           2014 – 2019                    2019 – 2022        Future              2022+

   YEARS                                   YEARS                                        YEARS

▪ Formed in 1939 within             ▪ The Carlyle Group sponsored                   ▪ Went public on the Nasdaq         ▪ Continue to deliver on excellent
 Johnson & Johnson                     the carve-out from Johnson                    Stock Exchange in January           growth track record
                                       & Johnson, June 2014                          2021
▪ Pioneered blood typing                                                                                                ▪ Expand product pipeline and
 and testing                        ▪ Recognized worldwide for                      ▪ Demonstrated ability to deliver    geographic footprint
                                       trusted brand and service                     consistent mid-single-digit+
▪ Acquired Kodak patented                                                                                               ▪ Accelerate entrance into high
                                                                                     growth
 dry slide technology               ▪ Invested >$500M in R&D                                                             growth market segments
                                       over period                                  ▪ Enhanced Lifetime Customer
▪ Leader in infectious disease                                                                                          ▪ Integrate and drive combined
                                                                                     Value
 testing, including the first       ▪ Launched novel instruments                                                         value creation with Quidel
 antibody tests for Hepatitis C        and assays                                   ▪ Reinforced Service Leadership
 and HIV
                                                                                    ▪ Increased investment in product
                                                                                     innovation, menu acceleration
                                                                                     and commercial excellence
                                                                                    ▪ Pending acquisition of Ortho by
                                                                                     Quidel, as announced in
                                                                                                                                                             6
                                                                                     December 2021
J.P. Morgan Healthcare Conference - January 11, 2022 (Nasdaq: OCDX) - Investor Relations ...
© Ortho Clinical Diagnostics 2022

     Three Strategic Priorities Drive Profitable Growth
     Strong momentum in base business, bolstered by innovative growth opportunities
     and operational efficiencies

Product Innovation                                                                               Global Commercial Excellence                    Operational Efficiency
▪ Launched new instrument platforms –                                                          ▪ 4th consecutive quarter of double-digit core    ▪ Initiated global footprint expansion into India
   OPTIX® Reader, VISION® Swift and                                                                revenue growth through 3Q21                     to bring efficiencies and scale, while fast-
   VISION® Max Swift                                                                                                                               tracking product development and growth in
                                                                                               ▪ Continued commercial excellence program           emerging markets
▪ Launched new customer controls and 5                                                             that was launched in 2019 focused on
   new or improved assays in 2021                                                                  customer segmentation, commercial KPIs, and   ▪ Gross profit margin expanded 280 bps to
                                                                                                   expanding customer facing resources (i.e.       50.8% for 3Q21-YTD
▪ Progress continues on “Dry-Dry”
                                                                                                   laboratory specialists)
   instrument platform in development that is                                                                                                    ▪ Value capture savings of $18.4M 3Q21-YTD
   expected to lead to significant portfolio                                                   ▪ Ranked #1 in ServiceTrak™ Awards for sixth      ▪ Reduced net leverage to 3.7x1, from 7.4x, and
   simplification with disruptive throughput                                                       consecutive year; recent NPS was 22
                                                                                                                                                   continue to target 2.5x-3.5x
                                                                                                   percentage points higher than the next
                                                                                                   closest competitor

                                                                                                                                                                                                     7
1. As of 3Q21; Net leverage is defined by net debt to trailing-twelve-month EBITDA
J.P. Morgan Healthcare Conference - January 11, 2022 (Nasdaq: OCDX) - Investor Relations ...
Financial
Results
J.P. Morgan Healthcare Conference - January 11, 2022 (Nasdaq: OCDX) - Investor Relations ...
© Ortho Clinical Diagnostics 2022

3Q 2021-YTD Highlights

3Q 2021-YTD in review:                                                                                          Total
strong momentum1                                                                                                                       Adjusted EBITDA   Adjusted Diluted
                                                                                                               Revenue
                                                                                                                                       $420M2
                                                                                                                                                               EPS
▪ Core Revenue growth of 19% y/y,1
  excluding SARS-CoV-2 headwind                                                                      $1.52B                                              $0.622
                                                                                                                                           Up 30.4%
▪ Americas up 22% y/y,1 driven by the                                                                           Up 19.3%1
  commercial excellence program
▪ Emerging markets up 26% y/y 1 as
  strong rebound continues
                                                                                                        Core Revenue                     Adjusted          Adjusted
                                                                                                          Increased                    EBITDA Margin      EPS Growth
                                                                                                     18.7%1                            27.6%2             313%
                                                                                                                To $1.50B                 Up 180 bps

1. Growth rate shown on a constant currency basis; Reference non-GAAP reconciliation slide for reconciliation to closest GAAP metric
2. Reference non-GAAP reconciliation slide for reconciliation to closest GAAP metric                                                                                        9
J.P. Morgan Healthcare Conference - January 11, 2022 (Nasdaq: OCDX) - Investor Relations ...
© Ortho Clinical Diagnostics 2022

FY 2021 Expectations2                                                                                                                                                            FY 2021 Guidance1
Preliminary revenue at high-end of FY guide                                                                                                                              $2.00 – $2.02 Billion
following three consecutive quarters of raises                                                                                                                                                Core Revenue

     Preliminary 4Q & FY 2021 Results2:
     ▪ 4Q core revenue: expected to be ~$518M-$520M, +4%                                                                                                                                   14% – 15%
         y/y in constant currency; Core, ex-COVID +8% in                                                                                                   Constant Currency Core Revenue Growth
         constant currency
     ▪ FY21 core revenue: expected to be ~2.014B-$2.016B,
         +15% y/y in constant currency                                                                                                                                     $542 – $547 Million
                                                                                                                                                                                          Adjusted EBITDA
     Strategic plan and focus for continued
     top-line growth and operating leverage
                                                                                                                                                                                           19% – 20%
     ▪ Focusing on increasing lifetime customer value                                                                                                                           Adjusted EBITDA Growth
     ▪ Supporting 1.2 to 2x operating leverage expansion
         for Adjusted EBITDA growth in excess of total
         revenue expansion
                                                                                                                                                                                       $0.76 – $0.78
                                                                                                                                                                 Adjusted Diluted Earnings Per Share
     ▪ Continuing to fund innovation and R&D efforts
         to expand future growth opportunities

1. Guidance provided in 3Q 21 earnings release dated November 3, 2021; Reference non-GAAP reconciliation slide for reconciliation to closest GAAP metric
2. Includes preliminary unaudited revenue results and are subject to change. Final 4Q and 2021 results to be released on February 16, 2022. Reference non-GAAP reconciliation slide for reconciliation to closest GAAP metric   10
© Ortho Clinical Diagnostics 2022

Balance Sheet, Cash Flow and Liquidity
Strong free cash flow is enabling us to work toward normalized net leverage 4

                                                                                                                                      Beginning of Year Target Net Leverage4
                                                                                                                                                    Reduction
                                                                                                                                              (Net Debt to EBITDA)
                               3.7x                                                                     $255.9 Million
                  Net Debt to LTM                                                                             Cash2
                   EBITDA Ratio2                                                                                              4.5x1
                                                                                                                                       4.0x1
                                                                                                        $187.3 Million
                  $2.3 Billion                                                                           3Q 21 Adjusted
                          Total Debt                                                                     Free Cash Flow1

                  $1.4 Billion                                                                          $455.0 Million
                  Debt Reduction3                                                                       Borrowing Capacity2

                                                                                                                              2020     2021      2022       2023      2024

1.   Reference non-GAAP reconciliation slide for reconciliation to closest GAAP metric
2.   As of 3Q21
3.   Debt reduction is 2021 year-to-date
4.   Net leverage is defined by net debt to trailing-twelve-month EBITDA;                                                                                                      11
Business
Overview
© Ortho Clinical Diagnostics 2022

     Highly Differentiated in Two Key Markets
     A pioneer of life-impacting diagnostic advances and a trusted brand
                        Ortho plays in large markets with a TAM of ~$27bn, expected to grow at a 5-year CAGR of 5% from 2020 to 2025

     Clinical Laboratories - $25bn TAM                                          Transfusion Medicine - $2bn TAM
      Pioneer of infectious disease immunoassays and                            Global leader in hospital blood typing and screening and
      dry-slide technology on our VITROS® analyzers                             significant new opportunities in blood donation testing
      ▪ Innovative dual slides                                                  ▪ #1 in immunohematology globally
      ▪ A market leader in acute care and “STAT” labs with                      ▪ Pioneered blood typing and infectious disease screening
          infectious disease immunoassays
                                                                                ▪ Cadence of ORTHO VISION® Swift platforms driving
                                                                                  improved customer workflow and automation

TAM = Total Addressable Market                                                                                                              13
© Ortho Clinical Diagnostics 2022

     Strong Growth in Core Business Continues in FY 21
     Core revenue % growth (excl. local HCV)1
                                                                                                                                                                      25%
                                                                                                                                                                                                           Core Excl. HCV %
                                                                                                                                                             21%                                             SARS-CoV-2
                                                                                                                                                                              13%
                                                                                                                                                                     30%                                    Core Excluding
                                                                                                                                                     10%                              4%
                                                                                     6%                                                       4%                             16%                           Local HCV/SARS-
                                                                    4%                               4%               5%                                     14%
                   1%              1%                                                                                                                                                 7%                        CoV-2
                                                                                                                                                      4%

                                                   (3%)
                                                                                                                                    (18%)

                                                                                                                                     (12%)

                                                                                                                                                                                                       3
                 2017             2018           Q1 19            Q2 19           Q3 19            Q4 19           Q1 20            Q2 20    Q3 20   Q4 20   Q1 21   Q2 21   Q3 21   Q4 21E

            Installed Base Growth
                                                                                                                     16%             15%

                                                                                                                                                                                      Available on 02/16
                                                                                                    15%                                      15%                     15%     16%

                                                                                                                                                                                        Earnings Call
                                                                                                                                                     14%
                                                                                    13%                                                                      14%
                                                                   13%
                  9%              11%              11%                                                                                                                                                        Integrated
                                                                                                                                                                                                            Installed Base2

                                                                                                                                                                                                                 Total
                                                                                                                                                                                                            Installed Base
                  4%                                                                                 5%              6%               6%      5%      4%              4%      4%
                                   2%              2%               3%              4%                                                                        4%

                 2017             2018           Q1 19            Q2 19           Q3 19            Q4 19           Q1 20            Q2 20    Q3 20   Q4 20   Q1 21   Q2 21   Q3 21   Q4 21E
Note: core revenue growth rates shown in constant currency
1. Reference non-GAAP reconciliation slide for reconciliation to closest GAAP metric
2. Integrated installed base includes VITROS 5600 and XT 7600 Clinical Labs instruments
3. Reflects preliminary unaudited revenue results and is subject to change. Final 4Q and 2021 results to be released on February 16, 2022                                                                                     14
© Ortho Clinical Diagnostics 2022

      Focus on Increasing Lifetime Customer Value
     Clinical Labs example: Razor-Razor blade economics based on closed systems

                              Standalone Placement                                       Integrated Placement                                            Menu Expansion                       Automation
                               (75% of installed        base)2                             (24% of installed            base)2                            & Utilization                   (1% of installed base)2

                                                                                                                                                                                                +300%
          Recurring Revenue

                                                                                                                                                                                                               1
                                                                                                                                                                                           Annual Revenue

                                                                                                                                                                  3%-7%

                                                                                                                                                     Avg. Annual Recurring
                                                                                                                                                       Revenue Growth
                                                                                                         +65%

                                                                                               Annual Revenue

                                 Customer Tenure                                                                    13 Years (average)                                                   +15 Years

1. 300% increase represents cumulative change in annual recurring revenue from the median customer running an integrated instrument to the same customer running an automated solution
2. Represents the percentage of the installed base as of year end 2020                                                                                                                                              15
© Ortho Clinical Diagnostics 2022

  Clinical Labs Opportunities for Immunoassay Growth Through
  Integrated System Upgrades and Placements
                                                                                                                      Integrated Instruments Percentage of
                                                                                                                           Clinical Lab Installed Base3

   2020 Ortho CL Revenue1                                                  2020 Segment Data2
                                                                                                                                        EMEA                  China
                                                                                                                 Americas                15%                   32%
                                                                                                                   34%

     Immunoassay                                                                                    Clinical                                                ASPAC/Japan
        38%                                                                                        Chemistry                                                   16%
                                                                                                     32%

                             Clinical
                            Chemistry                                            Immunoassay
                              62%                                                   68%

                                                                                                                              Integrated Penetration
                                                                                                                          of Clinical Lab Installed Base
            Strength in Clinical                                           Opportunity in larger, faster
         Chemistry underpinned by                                            growing Immunoassay
         benefits in dry technology                                          segment with growth in                                                          24%       26%
                                                                            integrated installed base                                          16%   19%
                                                                                                                         6%    11%    12%

                                                                                                               2008     2010   2012   2014   2016    2018   2020      3Q21-
                                                                                                                                                                       YTD
1. 2020 Ortho revenue excluding CoV-2 assays
2. Sourced from 2021 IQVIA Market Book to exclude COVID-19 assay revenue
3. As of 3Q21                                                                                                                                                                 16
© Ortho Clinical Diagnostics 2022

Commercial Excellence Program Has Improved Execution
Market Specific &                                                                                 Focused &
                                                       Insight Driven                                                         Digitally Enabled
Globally Connected                                                                                Disciplined

                              Phase       01                                                Phase   02                                  Phase   03
 ASPAC, Japan, LATAM,
 Distribution Markets

                                                               China, Western Europe

                                                                                                             North America

 Commercial Edge                                               Commercial Evolution                          Commercial 360
 ▪ Define sweet spot through market and                       ▪ Increase sales efficiency through strategy   ▪ Enhance customer value by digitally
   customer segmentation                                        optimization                                   aligning and integrating customer
 ▪ Establish growth equation                                  ▪ Introduce and align new customer               touchpoints
 ▪ Focused commercial KPI’s that drive                          engagement channels (non sales)              ▪ Optimize customer engagement channels
   strategy effectiveness                                     ▪ Identify additional growth opportunities       to accelerate revenue
 ▪ Expanding customer facing resources (i.e.                                                                 ▪ Expand market reach
   laboratory specialists)                                                                                                                             17
© Ortho Clinical Diagnostics 2022

  Customer Excellence Enables Retention, Promotes Growth
  Service is critically important and highly valued by our customers

                     ServiceTrak™ Integrated System Comparison                                                ORTHO CARE™ Key Drivers
                                                                                                                People                Reliability
                         2015            2016   2017              2018              2019   2020   2021

      Ortho                  4            1        1                  1              1      1      1         100%                   >30%
                                                                                                         Ortho teams trained in   Decrease in service
                                                                                                         Customer Excellence        interventions*
     Abbott                  1            4        5                  5              5      5      4
                                                                                                             Closed Loop
                                                                                                                                  Speed of Response
 Beckman                     2            5        3                  4              2      1      3     Process Improvement

                                                                                                               82%
     Roche                   5            2        2                  3              3      3      2
                                                                                                               Improvement            89%
                                                                                                          in Global NPS Score        Same Day Fix
                                                                                                              (2015 – 2020)
  Siemens                    3            3        4                  2              4      4      5

*Measured from Q2 2014 through Q2 2021                                                                                                                  18
© Ortho Clinical Diagnostics 2022

M&A Targets Across High-Growth, High-Fit Adjacencies
                                       Opportunity Map
                                    Centralized Lab & POC1                                                                                      Quidel Checks All Three Focus Areas
                                                                                     • ID / acute care
                                                                                       • Oncology

                                                                                                                                                    
                                                                                         • Neuro
                                                             Immunoassay
                                                               ~$16.8B
                                                                                                         • Acute care POC
                                                                                                           • POL / retail
                                                                                                                                                          Molecular Dx

                                                                                                                                                    
                             Other (2)                                               POC / POL
         Segment Size ($B)

                             ~$14.2B                                                  ~$14.5B                    • ID / acute care
                                                                                                                     • Oncology
                                                                                                                        • Transplant                      Point of Care
                                                                                                                         • DS NAT
                                                                                                       Molecular Dx
                                                                                                         ~$10.3B

                             Diabetes
                              ~$5.9B
                                                      Microbiology
                                                         ~$3.0B
                                                Hematology
                                                  ~$2.3B
                                                                              Clinical
                                                                             Chemistry
                                                                              ~$7.1B

                                                                              Histo-
                                                                                                                Lab Informatics
                                                                                                                    ~$1.5B
                                                                                                                                                         Specialty Immunoassay

                                                                            chemistry   Donor
                                          Immuno-                            ~$3.4B
                                         hematology                                   Screening
                                           ~$1.3B                                      ~$0.9B

                       -2       0                2              4                6                 8               10
                                                           Annual Growth (%)
                                            Current Segments             Focus Segments                Other Segments

1. Segment sizes represent 2020 estimates per management-provided figures and industry research reports from IQVIA and Allied Market Research
2. Includes coagulation, urinalysis, mass spectrometry, flow cytometry, NGS and cytology, among other products
                                                                                                                                                                                      19
Acquisition
by Quidel
© Ortho Clinical Diagnostics 2022

Compelling Strategic Rationale & Value Creation Opportunity
                                                                     ▪ Innovative solutions spanning the diagnostics continuum – high-
              $50B                                      Definitive     volume to rapid point-of-care and home use
           Combined Market                             Leadership    ▪ Multiple modalities to address increasingly diverse clinical and
             Opportunity                                               customer needs

                                                                     ▪ For TTM Q3 2021, combined pro forma revenue of $3.9 billion
             $3.9B                                  Globally           and adjusted EBITDA of $1.8 billion with accelerating growth
      Combined TTM Q3 2021 Pro                   Complementary       ▪ Highly complementary global R&D and commercial operations
          Forma Revenue                                                across 130-plus countries

            ~6,000                                       Customer
                                                                     ▪ Enhancing care along the testing continuum: screening,
                                                                       diagnosis, and monitoring
        Combined Employees
                                                          Impact     ▪ Strengthening capabilities for reference labs, hospitals, clinics,
            Worldwide                                                  and at-home testing

            $100M+                                      Enhanced
                                                                     ▪ Immediate expansion into significant new and emerging global
                                                                       markets
         Cross-Selling Revenue
           Synergies by 2025                             Growth      ▪ Transforms decentralized testing through telehealth and digital
                                                                       health capabilities

                                                                     ▪ Expected strong top- and bottom-line synergy opportunity
            ~$90M                                        Financial   ▪ Diversified, recurring revenue across a global installed base
       Run-Rate Cost-related
       Synergies end of year 3
                                                         Strength    ▪ Strong balance sheet and cash flow to invest in both organic
                                                                       and inorganic opportunities
                                                                                                                                            21
© Ortho Clinical Diagnostics 2022

Together, We Expect to Be a Stronger Dx Company
R&D, Clinical/Regulatory, and Commercial capabilities expected to drive growth across
segments

                                                          Two Complementary Organizations

         ▪ Global infrastructure (NA, LATAM, EMEA, Japan,                 ▪ Sizeable growth opportunities in fast growing segments
            China, ASPAC)                                                     − POC IA                    − Home Testing & Telemedicine
         ▪ Diversified, stable and growing revenue                            − POC MDx

         ▪ 2,300 direct global teammates focused on commercial            ▪ Brand strength in POC testing and emerging Brand in
            sales and service                                                OTC segments

         ▪ Longstanding and deep customer relationships                   ▪ Robust R&D pipeline of 50 active projects including two
            (average of 13 years for clin labs)                              new near-patient / POC platforms
                                                                              − Sofia 2                      − Project “Leapfrog”
         ▪ 14 instrument systems covering 24 therapeutic areas
            with 240 assays                                                   − Sofia Q                      − Next-Gen IA system (POC)
                                                                              − Savanna                      − Lyra (PCR reagents)
         ▪ Dry slide technology offering improved ease of use
            (fewer parts and fewer tubes)                                 ▪ Exceptional balance sheet with ~$1Bn in cash (FY2021)
                                                                             and no debt

                                                                                                                                          22
© Ortho Clinical Diagnostics 2022

Leadership Across Large and Growing Market Opportunities

                                                                       Total Addressable Market: $50 Billion
                                             ~ $23B                                        ~ $25B                             ~$2B
                                       Point-of-care                           Clinical Laboratories               Transfusion Medicine
                                                     A Segment Leader in POC Cardiac and Respiratory
                                                                     Rapid Testing

                                                                                                Savanna®

         +                         QuickVue®                 Triage®          Sofia®

                                                                         A Segment Leader in acute care and             A Segment Leader in
                                                                                   “STAT” Labs                          Immunohematology

                                                                         VITROS® XT 3400
                                                                                                 VITROS® XT 7600              ORTHO VISION®

                                                                           VITROS® 5600      VITROS® Automation
                                                                                                                   ORTHO OptixTM    ORTHO WORKSTATION

                                                                                                                                                   23
© Ortho Clinical Diagnostics 2022

Stable and Diversified Revenue Streams
                                                                                                                                                       Quidel
                                                                                                                                                     Pro Forma

                                                                 $1.9B                                    $2.0B                                             $3.9B
                                                       TTM Q3’21 Revenue                         TTM Q3’21 Revenue                               TTM Q3’21 Revenue

                                                         China Other
                                                                5%
                                                      EMEA 3%
                                                        4%                                                                                                 Other
                                                                                                      Other                                                13%
                                                                                                      21%
                                                                                                                                                   China
           Revenue by                                                              North                                North
                                                                                                                                                    8%
                                                                                                                                                EMEA
           Geography                                                              America
                                                                                   88%
                                                                                                 China
                                                                                                 13%
                                                                                                                       America
                                                                                                                        53%
                                                                                                                                                 9%
                                                                                                                                                                    North
                                                                                                         EMEA                                                      America
                                                                                                          14%                                                       70%

                                                                                                         Non-Core                                 Specialized         Clinical
                                                                                  Cardio-
                                                    Specialized                                            2%                                       Dx 1%          Chemistry 20%
                                                                                Metabolic IA
                                                       Dx                                                                                    Non-Core 1% MDx
                                                                MDx                15%
                                                       2%                                                                                                    6%
                                                                13%
           Revenue by                                                                                                                         Transfusion
                                                                                               Immunoassay                        Clinical
             Major                                                                                28%                            Chemistry
                                                                                                                                   38%
                                                                                                                                               Medicine
                                                                                                                                                 17%
                                                                                                                                                                       Cardio-
                                                                                                                                                                   Metabolic IA 7%
            Product
            Category                                                  Rapid                              Transfusion                                   Rapid
                                                                                                                                                                   Immunoassay
                                                                                                                                                                      15%
                                                                                                          Medicine                                      IA
                                                                       IA
                                                                                                            32%                                        33%
                                                                      70%

Note: percentages may not add up due to rounding.
                                                                                                                                                                                     24
© Ortho Clinical Diagnostics 2022

Combination Expected to Create a Leading IVD Pure-Play
                                                                                    FY 2020 IVD Revenue
                                                                                    ($ in millions)     (1)
                                                                                                                                                                     $15,431

                                                                                                         (1)
                                                                                                                                                           $10,805
                              Top-7                                                                            (1)
                                                                                                                                                  $7,403
                     Diagnostics Player                                                                       (2)
                                                                                                                                         $5,343
                                                                                                        (1)
                                                                                                                                       $4,989

                                                                                                                                 $3,809
                       100,000+                                                            Quidel Pro Forma                     $3,428
              Instrument Installed Base                                                                                       $2,728
                 Across All Platforms                                                                   (1)
                                                                                                                             $2,500

                                                                                                       (1)
                                                                                                                            $2,068

                                130+                                                                                    $1,766

                                                                                                                        $1,662
                               Countries                                                               (3)
                                                                                                                       $1,424

                                                                                                        (4)
                                                                                                                       $1,305
   Source: FactSet, Company filings, Wall Street research                                               (1)
   Note: As of 11/18/21                                                                                              $461
     (1) Represents Diagnostics business segment;
     (2) Represents Specialty Diagnostics business segment;
     (3) Pro forma for acquisition of Luminex;
     (4) Represents Clinical Diagnostics business segment.
                                                                                                                                                                               25
© Ortho Clinical Diagnostics 2022

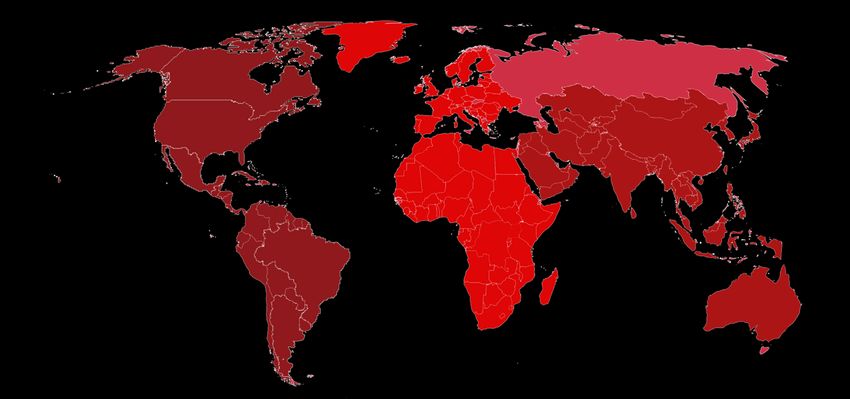
Global Commercial Footprint Provides Channel to Accelerate
Compelling Product Portfolio

  Quidel / Ortho Sales Presence

  Ortho Direct Sales

  Ortho Indirect Sales

               Significant opportunity for global cross-selling and channel pull through with combined infrastructure
                                                                                                                        26
© Ortho Clinical Diagnostics 2022

Dedicated Integration Team Focused on Clear Milestones
Process allows the rest of the organization to continue running and growing the businesses

                                                               Executive Steering Committee

                                                               Integration Management Team

                  Close the Deal &                                      Integrate the
                                                                                              Capture Synergies
                  Prepare for Integration                               Organization

                   Next 120 Days                                      18 – 24 months            36 months

          Revenue Synergies: Approx. 80% of the $100 million in revenue synergies come from Molecular
          products, cross-selling into same call-points and leveraging the geographical footprint and expertise
          outside U.S. to launch new products like Savanna.

          Cost Synergies: achievable $90 million identified, totaling approx. 5% of estimated total operating costs.
          Opportunity to refinance and pay off Ortho senior notes early represents another $30 million in annual
          savings.
          Ortho’s prior-year NOLs of $1.2 billion create a potential cash tax benefit.
                                                                                                                       27
APPENDIX
© Ortho Clinical Diagnostics 2022

Adjusted EBITDA Reconciliation
                                                                                                         Fiscal Nine Months Ended
 $ millions
                                                                                               Oct. 3, 2021                   Sept. 27, 2020
 Net loss                                                                                                    $(44.4)                       $(171.0)
 Interest expense, net                                                                                        112.5                             148.6
 Provision for (benefit from) income taxes                                                                     24.4                              (2.4)
 Depreciation and amortization                                                                               246.6                              239.6
 Stock-based compensation (a)                                                                                  19.5                               6.2
 Restructuring and severance-related costs (b)                                                                  4.7                               9.3
 Loss on extinguishment of debt                                                                                50.3                              12.6
 Arbitration award (c)                                                                                         (7.4)                               ̵̶̶
 Tax indemnification (income) expense, net                                                                     (0.6)                             11.6
 Unrealized foreign currency exchange losses, net (d)                                                             ̵̶̶                            46.0
 Quotient upfront payment (e)                                                                                     ̵̶̶                             7.5
 Other adjustments (f)                                                                                         14.5                              14.4

 Adjusted EBITDA                                                                                            $420.1                             $322.4

Unless otherwise noted, dollars are at actual foreign exchange rates.
Amounts within tables may not add due to rounding.                                                                                                       30
© Ortho Clinical Diagnostics 2022

Adjusted Net Income & Adjusted Diluted EPS Reconciliation
                                                                                                         Fiscal Nine Months Ended
 $ millions, except per share data
                                                                                               Oct. 3, 2021                   Sept. 27, 2020
 Net loss                                                                                                   $(44.4)                        $(171.0)
 Amortization of intangible assets                                                                           100.3                              98.7
 Stock-based compensation (a)                                                                                  19.5                               6.2
 Restructuring and severance-related costs (b)                                                                  4.7                               9.3
 Loss on extinguishment of debt                                                                                50.3                             12.6
 Arbitration award (c)                                                                                         (7.4)                               ̵̶̶
 Unrealized foreign currency exchange losses, net (d)                                                                   ̵̶̶                     46.0
 Quotient upfront payment (e)                                                                                     ̵̶̶                             7.5
 Other adjustments (f)                                                                                         17.0                             14.4
     Total adjustments                                                                                       184.3                             194.7
 Tax effect of reconciling items (g)                                                                           (5.6)                             (6.3)
 Discrete tax items (h)                                                                                        10.7                              4.7
     Adjusted net income                                                                                    $144.9                             $22.1
     Adjusted basic EPS                                                                                      $0.64                             $ 0.15
     Adjusted diluted EPS                                                                                    $0.62                             $0.15
     Diluted weighted-average ordinary shares outstanding                                                    232.4                             150.3
Unless otherwise noted, dollars are at actual foreign exchange rates.                                                                                    31
Amounts within tables may not add due to rounding.
© Ortho Clinical Diagnostics 2022

Notes to Non-GAAP Reconciliations
(a) Represents expenses related to awards granted under our 2014 Equity Incentive Plan.
(b) Represents restructuring and severance costs related to several discrete initiatives intended to strengthen operational performance and to support building
    our commercial capabilities.
(c) Represents an award from an arbitration proceeding related to one of our collaboration agreements of $8.5 million, partially offset by related legal fees of
    $1.1 million.
(d) Represents noncash unrealized gains and losses resulting from the remeasurement of transactions denominated in foreign currencies primarily related to
    intercompany loans. Beginning in fiscal 2021, we initiated programs to mitigate the impact of foreign currencies related to intercompany loans in our results,
    and such noncash net unrealized gains were approximately $38.0 million for the fiscal nine months ended October 3, 2021. We intend for these programs to
    mitigate the impact of foreign currency exchange rate fluctuations related to intercompany loans in current and future periods. Therefore, effective January
    4, 2021, we no longer exclude noncash unrealized gains and losses from Adjusted EBITDA and Adjusted net income.
(e) Represents an initial, non-refundable upfront payment made to Quotient Ltd. (“Quotient”), one of our partners and suppliers.
(f) Represents miscellaneous other adjustments related to unusual items impacting our results, including the elimination of management fees and noncash
    derivative mark-to-market losses (gains). See information below:

                                                                                                  Fiscal Nine Months Ended
      $ millions
                                                                                               Oct. 3, 2021       Sept. 27, 2020
      EU medical device regulation transition costs                                                       $2.9                $3.3
      Principal shareholder management fee                                                                 2.3                 2.3
      Derivative mark-to-market loss (gain)                                                                0.6                (0.7)
      Other                                                                                                8.7                 9.5
      Total other adjustments                                                                            $14.5               $14.4

(g) Non-GAAP adjustments were tax effected based on the nature of the expense and related jurisdiction, many of which are impacted by valuation allowances
    resulting in little to no tax impact.
(h) We exclude deferred tax resulting from changes in tax law and expiration of statutes, adjustments for uncertain tax positions, and other unusual items not
    related to current operating results.

Unless otherwise noted, dollars are at actual foreign exchange rates.
Amounts within tables may not add due to rounding.                                                                                                                   32
© Ortho Clinical Diagnostics 2022

Adjusted Free Cash Flow
                                                                                                                                      Fiscal Nine Months Ended
 $ millions
                                                                                                                            Oct. 3, 2021                   Sept. 27, 2020
 Net cash provided by operating activities - GAAP                                                                                          $188.2                           $(48.6)
 Adjustments:
     Purchases of property, plant and equipment                                                                                                 (27.2)                       (28.4)
     Proceeds from cross currency swaps                                                                                                         15.2                           2.7
     Milestone payments and other, net                                                                                                            0.2                         (1.8)
     Unusual or non-recurring payments                                                                                                          10.9                          31.0
 Adjusted free cash flow (i)                                                                                                               $187.3                           $(45.1)

(i) We def ine adjusted free cash flow as net cash flows from operating activities accounted for under GAAP less purchases of property, plant
and equipment plus or minus any unusual or non-recurring payments.

Unless otherwise noted, dollars are at actual foreign exchange rates.
Amounts within tables may not add due to rounding.                                                                                                                                    33
© Ortho Clinical Diagnostics 2022

Reported and Constant Currency Revenue Reconciliation
                                                                                       Fiscal Nine Months Ended                                                                                                Constant Currency
 $ millions
                                                                                  Oct. 3, 2021          Sept. 27, 2020                           Percent Change                    Currency Impact               Growth Rate (a)
Core Revenue                                                                                   $1,495.8                       $1,233.7                              21.2%                               2.5%               18.7%
Non-Core Revenue                                                                                   26.0                              15.9                           65.3%                               0.1%               65.2%
Net Revenue                                                                                    $1,521.8                       $1,249.6                              21.8%                               2.5%               19.3%

Segment Net Revenue
      Americas                                                                                  $924.2                           $755.8                             22.3%                               0.6%               21.7%
      EMEA                                                                                       203.5                             168.2                            20.9%                               6.1%               14.8%
      Greater China                                                                              199.1                             162.3                            22.6%                               8.7%               13.9%
      Other                                                                                      195.1                             163.2                            19.6%                               1.0%               18.6%
Net Revenue                                                                                    $1,521.8                       $1,249.6                              21.8%                               2.5%               19.3%

Unless otherwise noted, dollars and growth rates are at actual foreign exchange rates.
Amounts within tables may not add due to rounding. Percentages have been calculated using actual, non-rounded figures.

(a)   The term “constant currency” means we have translated local currency revenues for all reporting periods to U.S. dollars using internally-derived currency exchange rates held constant for each year.
      This additional non-GAAP financial information is not meant to be considered in isolation from or as substitute for financial information prepared in accordance with GAAP.
                                                                                                                                                                                                                                   34
© Ortho Clinical Diagnostics 2022

Reported and Constant Currency Revenue Reconciliation
                                                                                          Fiscal Quarter Ended                                                                                                        Constant Currency
 $ millions
                                                                                  Jan. 2, 2022            Jan. 3, 2021                           Percent Change                    Currency Impact                      Growth Rate (a)
Core Revenue                                                                            $518 ̵̶̶ $520                               $501                                 4%                              (1%)                        4%
Non-Core Revenue                                                                                       2                                16                          (87%)                                     ̵̶̶ %               (87%)
Net Revenue                                                                             $520 ̵̶̶ $522                               $517                                 1%                              (1%)                        2%

                                                                                           Fiscal Year Ended                                                                                                          Constant Currency
 $ millions
                                                                                  Jan. 2, 2022           Jan. 3, 2021                            Percent Change                    Currency Impact                      Growth Rate (a)
Core Revenue                                                                     $2,014 ̵̶̶ $2,016                               $1,735                                16%                                    1%                    15%
Non-Core Revenue                                                                                     28                                 31                          (10%)                                     ̵̶̶ %               (10%)
Net Revenue                                                                      $2,042 ̵̶̶ $2,044                               $1,766                                16%                                    2%                    14%

Unless otherwise noted, dollars and growth rates are at actual foreign exchange rates.
Amounts within tables may not add due to rounding. Percentages have been calculated using actual, non-rounded figures.

(a)   The term “constant currency” means we have translated local currency revenues for all reporting periods to U.S. dollars using internally-derived currency exchange rates held constant for each year.
      This additional non-GAAP financial information is not meant to be considered in isolation from or as substitute for financial information prepared in accordance with GAAP.
                                                                                                                                                                                                                                          35
© Ortho Clinical Diagnostics 2022

Reported and Constant Currency Revenue Reconciliation
                                                                                          Fiscal Quarter Ended                                                                                                        Constant Currency
 $ millions
                                                                                  Jan. 2, 2022            Jan. 3, 2021                           Percent Change                    Currency Impact                      Growth Rate (a)
Core Revenue                                                                            $518 ̵̶̶ $520                               $501                                 4%                              (1%)                        4%
CoV-2 assays                                                                                       (10)                              (26)                           (63%)                                     ̵̶̶ %               (63%)
Core, excluding CoV-2 assays                                                            $508 ̵̶̶ $510                               $475                                 7%                              (1%)                        8%

Unless otherwise noted, dollars and growth rates are at actual foreign exchange rates.
Amounts within tables may not add due to rounding. Percentages have been calculated using actual, non-rounded figures.

(a)   The term “constant currency” means we have translated local currency revenues for all reporting periods to U.S. dollars using internally-derived currency exchange rates held constant for each year.
      This additional non-GAAP financial information is not meant to be considered in isolation from or as substitute for financial information prepared in accordance with GAAP.
                                                                                                                                                                                                                                          36
© Ortho Clinical Diagnostics 2022

    Supplemental Non-GAAP Financial Measures
                                                                                                                                                                                                                       Fiscal
                                                                                                                                                                                                                        Nine
% Growth                                            Fiscal Year                                                                                                                                                        Months
                                                      Ended                                                                               Fiscal Quarter Ended                                                         Ended
                                                   2017     2018                     Q1 19       Q2 19       Q3 19         Q4 19         Q1 20    Q2 20    Q3 20                  Q4 20        Q1 21   Q2 21   Q3 21    Q3 21
Core Revenue Growth Rate                            4.8           0.3                (3.4)        1.3          4.6           2.5          (0.6)       (12.6)          1.6          10.1        23.5    26.2    14.8     21.2
Less: Foreign
                                                   (0.1)          0.5                (2.9)       (2.3)        (0.9)         (0.4)         (1.3)        (2.0)         (0.4)          1.0         2.4     3.7     1.6     2.5
Currency Impact
Core Revenue Constant
                                                    4.8          (0.2)               (0.5)        3.7          5.5           2.9           0.9        (10.8)          2.1           9.1        21.1    22.5    13.2     18.7
Currency Growth Rate
Less: Local HCV and
                                                    3.5          (1.4)                 2.5       (0.1)        (0.3)         (1.5)         (4.0)         1.5          (1.6)         (0.6)        0.2    (2.5)    0.1     (0.7)
Other Adjustments
Core Revenue Constant
Currency Growth Rate                                1.4           1.2                (3.0)        3.8          5.8           4.3           4.8        (12.2)          3.7           9.7        20.9    25.0    13.1     19.4
(excl. local HCV)
Less: CoV-2                                         0.0           0.0                  0.0        0.0          0.0           0.0           0.0          6.4           4.9           5.8         7.1    (4.9)   (2.8)    0.1

Constant Currency
Growth Rate                                         1.4           1.2                (3.0)        3.8          5.8           4.3           4.8        (18.4)         (1.3)          3.9        13.8    29.9    15.9     19.3
(excl. local HCV and CoV-2)

    In Q1 2019 we signed a new supply agreement in Japan related to our HCV business. As a result of the new supply agreement, we recognized increased revenue in Q1 2019 and Q3 2019.
    Revenue recognition is based on the timing of periodic shipments which may create unusual Y/Y variances in certain quarters. Other adjustments include Day 2 countries in 2016 and 2017.

    Percentages have been calculated using actual, non-rounded figures.
                                                                                                                                                                                                                                37
You can also read