JOC Intermodal Savings Index - 2Q 2021 An Analysis of the Domestic Intermodal and Truckload Markets
←
→
Page content transcription
If your browser does not render page correctly, please read the page content below
JOC Intermodal Savings Index
An Analysis of the Domestic Intermodal and Truckload Markets
2Q 2021

Ari Ashe
Senior Editor, Journal of Commerce           Journal of Commerce | Insight
IHS Markit | US Intermodal Savings Index: 2Q21

Table of Contents

© 2021 IHS Markit. All rights reserved.          2   July 2021

IHS Markit | US Intermodal Savings Index: 2Q21

US Intermodal Savings Index                                  increased 7.3 percent compared with 2Q19. The bear
                                                             would counter that 2Q21 domestic container volume is
                                                             only up 0.6 percent compared with 2Q18, yet shippers
An Analysis of the Domestic                                  have suffered through allocation caps, peak season
Intermodal and Truckload Markets                             surcharges, ingate closures, and a reduction in
                                                             reservation slots from the US Class I railroads.
Ari Ashe, Senior Editor, Journal of Commerce
                                                             The 2Q21 service disruptions on BNSF Railway,
The Journal of Commerce (JOC) provides an in-depth           Union Pacific Railroad, Norfolk Southern Railway,
quarterly report into the US domestic intermodal             and CSX Transportation are a significant factor that
market to facilitate conversations between shippers          readers should remember throughout this report.
and logistics companies about modal decisions.               Service is just as important as cost. Slow, unreliable
                                                             service can offset even the highest intermodal savings.
How to Read Our Index
The JOC Domestic Spot Intermodal Savings Index
(“Spot ISI”) and the JOC Domestic Contract
Intermodal Savings Index (“Contract ISI”) is measured
with 100 as a neutral base.

Index values more than 100 signify intermodal rates
are cheaper; values less than 100 indicate truckload
rates are cheaper. Values are linked to percentages:

•   110 = Intermodal rates are 10% cheaper

•   120 = Intermodal rates are 20% cheaper

•   90 = Truckload rates are 10% cheaper

•   80 = Truckload rates are 20% cheaper

Rule of thumb: Higher numbers indicate strong
                                                             Since 2015, the average monthly Contract ISI is 124.9
intermodal savings. Lower numbers indicate strong
                                                             (24.9 percent savings); the average monthly Spot ISI
modal competition. For an in-depth review, please read
                                                             value is 114.5 (14.5 percent savings).
our “Methodology” on page 10.
                                                             Both indexes are higher today than the long-term
Executive Summary                                            averages. However, UP’s spot rate increases in
Domestic intermodal business increased for the fourth        California caused JOC’s Spot ISI to drop 12 points
consecutive quarter in 2Q, growing 16 percent                since March. BNSF-linked intermodal marketing
compared with a year ago, according to the Intermodal        companies (IMCs) raised spot rates to match UP.
Association of North America (IANA). The year-over-
year comparisons are skewed since the dramatic falloff       JOC’s Spot ISI fell under 100 in the second quarter in
in freight volume in the early days of the COVID-19          the Southwest, indicating truck rates were cheaper than
pandemic occurred in 2Q20.                                   rail rates out of California, even though prices are
                                                             significantly higher than a year ago in both modes.
There are two ways to slice the IANA data: a bullish
way and a bearish way. The bull notes how domestic           JOC’s Spot ISI remains near record levels, though, in
53-foot container volume, excluding trailers, rose 15        the Midwest and Southeastern US, keeping the
percent year over year in the second quarter but also        national index value higher than historical norms.

© 2021 IHS Markit. All rights reserved.                  3                                                   July 2021
IHS Markit | US Intermodal Savings Index: 2Q21

The Volume Picture
Domestic intermodal volume is surging into the
Midwest from both the Southwest and Northeast,
according to IANA. From the Southwest to the
Midwest, domestic intermodal volume grew 12 percent
compared with a year ago and 19 percent compared
with two years ago.

Why would the volume increase be stronger compared
with 2019? As you can see below, June 2020 saw the
V-shaped recovery in intermodal volume.

                                                             Despite the tough comparisons going forward, the
                                                             forecast remains optimistic for the back half of this
                                                             year. UP and NS said earnings call that low inventory,
                                                             strong consumer spending, e-commerce sales,
                                                             international trade, and rising truck rates will keep
                                                             intermodal volumes up for the rest of this year and
                                                             create more opportunity for truck-to-rail conversions.
                                                             Parcel volume will be an important factor as UPS,
                                                             FedEx, Amazon, and Walmart take up a lot of
                                                             intermodal train capacity. The business conditions of
                                                             these four companies will be a major factor in rail
The V-shape is a warning that comparisons are more           volume the rest of this year.
difficult going forward. In fact, domestic container
                                                             J.B. Hunt Transport Services has an equally bullish
volume between the Southwest and Midwest declined
4.3 percent year over year in June.                          outlook with its forecast tempered only by service
                                                             disruptions and slow box turns.
When combining Southwest and Northeast to Midwest            “Demand for our intermodal capacity remains robust.
hauls (chart above), volume jumped 30 percent year           In fact, demand continues to significantly outpace our
over year in April but was down 0.4 percent by June.         available capacity which remains constrained by rail
Another way to view volume is through the weekly             performance and restrictions in addition to customer
data of the Association of American Railroads (AAR).         detention of our trailing equipment,” said Darren Field,
In week 28, intermodal volume among all North                J.B. Hunt’s president of intermodal.
American Class I railroads rose 7.7 percent compared         For those following JOC’s news coverage, the
with a year ago but only 1.3 percent compared with           allocation caps in BNSF Hobart, congestion in BNSF
two years ago. Volume began to quickly climb last            Logistics Park Chicago, and domestic intermodal
year in Week 30 — early August — so expect the               volume metering on NS’s network in cities such as
percentages to fall toward zero or turn negative soon.       Atlanta, Bethlehem, Charlotte, Chicago, Croxton (NJ),
Note that AAR data combines international and                Harrisburg, Jacksonville, Kansas City, and St. Louis
domestic intermodal, so ocean containers are included        are well documented. Shippers and IMCs are also
in this analysis.                                            aware of how difficult it is to secure UMAX and EMP
                                                             containers on UP’s domestic intermodal network.

© 2021 IHS Markit. All rights reserved.                  4                                                   July 2021
IHS Markit | US Intermodal Savings Index: 2Q21
The Intermodal Service Discussion when intermodal volume in 2019 and early 2020. Once
the volume rebounded, trip plan compliance fell again,
Most of this report will outline how soaring truck rates
especially in the last three months.
have delivered strong intermodal savings on both spot
and contract freight in the US. However, it is vital to Even interchanges are unreliable, according to an IMC
analyze how savings come with another cost: slower, that said UP-CSX service from Los Angeles to
inconsistent service. Indianapolis often takes 21 days now compared with
7-10 days in the past.
A thorough analysis of the current intermodal market
must profile both rates and service. Another way to judge service is how many laden
intermodal cars idle for at least 48 hours.
Intermodal train speeds were down 2.2 miles per hour
compared with the rolling five-year average in the
second quarter. Train speeds are down 3 miles per
hour since February compared with a year ago,
according to AAR, translating to an additional six to
10 hours of transit between Los Angeles and Chicago.
Here is an eye-opening statistic: Between Weeks 13
and 27, the number of loaded BNSF and UP
intermodal cars that have not moved in at least 48
hours has skyrocketed 333 percent compared with
2020 and 140 percent versus 2019!
Historical data shows intermodal train speeds are A total of 10,339 loaded cars were idle for at least 48
inversely proportional to volume: PSR or no PSR. hours on BNSF or UP in this period.
When volume goes up, intermodal train speeds and on- NS domestic intermodal service has also been
time performance go down. disrupted because of the recall of 5,100 chassis in
June. The eastern US railroad said July 28 that repairs
on 75 percent of its chassis will be completed by the
end of August, and it will bring on leased 53-foot
chassis in September to restore normal service.
“We were already short on chassis because of
elongated street dwell associated with warehouse and
drayage community pressures,” said Alan Shaw,
executive vice president of marketing and sales for NS.
Service has been metered to Atlanta (Austell),
Bethlehem, Charlotte, Croxton, Harrisburg,
Jacksonville, and Pittsburgh. Auxiliary lots have also
UP’s intermodal trip plan compliance proves the been opened in Jacksonville.
validity of this maxim. Trip plan compliance rose
© 2021 IHS Markit. All rights reserved. 5 July 2021IHS Markit | US Intermodal Savings Index: 2Q21
The Intermodal Rate Discussion rose in the Southeast to 129.7 in 2Q21, up from 110.8
in 2Q20, and 106.1 in 2Q19.
JOC’s Spot Intermodal Savings Index
If the Spot ISI in the Midwest and Southeast, which
As we predicted in our 1Q21 report, the second quarter
represents about 45 percent of the national weighting,
was chaotic in terms of intermodal savings. While our
remains elevated because spot truckload rates remain
rolling 12-month data shows strong savings, a three-
high, then the national index may not collapse. If truck
month window shows a great deal of volatility.
rates cool out of Atlanta or Chicago, however, expect a
quick and steep decline in JOC’s Spot ISI nationally.
JOC’s Contract Intermodal Savings Index
On a rolling 12-month basis, the JOC Contrast ISI and
JOC Spot ISI have risen in the last three months.
While July spot truckload rates show no signs of a
slowdown, there are trucking analysts who believe the
market will peak and plateau soon. Our data does show
spot intermodal rates rose 21 cents per mile, while spot
truckload rates grew only 6 cents in 2Q.
Index values in California show this trend. JOC’s Spot
ISI averaged 114.8 between January and April 2021 In June, truckload contract rates were up 38 percent
but plunged to 91.5 average over the last two months year over year while intermodal contract rates were up
after spot rates were increased in Los Angeles-Ontario, 4 percent based on our 117 indexed lanes.
and Oakland-Stockton.
JOC’s Spot ISI from Los Angeles to Chicago hit 128
in the first quarter, then fell to 113.7 in May after UP
increased spot rates $1,500 in April. The valued
dropped to 94.4 in June when spot rates went up
another $1,500.
Expect the Southwest Spot ISI to fall even further, as
UP raises surcharges on low-volume shippers in
California to $5,000 per container on Aug. 8. Spot
rates hikes in April and June will be raised again
$2,000 in California to sync the surcharge rate to the
spot rate.
JOC’s Spot ISI in the Midwest remains high with a
Alan Shaw of NS noted the lag in intermodal contract
three-month average of 127.6 in 2Q21 compared with
rates will reset during the next bid cycle. “We would
110.4 in 2Q20, and 107.9 in 2Q19. The Spot ISI also
expect next year to see more improvement in year over
© 2021 IHS Markit. All rights reserved. 6 July 2021IHS Markit | US Intermodal Savings Index: 2Q21
year prices than we see this year, but we are not going Chicago to Dallas, Jacksonville to Dallas, and Los
to see a huge uptick like you see in the spot market,” Angeles to Denver are lanes where trucks are faster,
he said. more reliable, and price competitive with intermodal.
Los Angeles to Seattle delivers a strong 20-25 percent
The Distance Discussion savings on intermodal contracts, but spot rate increases
The length of haul is a key factor in modal decisions. on BNSF and UP have made trucks cheaper on
Shippers benefit from lower fuel costs more on longer transactional business.
lengths of haul, especially with higher diesel prices.
Intermodal can deliver strong savings in both directions
Less than 700 Miles between Chicago and Jacksonville, Chicago and
Orlando, and Elizabeth (NJ) and Atlanta.
We track seven lanes in this distance. JOC’s Contract
ISI was 119.4 and the Spot ISI was 100.2 on a rolling Be aware, though, that NS service disruptions have
12-month basis. We have minimal contract data since occurred several times in Chicago, Elizabeth (Croxton),
there are not many shippers with an intermodal contract and Jacksonville since January. NS’s ongoing chassis
between Atlanta and Jacksonville, for example. Our repairs have also significantly reduced domestic
transactional rates show intermodal does not provide intermodal throughput since June and will remain a
savings on these short lengths of haul. constrained through the end of August. Auxiliary lots
have also been set up in Jacksonville with space for
Trucks are cheaper for Atlanta-Jacksonville, Atlanta-
domestic containers at a premium.
Orlando, and Salt Lake City-Los Angeles. Shippers
sending freight on CSX between Syracuse and Chicago 1,200 to 2,000 Miles
or Chicago and CSX Chambersburg save money using
intermodal. Chambersburg is located in a rural section JOC’s Contract ISI was 125.6 and JOC’s Spot ISI was
of southern Pennsylvania near the Maryland border, so 117.3 on a rolling 12-month basis through June.
a regional dray may tip the scales back to trucking.
This a bellwether number because busy origin-and-
800 to 1,200 Miles destination pairs such as Los Angeles-Dallas, Los
Angeles-Kansas City, and Kansas City-Elizabeth fall
This distance has the most heated modal competition. into this segment.
JOC’s Contract ISI was 123.9 and JOC’s Spot ISI was
114.4 on a rolling 12-month basis. While this distance
of lanes underperformed the national market in the past,
the savings are now on par with national numbers.
Our five Chicago outbound lanes — to El Paso, Laredo,
Miami, Salt Lake City, and San Bernardino — deliver
at least 20 percent savings to shippers. Our two Dallas
lanes to Elizabeth (NJ) and Los Angeles also deliver at
least 20 percent savings. Outbound Los Angeles lanes
© 2021 IHS Markit. All rights reserved. 7 July 2021IHS Markit | US Intermodal Savings Index: 2Q21
in this segment and the 2,000+ mile segment follow the The graph is very similar when isolated to Los Angeles
theme throughout this report: significant contract rates, to Chicago, a distance of 2,025 miles.
no spot rate savings due to the rate hikes. With a
contract, shippers can save more than 35 percent but any Each dip in Los Angeles corresponds to a pricing
load subject to a contract surcharge or a spot rate will change. In 3Q19, UP issued peak season surcharges and
be cheaper on a truck. spot rate increases. In February-April 2020, the
COVID-19 pandemic caused volume and rates to
2,000 Miles+ plunge in Los Angeles for ports, railroads, and trucking
companies. Between August and December 2020, UP
These are the lanes heavily skewed to Los Angeles-
issued a record $5,000 surcharge on low-volume
Ontario, and Oakland-Stockton. As mentioned before,
shippers out of Los Angeles. And UP has issued a
there are significant contract intermodal savings but
$3,000 surcharge and raised spot rates an equal amount
quickly eroding spot intermodal savings.
this year, a rate that UP take even higher in 3Q21.
JOC’s Contract ISI average was 138.2 and JOC’s Spot
ISI was 119.9 on a rolling 12-month basis through June.
So what does this translate to in dollars and cents on
spot business? From Los Angeles to Chicago, shippers
Remember these charts are rolling 12-month averages, should expect to pay around $6,000 over the road, based
so recent pricing actions have not made a large dent. on a JOC analysis of data from Cargo Chief, DAT
When broken down month-by-month, the Los Angeles Freight & Analytics, Loadsmart, and a survey of 3PLs
outbound data shows how surcharges and spot rate and shippers.
hikes have hurt the overall price savings in Los Angeles.
Shippers should expect to pay at least $6,000 on spot
intermodal, although other published rates range from
$7,500 to $8,500 door-to-door.
From Los Angeles to Dallas, shipper rates on truck are
$5,000 to $5,500 using trucks and $6,000 to $7,000
using intermodal.
Now that UP is raising all California spot rates again on
Aug. 6, expect the scales to tip even farther toward
truckload in Los Angeles, Ontario, Oakland, and
Stockton.
© 2021 IHS Markit. All rights reserved. 8 July 2021IHS Markit | US Intermodal Savings Index: 2Q21
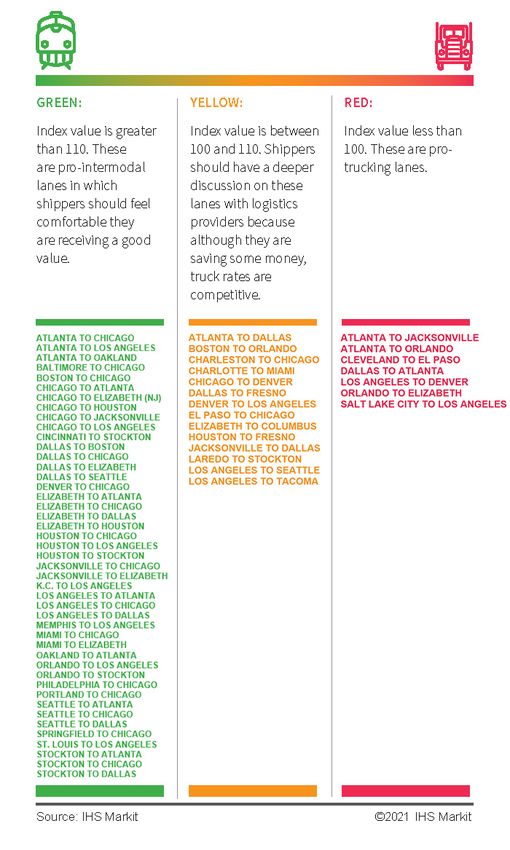
The Lane-by-Lane Breakdown It’s important to note that our Traffic Light
Infographic is done on a rolling 12-month basis and
In this section, we examine which markets are pro-
intermodal, pro-trucking, and up for grabs. merges contract and spot market index values.
For a shipper seeking a 12-month contract, the Los
Please evaluate the next infographic like a traffic light. Angeles, Oakland, and Stockton lanes are
appropriately placed in this infographic. For a shipper
Green means go — strong intermodal savings. using intermodal on a spot basis, the Los Angeles,
Yellow means slow down — truck is competitive. Oakland, and Stockton lanes are either yellow or red.
Red means stop —no intermodal savings.
Regional Breakdown
Given accessorial fees, including rail storage
(demurrage), detention, per diem, and block and
bracing, a yellow lane can easily flip red because we
exclude this in our calculation.
© 2021 IHS Markit. All rights reserved. 9 July 2021IHS Markit | US Intermodal Savings Index: 2Q21
Quotes from Earnings Calls Methodology
“[Shippers] don't have the inventory exactly where The Journal of Commerce evaluates more than 190
they wanted or at the timing that they wanted. I think lanes in our study of intermodal savings. We send
there are concerns about this Christmas season and estimates on 45 lanes to 3PLs and shippers under non-
will they have all of the necessary inventory on shelf disclosure agreements.
or available through e-commerce channels. That's a
concern of our customers. Inventory will take some Our estimates include margins and fuel but exclude
time to catch up to more normal levels,” — Shelley accessorial fees such as detention, demurrage, per
Simpson, chief commercial officer for J.B. Hunt diem, lumper fees, blocking and bracing. Our
Transport Services. contributors review transactions and provide broker-to-
shipper invoice rates. Those responses are used to
“We’ve taken numerous actions to mitigate the calculate the two indexes.
customer impact and area actively working with all the
The base value is 100, which means intermodal and
parties in the supply chain. Even so, it’s likely these
issues [international and domestic intermodal] will truckload rates are identical. If intermodal door-to-
persist through the end of the year.” — Lance Fritz, door rates are 20 percent cheaper, JOC’s index value is
CEO of Union Pacific. 20 percent greater than 100, or a value of 120. If
trucking door-to-door rates are 20 percent cheaper,
“It is an enormous challenge for us to go out and find then the value is 20 percent less than 100, or a value of
people that want to be conductors on the railroad, just 80.
like it's hard to find people that want to be baristas or Ten percent savings would equal 110 or 90, depending
anything else. It's very, very difficult.” — Jim Foote, on which mode is cheaper. Thirty percent savings
CEO of CSX.
would be 130 or 70, depending on which mode is
“I have never seen any kind of a thing like this in the cheaper.
transportation environment in my entire career where JOC calculates regional index values for the Midwest,
everything seems to be going sideways at the same Mountain, Northeast, Northwest, Southeast, South
time. Despite all that, we have been able to keep our Central, and Southwest US, using the IANA’s map.
terminals open in Chicago and I hope we can continue
to do that.” — Jim Foote, CEO of CSX. A national number is calculated on a weighted basis
using IANA’s 53-foot equipment flow data.
“In terms of the STB, most of what we handle is truck Acknowledgements
competitive. Most of the freight on our rails will move
on truck if move rates above a truck competitive Although we are prohibited from disclosing the
level,” — Jim Squires, CEO of Norfolk Southern. identities of several 3PLs and shippers contributing to
the JOC Intermodal Savings Index, we thank them for
“Intermodal rates lag truck rates pretty significantly. providing us critical data to do our analysis.
So there is a lot of headroom for us and as our service We can identify are Cargo Chief, DAT Freight &
product improves, there is going to be even more
Analytics, InTek Freight and Logistics, Loadsmart,
demand for what we are putting out there,” — Alan
Sunset Transportation, Transfix, and Zipline Logistics.
Shaw, executive vice president of marketing and sales,
Norfolk Southern. Each are valued JOC Intermodal Savings Index
partners.
Transfix is a digital online freight broker.
Loadsmart — a competitor to Transfix — provides
data for our JOC Shipper Spot Truckload Rate Index,
tracking broker-to-shipper rates on more than 4,000
© 2021 IHS Markit. All rights reserved. 10 July 2021IHS Markit | US Intermodal Savings Index: 2Q21 lanes, which we compared with our smaller JOC Intermodal Savings Index sample. We thank Rick LaGore, CEO of InTek, who provides JOC weekly spot intermodal data on more than 115 lanes. We adjust his numbers using published FAK rates from the Class I railroads and asset-based IMCs to get additional snapshots of the spot market. We thank IANA for providing JOC data monthly 53- foot container flows to allow us to weigh our national number to actual market conditions. We thank the DAT Freight & Analytics team that ensures our estimates sent to 3PLs and shippers are accurate. Our goal is to build on the data from Cargo Chief, DAT, IANA, InTek, Loadsmart, Sunset, Transfix, and Zipline Logistics to deliver analysis that can facilitate discussions between shippers and IMCs. We highly encourage our readers to contact us and our data contributors if you have further questions. Finally, we thank our parent company, IHS Markit, for their continued support of JOC. Ari Ashe Senior Editor, Journal of Commerce 202-548-7895 (work) LinkedIn: https://www.linkedin.com/in/ariashe/ Twitter: https://twitter.com/arijashe Email: ari.ashe@ihsmarkit.com © 2021 IHS Markit. All rights reserved. 11 July 2021
Disclaimer
The information contained in this report is confidential. Any unauthorized use, disclosure, reproduction, or dissemination, in full or in part, in any media or by any means, without the
prior written permission of IHS Markit Ltd. or any of its affiliates ("IHS Markit") is strictly prohibited. IHS Markit owns all IHS Markit logos and trade names contained in this report that
are subject to license. Opinions, statements, estimates, and projections in this report (including other media) are solely those of the individual author(s) at the time of writing and do
not necessarily reflect the opinions of IHS Markit. Neither IHS Markit nor the author(s) has any obligation to update this report in the event that any content, opinion, statement,
estimate, or projection (collectively, "information") changes or subsequently becomes inaccurate. IHS Markit makes no warranty, expressed or implied, as to the accuracy,
completeness, or timeliness of any information in this report, and shall not in any way be liable to any recipient for any inaccuracies or omissions. Without limiting the foregoing, IHS
Markit shall have no liability whatsoever to any recipient, whether in contract, in tort (including negligence), under warranty, under statute or otherwise, in respect of any loss or
damage suffered by any recipient as a result of or in connection with any information provided, or any course of action determined, by it or any third party, whether or not based on
any information provided. The inclusion of a link to an external website by IHS Markit should not be understood to be an endorsement of that website or the site's owners (or their
products/services). IHS Markit is not responsible for either the content or output of external websites. Copyright © 2020, IHS Markit®. All rights reserved and all intellectual property
rights are retained by IHS Markit.
You can also read