Key Biodiversity Areas and Impact Assessment in BRI-covered Areas - December 2020
←
→
Page content transcription
If your browser does not render page correctly, please read the page content below
BRI International Green Development Coalition
              2020 Policy Study Series

Key Biodiversity Areas and Impact
Assessment in BRI-covered Areas

                                        December 2020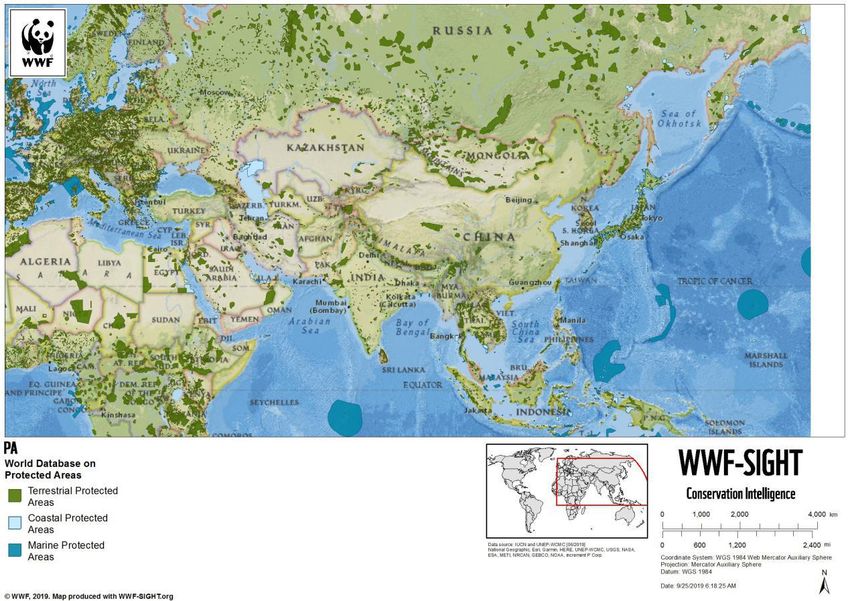
In April 2019, Chinese and international partners officially
launched the BRI International Green Development
Coalition (BRIGC) at the Second Belt and Road Forums for
International Cooperation. BRIGC aims to establish a policy
dialogue and communication platform, an environmental
knowledge and information platform, and a green
technology exchange and transfer platform, so as to
advance global consensus, understanding, cooperation,
and action of a green Belt and Road Initiative (BRI).

From the perspective of transportation infrastructure
development, this report focuses on the research of Key
Biodiversity Areas (KBAs) in the BRI region, as well as their
conservation strategies, from the following aspects. First is
the current status of biodiversity in regions along the Belt
and Road. With technologies such as remote sensing and
geographical information systems, we have analyzed the
biodiversity sensitivity of different regions and identified
the ecological risks stemming from the implementation of
the BRI. Second is the relevance between transportation
infrastructure construction and biodiversity conservation,
as well as the potential impacts. Third is the current status
and trends of biodiversity conservation. Building on exem-
plary experiences in biodiversity conservation, policy
recommendations have been proposed to enhance
biodiversity conservation in the BRI regions.

Secretariat of BRIGC Ms. Qiao Yujie
Tel: +86-10-82268647
Fax: +86-10-82200535
Address: No. 5, Houyingfang Hutong, Xicheng District,
Beijing 100035, China
Website: www.brigc.net
Email: brigc@fecomee.org.cn; brigcsecretariat@163.com
Key Biodiversity Areas and Impact Assessment in BRI-covered Areas

                                    Research Team*

Dr. ZHANG Linxiu, UNEP International Ecosystem Management Partnership (IEMP)
Dr. WANG Guoqin, UNEP International Ecosystem Management Partnership (IEMP)
Dr. XU Xiangbo, Institute of Geographic Sciences and Natural Resources Research, Chinese Academy
    of Science
Mr. TIAN Fang, Foreign Environmental Cooperation Center, Ministry of Ecology and Environment of
    China
Ms. LI Nan, World Wide Fund for Nature (WWF) China
Mr. ZHANG Cheng, International Union for Conservation of Nature (IUCN)
Ms. ZHANG Yu, Conservation International (CI)
Ms. WEI Xiaona, Institute of Geographic Sciences and Natural Resources Research, Chinese
    Academy of Science

* The authors and advisors of this policy study come from the Thematic Partnership on Biodiversity
and Ecosystem Management of BRIGC and serve in their personal capacities. The views and
opinions expressed in this report are those of the individual experts participating in the research
and do not represent those of their organizations and the BRI International Green Development
Coalition.

                                                 i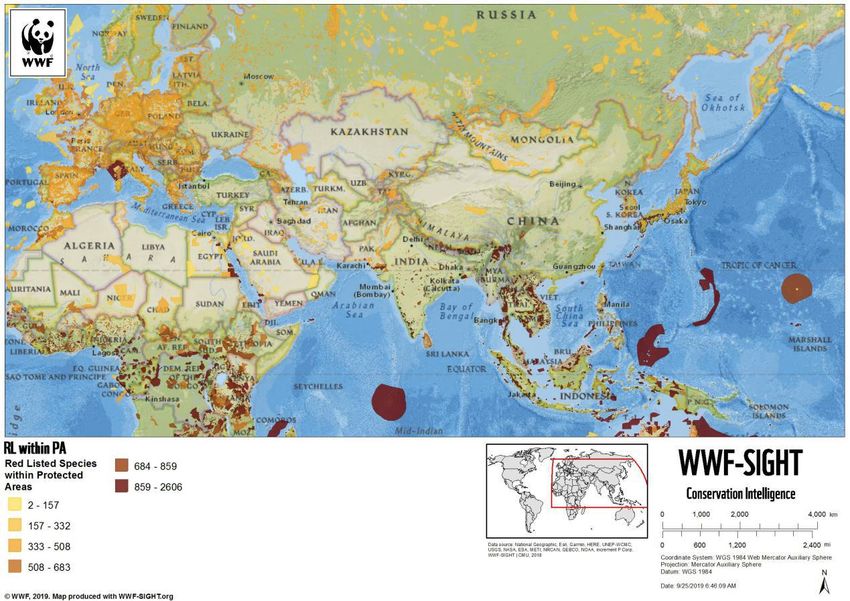
BRI International Green Development Coalition

                                                    TABLE OF CONTENTS
EXECUTIVE SUMMARY................................................................................................. III

1. GEOGRAPHICAL CONDITIONS ALONG THE BELT AND ROAD..................................................1

   1.1 CLIMATE FEATURES···················································································· 1
   1.2 FEATURES OF NATURAL RESOURCES··································································· 2
   1.3 GEOLOGICAL FEATURES OF CULTURES AND ECONOMICS··············································· 5

2. KEY BIODIVERSITY AREAS ALONG THE BELT AND ROAD......................................................... 7

   2.1 EXISTING BIODIVERSITY DATABASES........................................................................................... 7
   2.2 IDENTIFICATION OF KBAS ALONG THE BRI CORRIDORS.................................................................9
   2.3 SENSITIVITY ANALYSIS OF BIODIVERSITY IN THE SIX ECONOMIC CORRIDORS OF THE BRI................... 15

3. IMPACT OF TRANSPORTATION INFRASTRUCTURE ON BIODIVERSITY UNDER THE BRI..... 21

   3.1 ANALYSIS OF RAILWAY PROJECT’S AWARENESS OF ECOLOGICAL ENVIRONMENT.............................. 23
   3.2 ANALYSIS OF THE HIGHWAY PROJECT’S AWARENESS OF ECOLOGICAL ENVIRONMENT[6]...................26
   3.3 MONITORING AND ASSESSMENT OF THE IMPACT OF TRANSPORTATION INFRASTRUCTURE PROJECTS ON THE
   ECOLOGICAL ENVIRONMENT........................................................................................................ 30

4. CASE STUDY: CHINA-RUSSIA INTERNATIONAL LAND-SEA TRANSPORT CORRIDOR........... 40

5. FUTURE OUTLOOK...................................................................................................................... 46

APPENDIX: CHINA’S BIODIVERSITY CONSERVATION POLICIES FOR REFERENCE..................... 49

                                                                         ii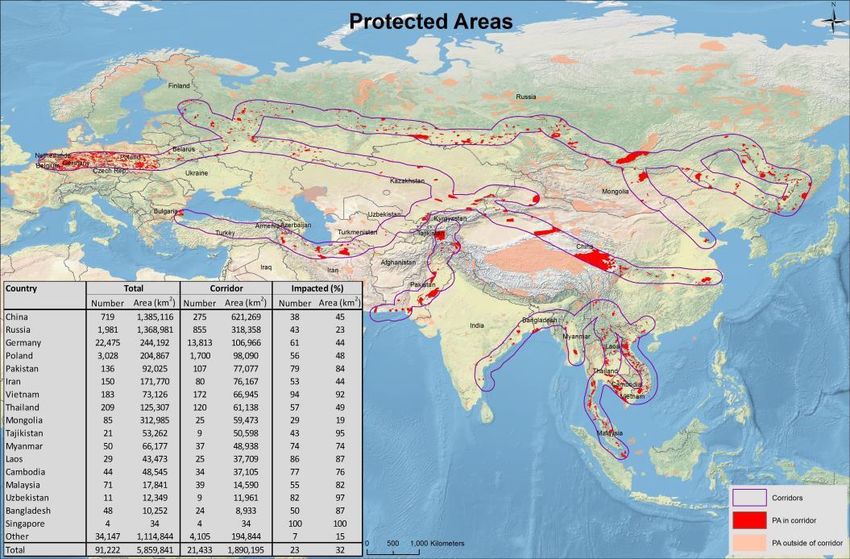
Key Biodiversity Areas and Impact Assessment in BRI-covered Areas

                                   Executive Summary
Biodiversity is fundamental for the survival and development of human society. Biodiversity
protection is one of the core ecological environmental issues of global concern. The Belt and Road
Initiative (BRI), with regional connectivity at its core, runs through a number of biodiversity
hotspots, wilderness areas and other key conservation areas. Infrastructure construction, such as
transportation construction, plays an important role in BRI cooperation. Infrastructure projects
usually last for a long period of time and have big impacts on environment. If not properly planned,
it will bring huge potential risks to biodiversity protection in the coming decades. Therefore,
biodiversity conservation must be taken into serious account in BRI transportation infrastructure
projects.

The countries joining BRI are mainly located on the Eurasian continent, covering both the east and
west ends of the continent. BRI region has diverse climates and diverse landforms. The distribution
of water resources and land resources varies in this region, while its per capita water resources are
less than 2/3 of the global average, and its per capita arable land is about 3/4 of the global average.
BRI region has abundant natural resources thanks to its complex and comprehensive geological
phenomena. The oil and gas resources of BRI region account for 58% and 54% of the world total
respectively, with the Middle East being the most abundant. As for mineral resources, the reserves
of ferrous and non-ferrous metals in the BRI region are among the top in the world, and the
reserves of non-metallic minerals in the BRI region are also considerable.

In order to further assess biodiversity status in the BRI region, this report carried out biodiversity
visualization and sensitivity analysis of important regions of biodiversity. In order to recognize key
areas for biodiversity, this report consolidated existing biodiversity databases including the World
Database on Protected Areas, the World Database of Key Biodiversity Areas, WWF Priority
Ecoregions, IUCN Red List of Threatened Species and Biodiversity Hotspots Reserve database. Based
on those databases, we used WWF-SIGHT to visualize important biodiversity areas along BRI region.
The identification results showed that BRI important biodiversity areas are mainly concentrated in
Southeast Asia, India-Myanmar border, Europe and South Africa, where their climate and landscape
contribute to forming good habitats.

In order to analyze the biodiversity sensitivity of the BRI region, this report selected typical
biodiversity conservation habitats and identified the sensitivity factors suitable for the assessment
areas according to natural, social and economic conditions. Through the comprehensive ecological
sensitivity assessment, the ecological environment sensitivity was evaluated qualitatively and
quantitatively by taking ecological system changes, animal and plant species and habitats changes,
migration routes and other factors into overall consideration.

The result showed that in terms of geographical distribution, from east to west, the overall
potential impact of BRI infrastructure construction on important biodiversity regions is decreasing.
From south to north, there is also a downward trend. Infrastructure construction has the greatest
overall impact on BRI important biodiversity regions in Southeast Asia and the easternmost border
area between China and Russia in Eurasia, where ecological environment sensitivity is high. The

                                                  iii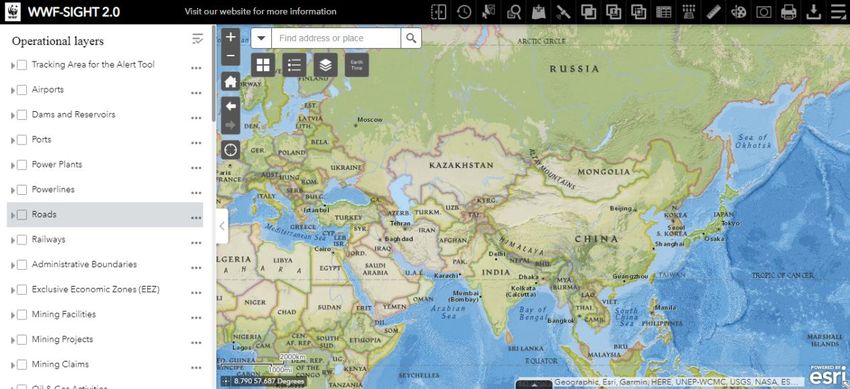
BRI International Green Development Coalition

infrastructure impact on biodiversity in Central and Eastern Europe is generally less, where
ecological environment sensitivity is relatively low. Development-wise, in developed regions in
Europe, the overall impact of infrastructure construction on important biodiversity regions is
relatively less, while in developing regions in Southeast Asia, Central China and border areas
between China and Russia, the overall impact is relatively bigger. In terms of specific potential
impacts, 32% of national protected areas in the BRI countries can be affected, and the BRI
economic corridor overlaps with 265 threatened species distribution area. In general, there is a
huge potential overlap between the BRI economic corridors and important areas of biodiversity.
These areas are overlapped high risk areas where infrastructure construction may have negative
impacts. Further in-depth analysis of these potential high risk areas is necessary to help identify
potential solutions and create opportunities for ecological infrastructure investment.

Among BRI projects’ impacts on biodiversity, the impact of transport infrastructure is particularly
worthy of analysis. The transportation infrastructure plays an important role in promoting the
economic development and trade and culture exchanges of the BRI region. However, as a linear
network, transportation network cuts habitats with its long distance and wide range of traffic
channels, bringing irreversible and far-reaching impacts on these surrounding ecosystems. The
impacts of transportation infrastructure on biodiversity can be seen during construction period and
operation period, including the deterioration of habitats and the disturbance of biological
community structure, etc.

The road and railway networks among BRI countries varies. In general, the railway networks of
Mongolia-Russia region and China are relatively complex, while China has the longest highways. On
the other hand, there is great space for railway and highway development in Central Europe and
Central-Western Asia.

This report visualized the overlaps of railway and road networks and important biodiversity
conservation areas, and measured the impacts of the railway and road networks on biodiversity
according to their degrees of overlapping. This report also selected a series of representative
transportation infrastructure projects, and focused on measuring their impacts on vegetation cover
and ecological resources, so as to specifically present the impacts of infrastructure on biodiversity
sensitivity. The analysis results showed that the projects under construction have potential effect
on ecological environment, while biodiversity losses are addressed after the establishment of those
projects in couples of years.

To further explore how to harmoniously deal with the interaction between infrastructure and
biodiversity, this report took the Sino-Russian land sea intermodal transport corridor project as an
example for further analysis. The international transport corridor between China and Russia is rich
in species and has fragile and diverse ecosystems. At the same time, it is an important gateway for
cooperation between China and Russia, and has an important strategic area for economic
development. Therefore, it is important to address these ecological environment issues during the
construction and development of infrastructure in this region. Many strategies have been adopted
to protect the biodiversity of the area. These measures include: Improved project top design to
reduce ecological risks; establishing transboundary nature reserves through multi-level cooperation;

                                                        iv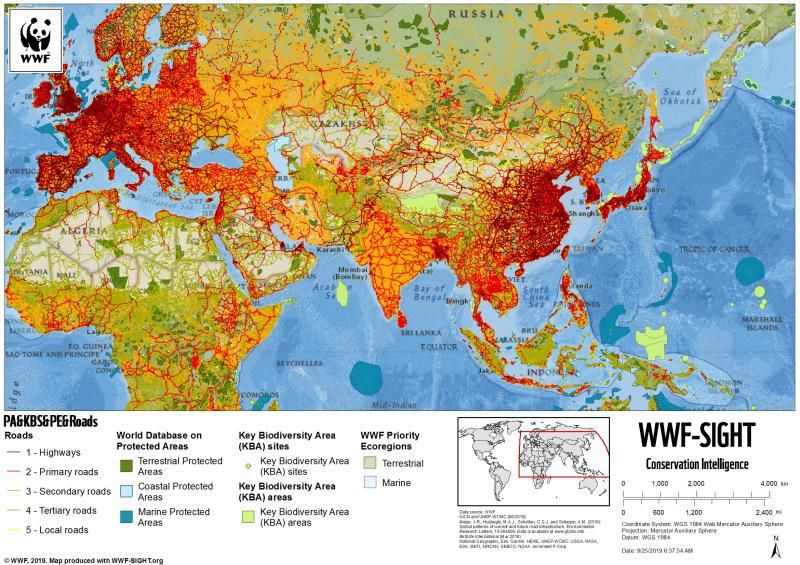
Key Biodiversity Areas and Impact Assessment in BRI-covered Areas

joint monitoring environmental quality and sharing experiences.

Looking forward, there are many areas for our attention, considering their rich biodiversity and
fragile ecological environment in BRI region. Related negative impacts of these projects on local
biodiversity must be measured, assessed and reduced to ensure effectively implementation of such
infrastructure projects. It is important to evaluate the project impact on biodiversity during the
project planning phase, and it is recommended to use biodiversity assessment tools when assessing
project feasibility. Furthermore, the topic of how to improve transboundary cooperation on
biodiversity conservation of global importance is also worth exploring.

Based on this, we put forward the following four recommendations: gearing up the BRI
infrastructure guidelines with the UN Sustainable Development Goals of the United Nations,
advocating for the use of biodiversity assessment tools before investing infrastructure projects,
incorporating principles related to biodiversity conservation into the BRI green finance framework,
strengthening science-based support and promoting the consistency of standards and norms
related to biodiversity conservation.

                                                 v
Key Biodiversity Areas and Impact Assessment in BRI-covered Areas

Human beings depend on biodiversity for their survival and development. Biodiversity plays a
crucial role in meeting people’s basic needs for clothing, food, shelter and transportation, as well as
many other aspects of people’s material and cultural lives. In addition to China, the Belt and Road
Initiative (BRI) mainly includes countries in Southeast Asia, West Asia, South Asia, Central Asia,
Central Europe and Eastern Europe, covering around half of the world’s population. The ecosystems
of these countries are exceptionally complex and diverse. Some regions are endowed with
abundant natural resources, although their ecological environments are vulnerable and sensitive,
posing serious challenges for them in biodiversity conservation and sustainable development.

1. Geographical Conditions along the Belt and Road
Geographical conditions are the foundation of biodiversity. Most BRI-participant countries are
situated in Eurasia and stretch across the vast continent from west to east. Apart from their diverse
climate types, their different natural resources and their abundant array of landforms, the
population densities of these countries vary significantly. Under these different natural conditions,
different cultures have flourished, resulting in development gaps among these countries.

Eurasia is the largest continental area on Earth, covering a land area of 55 million square kilometers;
Asia accounts for 80% of the landmass. The geographical features of Eurasia are characterized by its
vast landlocked arid area (more than 20 million square kilometers), broken and zigzagging
coastlines, huge peninsulas (with a total land area surpassing 10 million square kilometers),
transcontinental plateaus and mountains, countless inland seas and fertile alluvial plains. This
geographical macrostructure has not only shaped the natural conditions of Eurasia but has also
affected its population distribution, as well as its economics, trade and geopolitics.

    1.1 Climate Features1

In Eurasia, temperatures drop progressively from southwest to northeast, while precipitation
decreases from the coastal areas to landlocked areas. The inner part of Eurasia, which is extremely
arid, is mainly composed of deserts and arid grassland, with little precipitation, low temperatures
and poor land productivity. By contrast, the coastal areas are rather humid (except for those on the
Arabian Peninsula), including the plains in eastern China, the Great European Plain and other major
peninsulas. Arable land and populations are mainly distributed in these areas due to their high land
productivity.

Covering the polar, temperate and tropical zones from north to south, Eurasia is surrounded by the
world’s four oceans and contains a large variety of complex landforms, including “the Roof of the
World” — the Tibetan Plateau — which generates many region-specific climate types. These climate
types can be roughly divided into ten groups: (1) the tropical monsoon climate (which includes the
southeast peninsula of Sulawesi), (2) the subtropical monsoon climate (which includes southeast
China, Japan and South Korea), (3) the temperate monsoon climate (which includes northern China,

1
  Liu Weidong, et al. Joint Construction of Green Silk Roads: Social, Economic and Environmental Context, The
Commercial Press, 2019.

                                                         1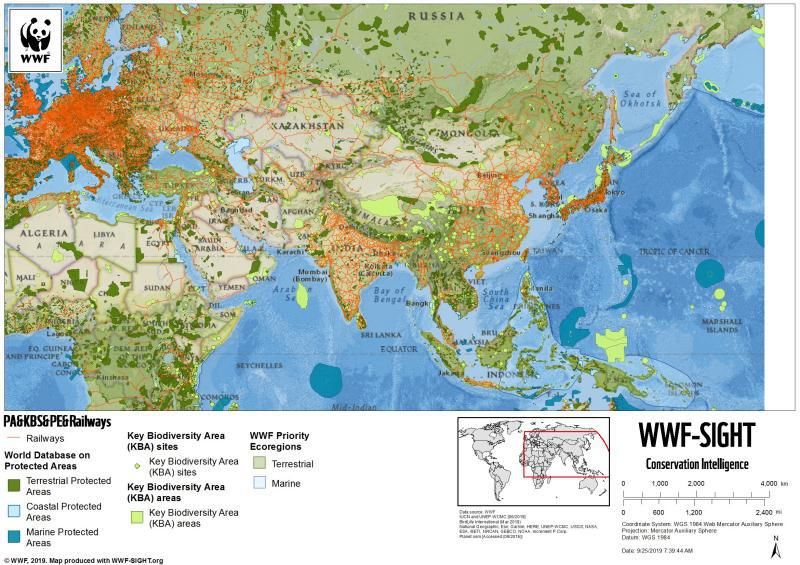
BRI International Green Development Coalition

northeastern China and northeast Asia), (4) the highland climate (which includes the Tibetan
Plateau, the Ethiopian Highlands and the Iranian Plateau), (5) the temperate continental climate
(which includes areas located between 35° N and 50° N in Asia, as well as Central Europe and
Eastern Europe), (6) the subpolar continental climate (which includes areas of Eurasia above 65° N),
(7) the polar tundra climate (which includes areas within the Arctic Circle in Eurasia), (8) the tropical
dry climate (stretching from Southwest Asia to North Africa), (9) the Mediterranean climate (along
the Mediterranean Sea) and (10) the temperate oceanic climate (Western Europe).

Regarding temperatures, Eurasia boasts four distinct seasons with huge temperature differences
between extremely-high-temperature areas and extremely-low-temperature areas. In summer, the
average temperature is above 10° C in most areas and may surpass 35° C in some low-latitude areas,
although the temperature differences between regions is relatively small. In winter, however, the
average temperature in different regions varies drastically. The coldest part — Northeast Eurasia —
can be as cold as −40° C, while the temperatures of low-latitude regions may reach 30° C. Apart
from latitudinal differences, landforms and the distribution of land and water can also significantly
affect regional temperature differences. The Tibetan Plateau is a relatively localized
low-temperature zone. Affected by the Gulf Stream, northwest Europe is much warmer than
northeast Asia, especially in winter.

Due to the impact of summer monsoons, the annual precipitation in East Asia decreases
progressively from the coastal areas in the southeast to the landlocked areas in the northwest. The
rainy Southeast Asia has a recorded annual precipitation of more than 1,500 millimeters; whereas
in dry regions like West Asia, Central Asia and northwest China, less than 200 millimeters of annual
precipitation is reported. With a temperate oceanic climate, Western Europe’s annual precipitation
hovers around 800 millimeters, while that of Eastern Europe and North Asia is around 400
millimeters. Generally speaking, the geographical and seasonal factors affecting precipitation are
more complex than those affecting temperatures.

As for aridity, the western part of East Asia, Central Asia, and some places in Siberia are the typical
arid lands and semi-arid lands. Located far away from the oceans, these areas are most vulnerable
to dryness due to the continental climate and the prevailing westerlies. The aridity of Mongolia,
Central Asia, the Arabian Peninsula, and Iranian Plateau is severe and long-lasting, especially the
Arabic Peninsula and the Iranian Plateau where the dryness may last for 20 months. With a greater
annual precipitation, however, Southwest Asia has been also confronted with high risks of drought
in specific years. In the past five decades, Southwest Asia has reported two severe droughts
(1999/2000 and 2007/2008). Europe is bordered by the Atlantic Ocean in the west, and droughts
have been reported not only in its semi-dry areas such as countries along the Mediterranean Sea,
but also in some humid areas such as the British Isles, Scandinavia, and Russia. Generally speaking,
Southern Europe is more vulnerable to droughts than other parts of Europe in terms of the
frequency, persistency, and severity.

  1.2 Features of Natural Resources

As one of the enabling factors for biodiversity, natural resources play an indispensable role in

                                                        2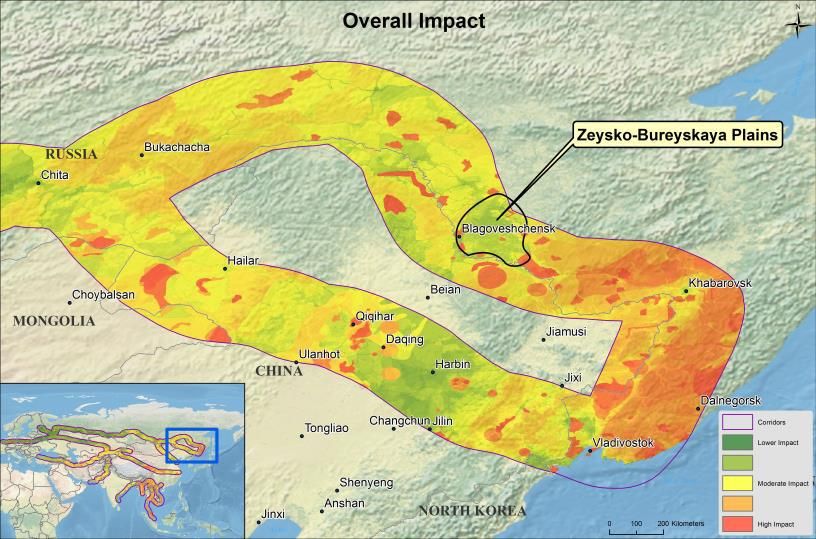
Key Biodiversity Areas and Impact Assessment in BRI-covered Areas

human being’s production activities. Along the BRI corridors, the large variety of landforms and
complex geological phenomena have generated abundant natural resources. However, there is
huge difference in natural resources among regions, which has directly or indirectly influenced the
pillar industries and productivity of different regions.

                   Figure1 Distribution of Petroleum and Natural Gas in the BRI Region

(1) Petroleum and Natural Gas

Covering countries with the world’s largest petroleum and natural gas reserves, the BRI region is
home to 60% of the global petroleum recoverable reserves and 63% of the global natural gas
recoverable reserves. Moreover, 58% of the world’s petroleum and 54% of the world’s natural gas
are produced in this region. Nevertheless, the distribution within the BRI region is extremely
uneven. Nearly 80% of conventional petroleum resources and natural gas resources are
concentrated in the Middle East, with the rest 20% distributed in West Asia, Central Asia, and Russia.
According to such a geographical distribution, four major producing regions of petroleum and
natural gas have been identified, namely the Middle East, Central Asia – Russia, Southeast Asia, and
Europe. The petroleum and natural gas reserves vary greatly from one region to another, with the
distribution in each region being extremely unbalanced (Figure1).

(2) Mineral Resources

The ferrous and non-ferrous metal reserves along the BRI corridors are ranked among the largest in
the world (Figure2). Take iron as an example. The proven iron ore reserves in the BRI region are 67.6
billion metric tons, accounting for approximately 40% of the global reserves. These iron ore
reserves are mainly located in Russia, China, India, Ukraine, Kazakhstan, and Iran. Among the six
countries, Russia has proven iron ore reserves of 25 billion metric tons, ranking third in the world;

                                                 3
BRI International Green Development Coalition
India has 8.1 billion metric tons, ranking fifth; and Ukraine has 6.5 billion metric tons, ranking
seventh.
Figure2 Mineral Resources in the BRI Region by Percentage of the Global Reserves
Considerable non-metallic minerals reserves have also been found in the BRI region. For example,
the proven reserves of bauxite account for around 17% of the global reserves, and the boron
reserves take up approximately 69.5% of the world’s proven boron reserves. There are a wide range
of non-metallic minerals in the world. Due to the strong applicability, these minerals can
significantly promote a country’s economic development, which deserve our attention.
(3) Water Resources
Water resource distribution is obviously different among countries and regions along the Belt and
Road. In general, the annual average precipitation and runoff depth in the BRI region are lower than
the world’s average. Due to the large variety of climate types and intraregional differences, the
precipitation and runoff distribution varies greatly from one region to another. The precipitation
and runoffs are relatively abundant in Southeast Asia, but not in West Asia and Central Asia. In
terms of the per capita statistics, the water resources per capita in countries along the BRI corridors
are less than two thirds of the world’s average. Like the regional distribution of precipitation and
runoffs, water resources per capita are relatively high in Southeast Asia and Northeast Asia, but
relatively low in the Middle East and Central Asia. As for the availability of water resources by
percentage, more water resources are available in West Asia, Central Asia, and South Asia than
those in Eastern Europe, Northeast Asia, and Southeast Asia.
(4) Land Resources
A. Arable Land and Its Distribution
Countries and regions along the Belt and Road are endowed with a vast arable land of 695 million
hectares, accounting for about 50% of the world’s total arable land area. The arable land area per
4Key Biodiversity Areas and Impact Assessment in BRI-covered Areas
capita is 0.15 hectare, which is three fourths of the world’s average. Arable land is mostly
concentrated in the middle- and low-latitude regions. Among these regions, the
China-Mongolia-Russia region has the largest arable land. India, Russia, and China are the top three
countries with the most arable land – the arable land area of each country has all surpassed 100
million hectares. However, in countries including Kuwait and Montenegro, the arable land area is
less than 10,000 hectares. During the past 15 years, Southeast Asia has witnessed the largest
increase in arable land area, which has decreased drastically in South Asia. Due to the influence of
climates and landforms, the land productivity is relatively high in Southeast Asia, but relatively low
in some regions in the southern part of Central Asia.
B. Woodland and Its Distribution
The woodland area in countries and regions along the Belt and Road is 15.79 million square
kilometers, accounting for 44% of the world’s total. A wide range of woodlands have been seen,
including various submerged aquatic vegetation in freshwater or saltwater, broadleaf woodlands,
and coniferous woodlands. Along the Belt and Road, about 74.62% of woodlands are distributed in
the China-Mongolia-Russia region, while Central Asia has the smallest woodland area, accounting
for only 0.43%. The most common woodland in Southeast Asia is evergreen broadleaf vegetation,
whose productivity is the highest. However, in Siberia and the Far East region of Russia, there are
mostly deciduous coniferous woodlands, whose productivity is the lowest. In the past 20 years,
there has been a trend of “decrease – substantial increase – decrease to a stable level” in terms of
woodland area. The China-Mongolia-Russia region has witnessed the largest increase in woodland
area, while Southeast Asia has seen the sharpest decrease.
C. Grassland and Its Distribution
The total grassland area in countries and regions along the Belt and Road is about 11.73 million
square kilometers (approximately 23.11% of the BRI region’s overall land area), 67.18% of which is
located in the China-Mongolia-Russia region. Meanwhile, the overall grassland productivity
decreases progressively from the low-latitude areas to high-latitude areas, and from coastal areas
to landlocked areas. Different from woodlands, due to the global warming and overgrazing, the
major grasslands have shrunk in size and most grasslands have degenerated. Global warming has
resulted in an expanded area of the temperate ecosystem. The growing season of vegetation has
been prolonged, and temperate forests have grown towards high-latitude and high-altitude areas,
leading to a remarkable decline in the mountain grassland area in Asia and Europe.
1.3 Geological Features of Cultures and Economics2
The BRI covers over 64% of the world’s population and 30% of the global GDP. The population
distribution along the Belt and Road is featured by “large in the southern and eastern part, and
small in the northern and western part”. In regions in the east to the Ural Mountains of Russia,
Kazakhstan, Mongolia, and Northeast China, the average population density is less than 1 person
per square kilometer. In some other countries and regions, such as China’s Yangtze River Delta,
2
Liu Weidong, et al. Joint Construction of Green Silk Roads: Social, Economic and Environmental Context, the
Commercial Press, 2019.
5BRI International Green Development Coalition
Pearl River Delta, and Beijing-Tianjin-Hebei region, India’s Uttar Pradesh, Bihar, and West Bengal,
Bangladesh, the northeastern part of Pakistan and the middle and upper courses of Indus River, the
Hong River Delta in Vietnam, and Java of Indonesia, the average population density exceeds 1,000
people per square kilometer. As for the remaining part of the BRI region, the average population
density ranges from 100 to 1,000 people per square kilometer. Among the BRI participating
countries, big and medium-sized cities are mainly located in the middle and eastern parts of China,
the Indochinese Peninsula, the Indian Subcontinent, and Central and Eastern Europe. Globally,
there are 31 mega cities whose population has exceeded 10 million, and 17 of them are situated
along the Belt and Road, in particular the two most populous countries in the world – China and
India.
Among the BRI participating countries, most of them are developing countries and only a few are
developed economies with a relatively small population, such as Singapore, Israel, and Qatar. In
2017, the GDP of BRI participating counties totaled USD 2.2 trillion (calculated according to the
official exchange rates), and the GDP per capita reached USD 5,200, accounting for about 50% of
the world’s average. According to the World Bank’s data, five countries are classified as low-income
countries, namely Afghanistan, Syria, Tajikistan, Yemen, and Nepal; and 19 countries are
lower-middle income countries. Besides, although the average incidence of poverty in the BRI
participating countries is only 4% (as of 2015), which is far below the world’s average, the incidence
of poverty in some countries is very high, including India, the Laos, Yemen, and Uzbekistan. If
measured by the Human Development Index, the BRI participating countries are faced with an
unbalanced eco-social development, which is severer than the world’s average, together with a
huge gap between the rich and the poor.
Despite the relatively low income, many countries boast strong economic vitality and have
maintained a rapid economic growth in the past years, in particular China and countries of
Southeast Asia and South Asia. The BRI participating countries’ contribution to the global GDP has
increased from 17% to 30% since 2000. Emerging economies such as China, India, Indonesia, Russia,
Saudi Arabia, and Turkey have become important drivers of the global economy. Owing to the
relocation of global manufacturing, East Asia and Southeast Asia have taken steady steps to become
“the world’s factory” in the past five decades, and created a huge supply chain and a close-knit
trade network. In addition, the Middle East has always been the world’s energy base, and Russia
and Central Asia are blessed with abundant petroleum and natural gas reserves. Hence, although
some countries have been confronted with stagnant economic growth due to civil wars or domestic
affairs, the BRI participating countries are places full of vigor and hope with huge potential for
economic cooperation.
6Key Biodiversity Areas and Impact Assessment in BRI-covered Areas
2. Key Biodiversity Areas along the Belt and Road
The concept of Key Biodiversity Areas (KBAs) derives from the Biodiversity Hotspots promoted by
the Conservation International (CI). The identification method of KBAs originated from that of
Important Bird Areas (IBAs), which was proposed in 1980. In the following 30 years, BirdLife
International has been committed to applying this method to identify IBAs worldwide. To ensure
the commensurability of data, different conservation organizations around the globe have
universally adopted this identification method of IBAs3. Later on, this method has been gradually
applied in the conservation of other species, not only birds, as in Important Plant Areas (IPAs),
Important Freshwater Biodiversity Areas (IFAs), Prime Butterfly Areas (PBAs), and so on. In 2004, an
expert workshop was held in Washington, D.C., the United States, to develop draft cross-taxon
criteria for identifying KBAs, thus to integrate all these processes and knowledge into a single
system. At the World Conservation Congress held in Bangkok, Thailand, in 2004, members of the
International Union for Conservation of Nature (IUCN) proposed that “A global consultative network
should be established to ensure an agreed methodology which enables countries to identify KBAs.”
In response to this initiative, IUCN Species Survival Commission (SSC) and World Commission on
Protected Areas (WCPA) jointly established the IUCN WCPA/SSC Joint Task Force on biodiversity and
protected areas, mobilizing IUCN experts and staff members, other conservation organizations,
academia, governments, donators, and representatives from private enterprises to participate in
the development of standard for identifying KBAs.
Following the IUCN Red List of Threatened Species and the Red List of Ecosystems, the Global
Standard for the Identification of KBAs (2016) is another global standard prepared by IUCN, which
has provided governments and the civil society with strong strategic support in developing a
network of conservation areas. This global standard was established to: a) coordinate the existing
methods and the identification method of KBAs; b) supplement and improve the scientific standard
which has not taken biodiversity factors into consideration; c) help different users and organizations
identify the sites contributing significantly to the global persistence of biodiversity from the
temporal and spatial dimensions; d) ensure the objectivity, transparency, and rigidness of the
identification results of KBAs through a scientific standard featuring quantified threshold; and e)
propel policy makers to get a better understanding of the significance of KBAs, thus to contribute to
the identification of KBAs around the globe.
2.1 Existing Biodiversity Databases
Subject to different identification standards of KBAs, several databases and categories on
biodiversity have been established now.
2.1.1 The World Database on Protected Areas
The World Database on Protected Areas (WDPA) is a joint project between the United Nations
Environment Programme (UNEP) and IUCN, which is prepared and managed by the UNEP World
3
FOSTER M N, BROOKS T M, CUTTELOD A, et al. The Identification of Sites of Biodiversity Conservation Significance:
Progress with the Application of a Global Standard[J]. Journal of Threatened Taxa, 2012, 4(8):2733-2744.
7BRI International Green Development Coalition
Conservation Monitoring Centre (UNEP-WCMC), together with governments, non-government
organizations, academia, and industrial community. Taking economic and environmental factors
into consideration, WDPA identifies protected areas via living and non-living things, including
animals, plants, and geological structures. WDPA is the most comprehensive global database on
terrestrial and marine protected areas, comprising spatial data (i.e. polygons and points) and
associated attribute data (i.e. information appended in tabular form).
2.1.2 The World Database of Key Biodiversity Areas
The World Database of Key Biodiversity Areas evolves from the World Bird and Biodiversity
Database managed by BirdLife International. Now, the database is managed by the KBA Partnership,
which comprises 13 international organizations4, and is served by the KBA secretariat hosted jointly
by BirdLife International and IUCN. The selection criterion is “sites contributing significantly to the
global persistence of biodiversity in the terrestrial, freshwater, and marine ecosystems.” To be more
specific, the standards include the following aspects: threatened biodiversity, geologically-confined
biodiversity, ecological integrity, biological process, and irreplaceability. The KBAs identification
standards are not necessarily related to all factors of biodiversity, although the threshold of each
standard can be applied in all taxonomic groups (except for microorganism) and ecosystems.
2.1.3 The WWF Priority Ecoregions
The WWF Priority Ecoregions uses irreplaceability and distinctiveness to analyze the biodiversity
features of different regions, thus, to identify more than 200 terrestrial, freshwater, and marine
ecoregions that are most distinctive and representative. Hence, this database is also called the
Global 200 Ecoregions, or G200 Ecoregions. The WWF Priority Ecoregions analyzed global patterns
of biodiversity y to identify a set of the Earth’s terrestrial, freshwater, and marine ecoregions that
harbor exceptional biodiversity and are representative of its ecosystems. They placed each of the
Earth’s ecoregions within a system of 30 biomes and biogeographic realms to facilitate a
representation analysis. Biodiversity features were compared among ecoregions to assess their
irreplaceability or distinctiveness. These features included species richness, endemic species,
unusual higher taxa, unusual ecological or evolutionary phenomena, and the global
rarity of habitats. Up to date, this database possesses 238 ecoregions, comprising 142 terrestrial, 53
freshwater, and 43 marine priority ecoregions. Effective conservation in this set of ecoregions would
help conserve the most outstanding and representative habitats for biodiversity on this planet.
2.1.4 The IUCN Red List of Threatened Species
The IUCN Red List of Threatened Species (or IUCN Red List) was founded in 1963, and is now the
most comprehensive inventory of the global conservation status of biological species in the world.
It has been also recognized as the most authoritative guide to evaluate biodiversity status. It uses a
set of strict criteria to evaluate the extinction risk of thousands of species and subspecies. Through
4
The 13 international organizations include: BirdLife International, IUCN, American Bird Conservancy, Amphibian
Survival Alliance, CI, Critical Ecosystem Partnership Fund, Global Environment Facility, Global Wildlife Conservation,
NatureServe, Rainforest Trust, Royal Society for the Protection of Birds, WWF, and Wildlife Conservation Society.
8Key Biodiversity Areas and Impact Assessment in BRI-covered Areas
criteria such as the decline rate, population size, geographical distribution, and distribution
fragmentation, species to be protected are classified into nine groups, namely Extinct (EX), Extinct
in the Wild (EW), Critically Endangered (CR), Endangered (EN), Vulnerable (VU), Near Threatened
(NT), Least Concern (LC), Data Deficient (DD), and Not Evaluated (NE). The highest-ranking group is
EX, followed by EW, and species included in the three categories of CR, EN, and VU are recognized
as “threatened”. Among all species that have been evaluated, there are 16,118 threatened species,
including 7,725 species of animals, 8,390 species of plants, and three species of fungi. Major
species assessors include BirdLife International, the Institute of Zoology (the research division of the
Zoological Society of London), WCMC, and IUCN SSC. Collectively, assessments by these
organizations account for nearly half the species on the Red List.
2.1.5 Biodiversity Hotspots
The database of Biodiversity Hotspots is produced by CI to select the most representative regions
that are both biologically rich and deeply threatened. There are two criteria involved: a) the region
must have at least 1500 or 0.5% of the world’s vascular plants as endemics; and b) the region must
have lost over 70% of its original vegetation. CI has identified 34 biodiversity hotspots around the
globe, which are the biologically richest and most endangered regions in the world. Although they
represent only2.4% of the Earth’s land surface, they support more than 60% of the world’s
terrestrial species. Currently, these hotspots are deeply endangered and many of them have lost
over 90% of their original vegetation.
2.2 Identification of KBAs along the BRI Corridors
Our identification of KBAs is based on the aforementioned databases and lists, taking into account
economic and technological factors, Sustainable Development Goals, uniqueness of biodiversity
and categories of threatened species.
2.2.1 Visualization Tools
The visualization tools for identifying key biodiversity areas that are available to the project team
include WWF-SIGHT, Trends.Earth of CI, and IBAT of IUCN, each of which has its own strengths and
weaknesses. SIGHT has a relatively comprehensive database, with databases of key biodiversity
areas and key infrastructure development data, which can fulfill identification and sensitivity
analysis tasks, but it cannot select a certain country or region for presentation and targeted analysis.
Trends.Earth can do qualitative time series analysis of the situations of protected areas, but it lacks
relevant data of infrastructure, so it cannot effectively carry out sensitivity analysis of infrastructure
for the time being. IBAT can customize areas for analysis, and has comprehensive data on key
biodiversity areas, but also lacks relevant data on infrastructure. Considering the strengths and
weaknesses of the three tools, we have used WWF-SIGHT as the main visualization and analysis tool
for this report, as shown in Figure 3.
9BRI International Green Development Coalition
Figure 3 Visual Operational Layers Interface
WWF-SIGHT is jointly developed by WWF, Simon Fraser University, the Luc Hoffmann Institute and
Oxford University. WWF-SIGHT is a global smart platform based on Google Maps. This technology
enables users to collect various spatial data sets and combine them with satellite images, thus
visually demonstrating the real-time situation of the global natural resources that need protection.
At present, there are two versions of WWF-SIGHT. WWF-SIGHT1.0 is open to the public, which only
shows the global distribution of some natural resources and infrastructure, without details such as
names, types, sizes, investors, countries or regions. WWF-SIGHT2.0 is an internal version, which
includes not only the natural resource information possessed by WWF, but also some business data
and detailed information of some projects, such as railways, highways, factories, etc.
With WWF-SIGHT2.0, we can overlay the layers of key protected areas and infrastructure (railways,
highways, etc.). According to the degree of overlapping, we can judge and analyze the impact of
infrastructure on biodiversity. Furthermore, WWF-SIGHT2.0 has a screening function, which can
screen countries and coverage areas, so as to enable more targeted analysis.
2.2.2 Visualization Results of Key Biodiversity Protected Areas
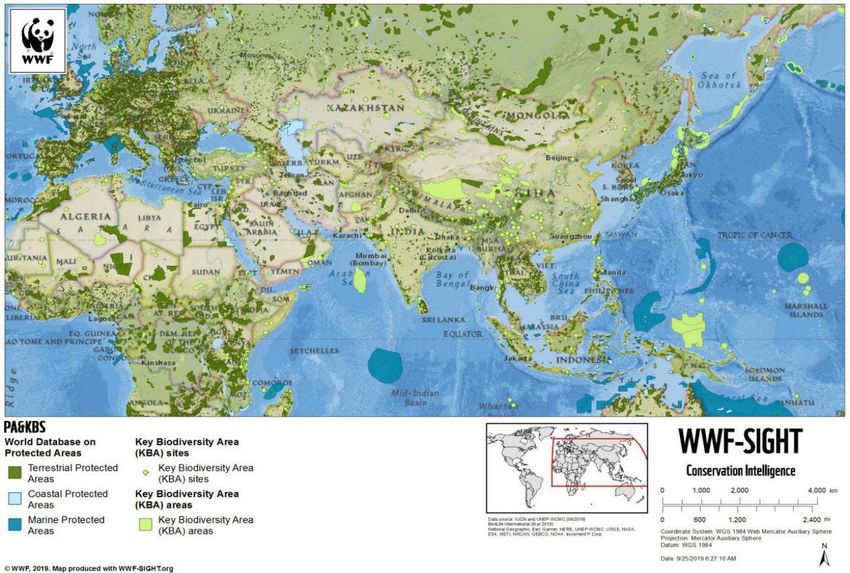
The distribution of key biodiversity protected areas in the study region is displayed in Figures 4, 5,
and 6. Based on WDPA, KBAs and WWF Priority Ecoregions, we have analyzed that the key
biodiversity protected areas are mainly concentrated in Southeast Asia, the border area between
China, India and Myanmar, Europe and South Africa. These areas are either plains or hills and
mountains with a warm and humid climate, forming good living conditions for organisms. Figure 7
shows that the vast majority of the threatened species on the Red List are also distributed in these
areas, especially in Southeast Asia and the border areas between China, India, and Myanmar.
10Key Biodiversity Areas and Impact Assessment in BRI-covered Areas
Scattered but numerous key biodiversity protected areas can be found in Siberia. The climate in
Siberia is cold with little precipitation, and the living environment is harsh. Although there are few
human footprints, the harsh environment also makes these areas more vulnerable, and a
considerable number of threatened species on the Red List are distributed in these areas. As human
development gradually expands into Siberia, these areas need more attention and protection.
Figure 4 Distribution Map of WDPA
11BRI International Green Development Coalition
Figure 5 Map Overlay of WDPA and KBAs
Figure 6 Map Overlay of WDPA, KBAs and WWF Priority Ecoregions
12Key Biodiversity Areas and Impact Assessment in BRI-covered Areas
Figure 7 Map Overlay of WDPA and IUCN Red List
Figure 8 shows the distribution of key biodiversity protected areas in the six economic corridors of
the BRI. As shown in the figure, Northwest China is one of the main distribution areas of key
biodiversity protected areas. This area is located in arid and semi-arid areas of China, in the dry
climate zone with a serious trend of aridification; it is mostly comprised of plateaus and mountains,
with mainly red sandy soil and Gypsisols. It is characterized by poor water and soil conservation
function; scarce precipitation , which is not enough to turn into runoff; and inadequate vegetation,
with the main vegetation types of grassland and bare land. Many factors lead to great ecological
fragility in this area. Once destroyed, the area would be difficult to be restored, which would
seriously affect the local biodiversity.
13BRI International Green Development Coalition
Figure 8 Distribution of Protected Areas in Six Major Economic Corridors5
Southeast Asia and the Bangladesh-India-Myanmar region are also the main region of key
biodiversity protected areas. They are scattered, but the population is very considerable. Southeast
Asia belongs to the equatorial climate zone, with some areas turning arid; the area is mostly made
up of hills and mountains, and the soil is mainly acrisols and inceptisols; there is abundant
precipitation, which easily turns into runoff; and plentiful vegetation, including woodland and
cultivated land. The Bangladesh-India-Myanmar region belongs to the equatorial climate zone, and
the eastern part of the region has a trend of aridification; the terrain is flat, and the soil is mainly
Alfisols and Vertisols; it is rich in precipitation and vegetation including woodland and cultivated
land. The climate in these two areas is warm and humid, and the soil mainly comprised of Alfisols
has strong fertility, which is the ideal habitat for many organisms.
There are also a large number of key biodiversity protected areas in Central and Eastern Europe.
This area belongs to the cool temperate climate zone, and the western part shows a trend of
aridification; the terrain is low and flat with a gentle slope, and the soil mainly consists of podzols
and chernozems; there is plentiful precipitation, which easily turns into runoff; the vegetation is
mainly composed of woodland and cultivated land, which is also an area rich in biodiversity.
5
WWF. The Belt and Road Initiative: WWF Recommendations and Spatial Analysis. 2017
14Key Biodiversity Areas and Impact Assessment in BRI-covered Areas
2.3 Sensitivity Analysis of Biodiversity in the Six Economic Corridors of the BRI6
In the previous chapter, the key biodiversity areas of the BRI have been identified and visualized.
This chapter mainly makes a preliminary spatial analysis of the potential areas where the
biodiversity and natural resources may be affected by the development of the BRI. The report
selects typical biodiversity protected ecological environments, and determines the sensitivity
factors suitable for assessing areas according to the natural, social and economic conditions of
different ecological environments. Through the comprehensive ecological sensitivity assessment
method, the ecological environment sensitivity is evaluated both qualitatively and quantitatively by
taking into account various factors such as ecosystem changes, animal and plant species and habitat
changes, and migration routes.
The BRI involves many areas that are important to the environment, such as protected areas, key
landscapes, WWF Priority Ecoregions, biodiversity hotspots that major species inhabit, and
important areas that produce social and economic benefits and provide ecosystem services.
Combined with the map data set of the BRI overland economic corridors, the ecological
environment sensitivity analysis is carried out, including the following aspects:
a) Threatened species. The analysis of the IUCN Red List data shows that the six economic
corridors in the BRI overlap with the habitats of 265 threatened species, including 39 critically
endangered species and 81 endangered species, such as the saiga antelope, tiger and giant
panda.
b) Areas of great significance to the environment. We believe that the overlapping parts of the six
major economic corridors of the BRI and the identified key biodiversity areas will be the areas
of great significance to environmental protection in the corridors.
c) Biodiversity protected areas. All protected areas that the six major economic corridors of the
BRI pass through may be affected. Specifically, 32% of the total protected area of the BRI
participating countries may be affected.
d) Ecological environment characteristics. In the regions with the greatest ecological environment
characteristics, the newly built roads connecting remote areas will have a more serious
long-term impact than the expansion or reconstruction of existing roads.
e) Overall impact. The overall impact of the six major economic corridors of the BRI on the key
biodiversity protected areas is presented through the equal-weighted average of the above
factors (Figure 9).
We have divided the degree of impact into five levels, and expressed them by color. The greener the
color, the lower the impact; the redder the color, the higher the impact. At the same time, we have
marked the six major economic corridors of the BRI on the map, so as to more clearly reflect the
potential impact of infrastructure development in countries and regions along the BRI.
6
WWF. The Belt and Road Initiative: WWF Recommendations and Spatial Analysis. 2017
15BRI International Green Development Coalition
Figure 9. Potential Impacts of the Six Economic Corridors of the BRI on KBAs
According to the results of this analysis, the potential overall impact of economic corridors on KBAs
presents a trend of decreasing spatial distribution progressing from the east to the west and from
the south to the north. Southeast Asia and the border area between China and Russia at the east
end of the Eurasian continent show the highest potential impact and are the most ecologically
sensitive areas, while central and east European regions show exactly the opposite.
In the context of differing levels of economic development, the potential impact of this construction
on biodiversity is lower in Europe than in less developed regions including Southeast Asia, Central
China and the China-Russia border area. Part of the difference may be explained by the fact that the
environmental vulnerabilities of these regions differ:
1) The ecological environment of Central Asia is of moderately high sensitivity. As the world’s
largest non-zonal arid area, water resources are extremely scarce. In recent years, ecological
and environmental issues have become ever more prominent, marked by water shortages and
the Aral Sea ecological crisis. For example, the water shortage crisis is worsening as melt-water
from mountain ranges is reducing due to global warming, and more water is being used for
large-scale agricultural irrigation as a result of rapid population growth.
2) West Asia features a moderately-sensitive ecological environment. Given its shortage of rivers
and underground water, it is one of the driest places on Earth. Today, water shortages have
been one of the most significant impacts of climate change on countries in this region. As wet
seasons shorten, the frequency of droughts increase and the ecosystem deteriorates, making
the region more ecologically sensitive. Meanwhile, as a result of water shortage, Central and
16Key Biodiversity Areas and Impact Assessment in BRI-covered Areas
West Asia are in desperate need of water infrastructure to extract water resources, the
construction of which may increase the sensitivity of the local ecological environment.
3) In Southeast Asia, the overall ecological sensitivity is high. The main reason for this lies in
marine disasters caused by extreme weather, which is fueled by climate change.
4) The China-Russia border area at the east end of Asia and the Tibetan plateau in Central China
are characterized by low temperatures, poor rainfall, simple ecosystem structures, low
resistance to disturbance, high frequencies of natural disasters, and high vulnerability to
changes in the global environment. The Tibetan plateau is witnessing intensified localized and
short-term changes as its ecosystem stability is weakened by human activities. In addition,
economic activities such as mining, biological and tourism development are severely damaging
local grassland ecosystems, and have caused localized grassland degradation, loss of wetland
and desertification, generating a far-reaching impact on the overall vulnerable alpine
ecosystems.
The analysis also examined the sensitivity of threatened species within the six economic corridors
to find out how severely they may be affected by the proposed infrastructure (see Figure 10). They
are divided into three groups: critically endangered, endangered and vulnerable, on the basis of the
degree of the threat of extinction. Each group is categorized in a five-level range from lower
potential impact (indicated in green on the maps) through to higher potential impact (indicated in
red), with each level increasing by 20 percentage points.
Figure 10. Potential Impacts of the Six Economic Corridors of the BRI on Threatened
Species
17BRI International Green Development Coalition
As shown in Figure 10, in terms of absolute numbers, fewer critically endangered species are likely
to be affected, followed by endangered species, then vulnerable species in ascending order. With
regard to species, terrestrial mammals will be the most widely affected, with about 56.8%, 71.6%
and 58.6% of critically endangered, endangered and vulnerable terrestrial mammals subject to
potential impact respectively. The next are reptiles, of which about 29.7%, 12.3% and 15.2% of
critically endangered, endangered and vulnerable reptiles are expected to be affected respectively.
Birds and aquatic mammals come third and fourth in terms of potential impact.
The results are in line with the construction environments of the planned infrastructure. Mostly
located on land, these projects will take up or even destroy the habitats of species living
predominantly or entirely on land, leading to a high potential impact on terrestrial mammals and
reptiles. Geographically, Southeast Asia shows the highest potential impact, because the mild and
humid region covered by rich vegetation is home to a large number of species, especially those
under threat.
Figure 11 shows the ecological sensitivity of major biodiversity areas. Identified in accordance with
the databases mentioned above, KBAs, biodiversity hotspots and WWF priority ecoregions within
the proposed economic corridors are categorized in a five-level range from lower potential impact
(indicated in green) through to higher potential impact (indicated in red), with each level increasing
by 20 percentage points.
Figure 11. Potential Impacts of the Six Economic Corridors of the BRI on WWF Priority
Ecoregions
18Key Biodiversity Areas and Impact Assessment in BRI-covered Areas
According to the results of the analysis, 1,739 major biodiversity areas in the six economic corridors
are likely to be affected. Among the KBAs whose potential impacts can be identified, 56.5% show a
potential impact less than 40%, and 57% are terrestrial priority ecoregions. Among the WWF
priority ecoregions, 13% of those on land and 6% of those at sea may be affected.
These findings are consistent with those of the analysis looking at the ecological sensitivity of
threatened species. Terrestrial KBAs can be more easily affected or even destroyed by the
construction of infrastructure projects, while only a limited number of marine ones show a
potential impact and most of these are located in Southeast Asia. Europe sees a relatively sparse
scattering of KBAs expecting to be affected, but their potential impacts are generally
upper-moderate or high. European KBAs indicating high risks are mostly found in developed
countries at the western end of the continent, where dense populations are taking up more natural
space, despite their remarkable records with regard to potential overall impact and the impact on
threatened species.
The results of this sensitivity analysis reveal two important points: (1) there is significant potential
overlap between the terrestrial BRI corridors and areas that are important for biodiversity
conservation and for the provision of social and economic benefits to people; (2) these overlaps
indicate risk areas for potentially negative impacts of infrastructure development. Follow up
analysis is required to fully document the potential overlap, to identify potential solutions, and to
develop opportunities for investment in ecological infrastructure.
Figure 12. Potential Impacts of the BRI on Zeysko-Bureyskaya Plains
19You can also read