KNOWLEDGE, VOICE, PARTICIPATION - PARTICIPATORY SETTLEMENT ENUMERATION FOR SANITATION SERVICES IN JHANSI
←
→
Page content transcription
If your browser does not render page correctly, please read the page content below
Knowledge, Voice,
Participation
Participatory Settlement
Enumeration for
Sanitation Services
in Jhansi
Knowledge, Voice, Participation: Participatory Settlement Enumeration for Sanitation Services in Jhansi
Knowledge, Voice,
  Participation
Participatory Settlement Enumeration for
 Sanitation Services in Jhansi
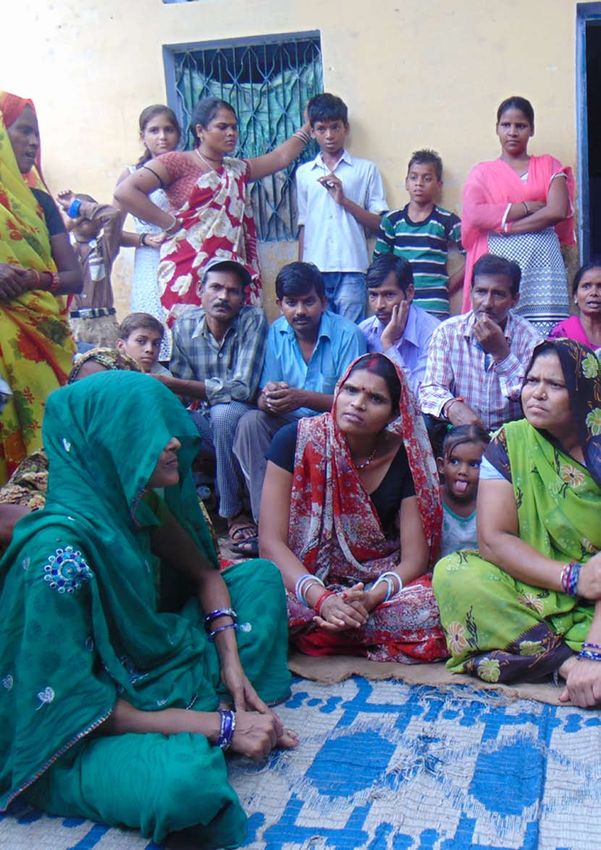
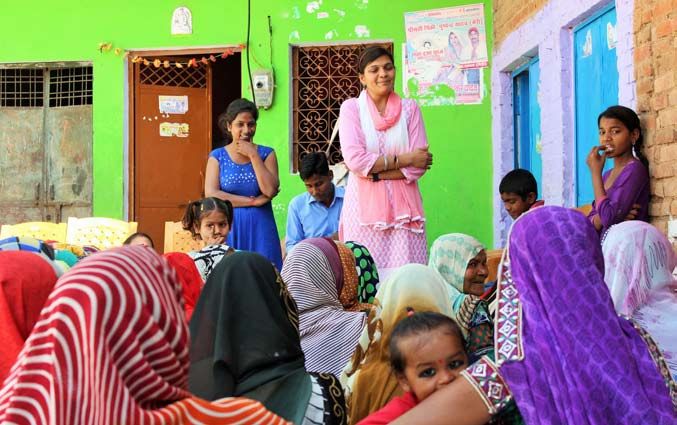
© 2018 PRIA

We gratefully acknowledge Saroj Sahu for the photographs used in this report.

This report is published under a Creative Commons License, Attribution – Non-commercial – Share Alike.
See www.creativecommons.org/licenses.

The text may be reproduced for non-commercial purposes, provided credit is given to PRIA.

To obtain permission for uses beyond those outlined in the Creative Commons license, please contact PRIA Library at
library@pria.org

Design by Macro Graphics Pvt. Ltd. | www.macrographics.com
Preface

The Sustainable Development Goals (SDGs) and New Urban Agenda envisage an inclusive, resilient,
and sustainable city. This inclusivity cannot be achieved automatically, especially given the extent
of entrenched inequalities that exist in Indian cities. A vast number of urban poor in India's cities are
deprived of basic services such as, water, sanitation, health, education, and so on. A major reason
for such continued and perpetuated deprivation is their invisibility or under visibility in the eyes of
city authorities which are responsible for providing these services to the urban poor. At times, this
oversight by city authorities is due to sheer ignorance, sometimes methodically deliberate, and still
other times due to their lack of capacities. The urban poor bear the burden of this invisibility. It means
not getting enough income to support family members; lack of access to public health services when
sick; limited opportunities for children and young people in the absence of education and skills;
insufficient access to safe drinking water and sanitation services – all of which traps them in the
vicious cycle of poverty.

How do the urban poor then find a way to make themselves visible to other citizens including the city
authorities? Many urban poor communities across the regions have found answer to this question
in self-enumeration. A number of surveys and enumerations by various state authorities, including
National Census Survey, often undercount informal settlements in a city and their residents who mostly
belong to low-income families. In Participatory Settlement Enumeration (PSE), on the other hand, the
residents of informal settlements design and conduct the enumeration, analyse the data generated
through the enumeration, and communicate this data to the concerned authorities for participatory
planning. Participation and inclusion in PSE thus becomes an empowering experience for the hitherto
unaccounted and voiceless urban poor.

PRIA through its “Engaged Citizens, Responsive City (ECRC)” initiative implemented PSE in
collaboration with the Settlement Improvement Committees (SICs) formed under the program in
three Indian cities – Ajmer, Jhansi, and Muzaffarpur. SICs are organisations of the urban poor. PRIA
adopted a number of innovations in PSE, choosing to use mobile smart phone based technology for
enumeration. Young girls and boys from the community who were SIC members were trained on mobile-
based participatory enumeration. This gave them enormous confidence – they now had a new skill,
their settlement was visible, and their community had a voice. These youth are now on their way to
becoming champion citizen leaders, active in their communities.

                                                                                              Preface   iii
The report Knowledge, Voice, Participation: Participatory Settlement Enumeration for Sanitation Services
in Jhansi”. presents the consolidated findings of PSEs from 43 informal settlement in Jhansi. The
analysis includes demographics of the households including sex, age, education, and occupation of
household members. It also presents data on various legal documents such as, Bank Accounts, Aadhaar
card, Ration cards and Birth Certificates possessed by each household member. Finally, it presents an
analysis on the state of access to water and sanitation facilities in these settlements.

The findings of PSE can help the community and municipality to plan for improved sanitation services
and increased access to various legal documents. We sincerely hope that the development actors,
concerned with improvements of informal settlements and the urban poor residing in these locations will
benefit from this report.

                                                                                       Dr. Kaustuv Kanti Bandyopadhyay
                                                                                                                   Director
                                                                                             Participatory Research in Asia

 iv   Knowledge, Voice, Participation: Participatory Settlement Enumeration for Sanitation Services in Jhansi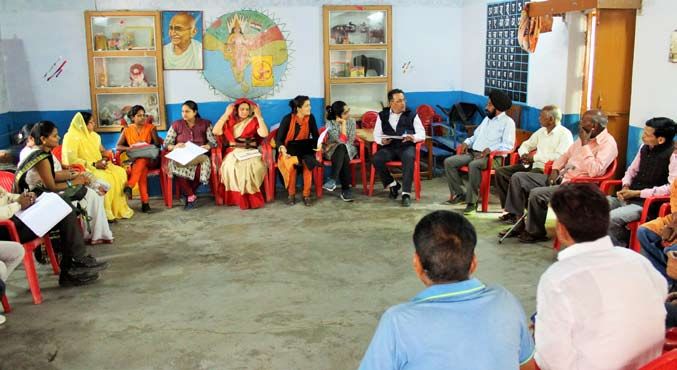
Acknowledgements

Society for Participatory Research in Asia (PRIA) is implementing the “Engaged Citizens, Responsive
City” project in three Indian cities – Ajmer in Rajasthan, Jhansi in Uttar Pradesh, and Muzaffapur in
Bihar. The project is supported by the European Union. The purpose of this initiative is to strengthen the
capacities of urban poor for participating in planning, monitoring and evaluation of sanitation services.
This initiative contributes to making Swachh Bharat Mission more inclusive and effective from the
vantage point of urban poor. It organises the urban poor in Settlement Improvement Committees which
then undertakes community mobilisation as well as interfaces with Urban Local Bodies and other city
authorities.

Data is a critical requirement to effectively seek interventions from Urban Local Bodies, but is usually
scantily available at the granular level. Data sources like the Census of India are difficult to utilise for
planning because collection is decennial, and information at the level of informal settlement/slum is not
always provided. Such limitations deter citizen participation, specifically the urban poor, as lack of access
to data prevents understanding or monitoring real situations at local level. For cities to develop, and for
informal settlements to have better access to basic services, a close coordination between the urban
poor, municipality and other stakeholders is critical. PRIA believes that one of the first steps towards
participatory planning and decision-making is to empower communities with critical data.

To meet this goal, PRIA designed a mobile-based PSE method and systematically enumerated
households from informal settlements across the city of Jhansi. A mix of mobile based as well as paper-
based enumeration was used to ensure representation from all informal settlements.

The current study was undertaken by PRIA in Jhansi. We are grateful to the community enumeration
team which includes Gaurav, Shubham (Kanchan), Satyam, Deepak, Kaushar, Neha, Savita, Juli,
Mahendra, Sahil, Rupam, Rajeev, Pavan, Pratibha, Irfan, Nagma, Rajesh and Amit. This process was
supervised by Omkar, Satish, Pooja, Satyam, Sanjay, Birjesh, Rajni, Seema, Shubham (Sharma), Saroj
and Ragini. Nikhil Desai, as the technical consultant, has provided valuable technical support to mobile
based survey and handling of data. We sincerely acknowledge his contribution. The team at Dimagi
enabled us to effectively manage our data with useful support.

                                                                                        Acknowledgements   vii
We acknowledge the support of PRIA Jhansi team consisting of Sudhir Singh, Suruchi Sharma and
Pooja Singh. Sumitra Srinivasan and Saon Bhattacharya helped edit this report and made sure that it is
free of errors. Shri Pratap Singh Bhadauria (PCS), Commissioner, Jhansi Municipal Corporation (JMC)
has kindly granted us his time and support. We acknowledge the support of Shri Rohan Singh – Prabhari
A.M.C., Shri Ravi Niranjan, Chief Sanitation Inspector, Dr. Rakesh Babu Gautam – NSA, Shri Mahesh
Verma, Zonal Sanitary Officer, Shri Rakesh Sahu, IT and M&E Specialist and Shri Manoj Srivastava,
Sanitation Inspector.
Dr. Kaustuv Kanti Bandyopadhyay, Director, PRIA provided the overall direction, guidance and
leadership for which we are sincerely grateful. Lastly, this report would not have been possible
without the direction provided by Dr. Rajesh Tandon, President, PRIA. We sincerely acknowledge his
contribution.
Nilanjana Bhattacharjee,
Programme Officer, PRIA
Sukrit Nagpal,
Senior Programme Officer, PRIA
Sudhir Singh,
Senior Programme Officer, PRIA
Suruchi Sharma,
Senior Programme Officer, PRIA
Dr. Anshuman Karol,
Senior Programme Manager, PRIA
viii Knowledge, Voice, Participation: Participatory Settlement Enumeration for Sanitation Services in JhansiContents
Preface iii
Message from Municipal Commissioner, Jhansi v
Acknowledgements vii
List of Acronyms xii
Section 1: Introduction 1
About Participatory Settlement Enumeration 1
City profile 3
General poverty profile of the city 4
Section 2: Methodology 5
City-wide identification and mapping of informal settlements 6
Organising SICs 6
Facilitating Participatory Urban Appraisal (PUA) 7
Orientation of SICs 8
House listing 8
Designing and administering the questionnaire 9
Selecting and training the enumeration team 10
Monitoring the enumeration process 10
Analysis, validation and sharing 12
Section 3: Findings from the Participatory Settlement Enumeration 13
Demographic and Socio Economic Profiles 13
Respondents 13
Religion and caste 13
Distribution of sex 14
Sex and age-wise distribution of educational status 14
Sex-wise distribution of occupation 16
Type of ration card 17
Access to legal documents 17
Birth registration 18
Aadhaar card 18
Contents ixBank account 18
Voter card 19
Household profile 19
Type of housing 19
Years of stay 20
Land ownership 20
Toilet Facilities 21
Availability of toilets 21
Reasons for not having toilets 23
Use of individual / shared toilets by household members 23
Type of toilets 24
Desire to have individual toilet at home and availability of space to construct toilets 24
Application for toilets 25
Acceptance of toilet application 25
Water outlet for kitchens/bathing water 22
Solid waste management (swm) 26
Collection of waste 26
Water 27
Section 4: Conclusion Recommendations and Way Forward 29
Conclusion 29
Recommendations and Way Forward 30
Toilets 30
Sewerage 32
Solid waste management (SWM) 33
Access to legal documents (ration and Aadhaar cards) 33
Accountability, communication and complaints 34
References 35
Annex 1: House Listing 37
Annex 2: List of Informal Settlements/Slums 39
List of Tables
Table 1: Roles and responsibilities of different team members 10
Table 2: Checklist used in monitoring of data 11
Table 3: Sex disaggregated access to Aadhaar card 18
Table 4: Sex disaggregated access to bank account 19
Table 5: Sex desegregated access to voter card 19
List of Figures
Figure 1: Process of PSE 6
Figure 2: Various aspects of questionnaire 9
x Knowledge, Voice, Participation: Participatory Settlement Enumeration for Sanitation Services in JhansiList of Charts
Chart 1: Religion of the household 13
Chart 2: Distribution of male-female to total population 14
Chart 3: Age distribution of household members 14
Chart 4: Sex wise education status of household members 15
Chart 5: Age wise education status of household members 16
Chart 6: Sex wise occupation status of household members 16
Chart 7: Type of ration card 17
Chart 8: Access to legal documents 17
Chart 9: Ownership of house 19
Chart 10: Type of house 20
Chart 11: Years of stay 20
Chart 12: Availability of land patta 20
Chart 13: Source of land patta/agreement letter/authority letter 21
Chart 14 Availability of toilets 21
Chart 15: Availability of toilets and type of ration card 22
Chart 16: Availability of toilets and ownership of house 22
Chart 17: Reasons for lack of toilet facility at home 23
Chart 18: Type of toilet 24
Chart 19: Availability of space for toilet construction 25
Chart 20: Application for toilet 25
Chart 21: Acceptance of toilet application 25
Chart 22: Water outlet connections for kitchen and bathroom 26
Chart 23: Type of household waste collection facility 23
Chart 24: Waste disposal, if household collection unavailable 23
Chart 25: Primary source for drinking water and other purposes 38
Contents xiList of acronyms AMRUT Atal Mission for Rejuvenation and Urban Transformation APL Above Poverty Line BPL Below Poverty Line CBO Community Based Organisation CPHEEO The Central Public Health and Environmental Engineering Organisation ECRC Engaged Citizens, Responsive City EU European Union HRIDAY Heritage City Development and Augmentation Yojana JMC Jhansi Municipal Corporation OBC Other Backward Classes PRIA Society for Participatory Research in Asia PSE Participatory Settlement Enumeration RAY Rajiv Awas Yojana SBM Swachh Bharat Mission SC Scheduled Caste SIC Settlement Improvement Committee SLB Service Level Benchmark ST Scheduled Tribe ULB Urban Local Body xii Knowledge, Voice, Participation: Participatory Settlement Enumeration for Sanitation Services in Jhansi
Section 1

Introduction

       About Participatory Settlement Enumeration
The fast pace of urbanisation across India has       Participatory Settlement Enumeration (PSE) is
provided many opportunities as well as challenges.   an alternative public policy tool, which ensures
It provides significant employment opportunities     nobody remains unaccounted and ‘nobody is left
and access to amenities, which rural areas           behind’. It is a process of gathering information
often lack. More than half of India’s population     about a community by its own community
is expected to live in cities by 2030. Alongside     members. Unlike traditional enumerations, in
these opportunities, the current form of unplanned   a PSE method the community is directly and
urbanisation has contributed to urban sprawl         significantly involved to enumerate itself. Right
by multiplying informal settlements, increasing      from the inception and design to data collection,
poverty, and rising inequalities between the rich    data analysis and data utilisation—the entire
and the poor. The consequence of such rapid          process is participatory. The origin of the PSE
urbanisation is visible in the large number of       method is rooted in the tradition of Participatory
urban citizens living in insecure conditions and     Research. PSE as a methodology is developed
suffering from the combined impact of social         on the belief that the experience and knowledge
exclusion, inadequate income, and limited access     of people are indispensable to inform and guide
to water, sanitation, liveable housing, and other    development policies.
civic services. With such challenges, many
organisations have been trying to develop new        There are multiple features that define the
approaches and innovative responses to bridge        PSE methodology. It creates, strengthens and
the gap between informal settlement dwellers and     deepens networks of slum dwellers in the city. It
their local governments.                             disaggregates data based on informal settlements
                                                     and their inhabitants and facilitates community
Invisibility is one of the greatest sources of       networks to establish their priorities. Through
powerlessness for a large urban population           this, it enables dialogue between communities
residing in numerous informal settlements across     and their local governments—re-establishing the
most Indian cities. Counting is often regarded       voice of the people and their active participation
and used as a tool for public policy making.         in the development of their city. PSE is, therefore,
Yet, more often than not, a large number of          different from traditional enumerations or surveys.
urban informal settlements and their inhabitants     Traditional enumerations or data gathered by
remain unaccounted for in urban planning and         professionals and external third parties make
governance.                                          communities passive “givers” of information.

                                                                                  Section 1: Introduction   1
In such cases, the data gathered remain in and its families. Young boys and girls utilise this
the possession of enumeration agencies and as an opportunity to engage with the process
is not accessible to the urban poor. Especially to learn about the outside world. Non-traditional
in the case of enumerating dynamic informal processes like visual mapping enable the inclusion
settlements, the collated data changes regularly of illiterates—valuing their voice as much as that
and becomes obsolete by the time planning of the educated. The process of exploring the data
policies are finalised. However, when members through a collective identity is in itself an important
of the community step in as active data collectors education and is not contested by the leading
and analysts through PSE, the community can men of the settlement, as it is non-threatening.
identify, address, and work towards solving The inclusion of women’s inherent knowledge on
relevant issues in a cohesive and sustainable some settlement issues ameliorates their status
manner. Standard traditional surveys lack granular as members of the community as well. The sheer
data regarding these settlements (concerning numerical strength involved in this process paves
boundaries, population, contextual needs, etc.), the way for negotiation with the local government
which result in their exclusion from government with equal weightage on both ends.
policies. However, through PSE, the poor and
marginalised communities themselves become the Like all processes of development, PSE comes
catalysts of change as professionals. They add to with a set of challenges. It is difficult to build trust
their existing local knowledge, which they then use since most informal settlements have experienced
to negotiate and achieve their objectives. A deep empty promises of change from external agencies
sense of ownership of the data emerges, which in the past. The lack of access to the data
makes all positive changes sustainable—unlike gathered through such past experiences make
traditional surveys that merely scratch the surface communities cynical and hinders participation.
of communities deeply embedded with multiple Local leaders and politicians could be hostile
contexts. and stir up political interference since informal
settlements are often major vote banks. Due
Information collected by the community produces procedures in terms of securing agreement to
authentic knowledge regarding the settlement and conduct PSE or involving them are sensitive
the issues affecting it. The nature of knowledge processes that require tact, and maintaining
becomes very self-instructive and powerful transparency in such situations becomes
since it is collected by the community itself. PSE challenging. Furthermore, informal settlements
becomes an empowering process that lends are often built upon contested land and the fear of
insights and motivates the community to organise eviction is persistent among residents. Wrongful
itself into organisations and use the data for its interpretation of the enumeration can raise
own benefit. The method identifies local leaders, suspicions of eviction and prevent participation by
the composition and needs of the settlement. A the community. Nevertheless, steady, transparent
community-driven enumeration process enables engagement with communities by building
local organisations to create data representing partnerships with local members can enable trust
their current challenges and fosters a collective building.
representation—a “we” factor. This encourages
greater participation, and since the communities Believing in the spirit and importance of
have the same set and levels of information as their participation, the Society for Participatory
local authorities, a sense of confidence to explore Research in Asia (PRIA) began a PSE process
and negotiate various entitlements and facilities through the ‘Engaged Citizens Responsive City’
is instilled. The data is used in different ways by (ECRC) initiative. Supported by the European
each member of the community and becomes a Union (EU), the objective of the ECRC project is
process of self-transformation for the community to enhance capacities of the urban poor to enable
2 Knowledge, Voice, Participation: Participatory Settlement Enumeration for Sanitation Services in Jhansiand increase their participation in planning and class and the urban poor. Thus, while discussing
monitoring of sanitation services in the three Indian the PSE method, this report also maps Jhansi city
cities of Ajmer (Rajasthan), Jhansi (Uttar Pradesh), by conducting sample enumerations in each ward.
and Muzaffarpur (Bihar). This has allowed for a holistic understanding of
Jhansi. Through the enumerations, deficiencies
The ECRC project makes sanitation an entry in sanitation services have emerged, solutions to
point to build capacities of the urban civil society, which can stem from a coordinated effort between
specifically focussing on the urban poor in informal municipalities and residents. These findings and
settlements. Following a rigorous mapping of the PRIA’s efforts could help establish a platform for
settlement using tools of participatory methods residents of Jhansi’s slums to congregate and
like settlement mapping, transect walks, trend pursue a common interest that furthers that of the
analysis, and stakeholder analysis, the team holds city as well.
meetings with community members and involves
them in the formation of Settlement Improvement The enumeration initiative is also in line with the
Committees (SICs). The members and leaders of objectives of the Swachh Bharat Mission (SBM)
such committees are chosen through democratic and acts as an assessment of the ground realities
processes involving youth, women and men. These in Indian cities. It can provide critical feedback
representatives converge to identify and represent and play an essential role in planning, monitoring
the needs of residents and articulate their rights and evaluation. That apart, the enumeration
and entitlements with Urban Local Bodies (ULBs) has identified relevant aspects through Service
and other stakeholders. This process helps in Level Benchmarks (SLB), which are defined as a
bridging the gap between citizens and ULBs as minimum set of standard performance indicators
well as other urban/municipal authorities. SICs that are commonly understood and used by all
allow residents (especially women and youth) to stakeholders across the country. SLB encourages
become active participants in the development municipalities and utilities to collect data to report
process by engaging as equal stakeholders in performances; however, the feedback process
people-centric urban planning and development, does not involve citizens. To a certain extent,
instead of remaining passive recipients. PSE addresses this gap. PRIA has previously
been involved with the World Bank's Water and
PRIA realises the need to bring stakeholders Sanitation Programme. As a result, lessons
together and the ECRC project has devised from that project have found their way into this
various strategies to incorporate them into the participatory enumeration of Jhansi's informal
project and to bridge the gap between the middle settlements.
City profile
The historic city of Jhansi, situated in the southern According to the 2011 Census, the average
extreme of Uttar Pradesh, is the cultural and decadal growth rate of Jhansi over 1991-2001
economic hub of the Bundelkhand region. In was 36%, which dropped to 19% between
recent years, it has been implementing many 2001 and 2011. The population of Jhansi city
urban flagship programmes, such as the Smart was 505,693 in 2011, which is expected to rise
City Mission, the Atal Mission for Rejuvenation and to 604,349 by 2020. An area of 150 square
Urban Transformation (AMRUT), and the Swachh kilometres falls under the Jhansi Municipal
Bharat Mission (SBM). Corporation (JMC).
Section 1: Introduction 3The average population density of the city is 398 higher, which is one of the reasons for sanitation
per square kilometre (Census, 2011), which is less problems and the poor quality of life in these
than the state average of 829 persons per square areas.
kilometre. The city has some high-density areas in
the inner city that include Gudri, Kushtiyana, Nayi The slums or informal settlements in the outer
Basti, Sarai, Madakhana, Datiya Gate (Outside), areas of Jhansi city are inhabited by new migrants,
Pachkuiyan, Daru Bhendala and Aligole. Low- mostly from the adjoining state of Madhya Pradesh
density areas include Bijouli, Picchor, Bileshwar and from other neighbouring states. These settlers
and Garigaon, which are located in the periphery work as daily labourers at construction sites, brick
of the city. kilns, quarry and bidi making. Some of them also
work as mobile hawkers, or drive tempos and auto
Increasing population has forced the development rickshaws.
of the peripheral areas of the city. The city’s newer
neighbourhoods include Hasari, Bhagwantpura, In terms of literacy, Jhansi holds a better position
Kochabhawar, Simardha, Pal Colony, Budha, in comparison to the state literacy rate. The
Karari and Gadiya Gaon. The most densely average literacy rate of Jhansi is 83.02% against
populated wards are located in the inner city. In the state literacy rate of 67.68%. Male literacy
areas of high concentration like Ward Nos. 08, 10, stands at 88.90% and female literacy rate at
16, 29, 31, 32, 41, 44 and 45, population density is 76.57% (Census, 2011).
General poverty profile of the city
According to Section 3 of the Uttar Pradesh Slum communities in Jhansi. In addition, the state
Areas Act, 1956, an area is considered as a slum government’s scheme, Manyawar Shri Kanshiram
if the majority of the buildings in the area are “…in Ji Shahri Garib Awas Yojana, provided free
any respect unfit for human habitation by reasons housing to people from the Economically Weaker
of dilapidation, overcrowding, faulty arrangements Sections (EWS) in Jhansi. These houses were
and designs of such buildings, narrowness or located near the city’s Engineering College and
faulty arrangement of streets, lack ventilation, light, Pal Colony area. Further, the National Urban
sanitation facilities or any combination of these Livelihood Mission operating through DUDA has
factors which are detrimental to safety, health and been giving vocational training in computer and
morals” (Census of India, 2013). Some of these mobile skills, beautician and other livelihood
‘slums’ are more than three or four decades old courses to people from all sections of society.
with generations living in these neighbourhoods, This scheme has targeted youth from 12 to 13
where ownership of land is mostly on private land wards across Jhansi. Individual and community
parcels. With time, the houses have become toilets are being built across the city through
concrete structures that have slowly begun Swachh Bharat Mission – Urban (SBM-U), while
receiving civic utility services on a more regular efforts at creating parks around the city have
basis. been under way under AMRUT.1 These efforts
are aimed at providing better sanitation services
In 2011, the Rajiv Awas Yojana (RAY) made as well as at improving the environmental
efforts to provide low cost houses to some conditions of the city.
1 Personal interviews with local councillors at Jhansi Municipal Corporation.
4 Knowledge, Voice, Participation: Participatory Settlement Enumeration for Sanitation Services in JhansiSection 2
Methodology
Participatory Settlement Enumeration (PSE), unlike team has identified 43 informal settlements where
traditional enumeration or survey, is designed, the enumeration was conducted.
conducted and managed by the communities
living in informal settlements of a city. Traditional A total of 3,665 households were enumerated,
enumerations conducted solely by ‘outsiders’— spread across 43 slums (a list of informal
whether government personnel or agencies settlements / slums is provided in Annex.2). Out
appointed by the government—often appropriate of 3,665 households, data from a total of 3,185
data or information from the community and use households in 35 slums were collected through
it for planning at the city, state or national level. a mobile-based enumeration process. A total of
PSE, on the other hand, is managed by ‘insiders’ 479 households in eight slums were enumerated
in the community, sometimes with facilitation from through traditional paper-based enumerations, the
the ‘outsiders’, leading to ownership of data, its reasons for which are explained later in this report.
analyses and community-led planning at the local The total population of household members covered
level. However, an effective and empowering PSE through these enumerations stood at 14,100.
would require a lot of preparation and facilitation
within the community. The PSE in Jhansi was conducted between
August 2016, and May 2017. Surveying was
PSE ensures that all the households in an informal designed as an iterative process, and not one
settlement within a ward must be numbered that amassed data. After an informal settlement
and enumerated. Later in this section we have was surveyed, the data was analysed, verified,
discussed the process of household listing and and validated with the community. This process is
numbering. In Jhansi, there were 75 informal elaborated in the following pages. SIC meetings
settlements according to the 1998 record of were held to discuss the findings with the
District Urban Development Authority (DUDA). community and prioritise actions for improvements
A comprehensive situation analysis of the field to the settlement, and to its residents. This pivotal
reflected that many informal settlements do not step was necessary to ensure utilisation of data.
conform to the characteristics of slums as defined
under UP Slum Areas Act, 1956. Most of these The PSE in Jhansi charted the following steps,
settlements now have well built houses with basic as shown in Figure 1, to prepare the community
infrastructures and services. Following the criteria in informal settlements to assess sanitation
as defined in UP Slum Areas Act, the enumeration conditions and planning for its improvement.
Section 2: Methodology 5Figure 1: Process of PSE
City-wide identification and Designing and Selecting and training the
mapping of informal settlements administering the questionnaire enumeration team
Monitoring the
Organising SICs House listing
enumeration process
Facilitating Participatory Validating and sharing enumeration
Orientation of SICs findings with community and other
Urban Appraisal (PUA)
stakeholders
City-wide identification and mapping of informal settlements
A process of mapping and listing informal and social institutions operational or active in
settlements2 was organised the city. In this exercise, these settlements. Field teams also interacted with
settlements were physically identified and plotted relevant stakeholders, such as community leaders,
on a map. Basic information regarding the legal ward councillors, and other elected representatives.
status of the settlement was collected as well. While
this exercise began by gathering secondary data The PRIA team simultaneously adopted various
and records on the lists of notified and non-notified methods of participatory research in rapport and
slums, the PRIA team did not restrict this process to trust building, information collection and secondary
settlements that were recognised by governments data verification with the community. Such
and state authorities alone. Information on informal methods included walks, settlement mapping and
settlements available with city authorities/agencies timelines, which are explained later in this report.
is often outdated. As a result, people are often
found living in unrecorded settlements. The community interactions revealed that only a
few CBOs existed in these settlements. The team
The mapping process provided for a first-level approached the active members of these groups and
interaction with communities living in these explained the initiative, by discussing the objectives
settlements. It helped in the identification of active and the role that these groups can play in the future.
citizens and leaders of the community, along with The active members then played instrumental roles
other Community-Based Organisations (CBOs) in reaching out to other community members.
Organising SICs
collection of authentic data. When a community
Community organisation is a prerequisite for enumerates, evaluates and monitors itself, the
designing and executing a PSE exercise. Joining sustainability of the positive changes increases.
hands with the communities for such processes There emerges a sense of ownership, unlike
ensures the inclusion of local knowledge and the situations where unknown third parties undertake
2 Several socially derogatory terminologies are used for settlements of the urban poor in government records and policies (e.g., ‘Kacchi Basti’
in Rajasthan, ‘Malin Basti’ in Bihar and Uttar Pradesh, and ‘Jhuggi Jhopari’/’Gandi Basti’ in many other states). This project has named these
settlements as ‘Informal Settlements’ instead of using the local terminology for the dignity of the people living in such areas.
6 Knowledge, Voice, Participation: Participatory Settlement Enumeration for Sanitation Services in JhansiSettlement Improvement Committee (SIC)
SICs are representative institutions established with nominated
residents of the informal settlement community. SICs act as
bridges between service providers and the community. These SICs
work as institutions that speak in unison about the community’s
needs and rights. They are the focal points through which external
stakeholders can connect with the community in question.
the same processes. Community participation on the settlement’s problems, identifying community
holds high importance for generating real- needs, and finding solutions to these problems and
time, validated data from the field, where the needs by working with other institutions.
enumerators are themselves inhabitants of the
slums being enumerated, apart from being aware SICs are representative bodies established with
of local contexts, formal/informal arrangements nominated residents of the informal settlement.
and the people. Each SIC has a total of 8-15 core members. The
project made conscious effort towards larger
Community organisation processes are aimed at involvement of youth and women as member of
the formation of local institutions that advocate for these committees.
the interests and needs of the urban poor. The
ECRC project created 250 SICs in the three project When facilitating the formation of SICs, PRIA
cities, including 40 SICs in Jhansi. These SICs facilitators tried to ensure the engagement of
were developed and managed by the residents of all households in the settlement. To ensure
these settlements. This formation was aimed at sustainability of the SIC, barriers of caste, class,
providing a safe space for discussing and reflecting gender and age needed to be broken.
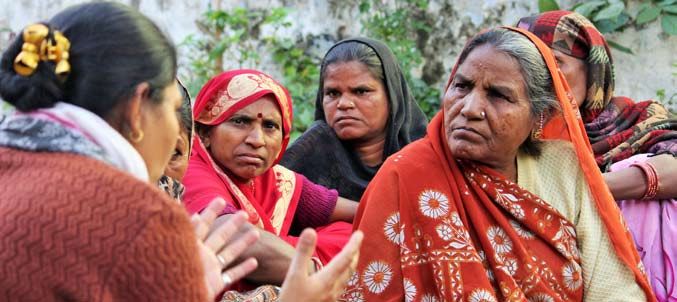
Facilitating Participatory Urban Appraisal (PUA)
The process of mapping was combined with This process helped to a certain extent at ensuring
Participatory Urban Appraisals (PUAs), a that the PSE questionnaire included all issues
participatory action research method used for relevant to the communities in terms of service
mobilising communities, understanding local provision and social climate. The PRIA team
context, raising awareness and building a undertook an in-depth understanding of the same
collective understanding on the issues faced through various processes:
by residents. Communities are often hesitant to
interact with outsiders. This process, however, was Transect Walks: The PRIA team undertook transect
essential because it is a non-threatening, non- walks with members of the community to collectively
extractive approach, which is community-centric form an understanding of the informal settlement by
and non-directive. It ensured a collective learning identifying its location, geographical spread, housing
process for the community and broke prevalent conditions, and availability of services. Transect
power barriers. Such a process also offers a walks were used as an entry point, allowing the team
chance to the ‘outsider’ (PRIA, in this case) to to ‘observe’ through the eyes of local people, and
understand the local context. help in building a rapport with the community.
Section 2: Methodology 7Timeline: This approach provided a historical tracks, as well as local social infrastructure such
perspective and helped the PRIA team understand as, schools, health centres, mosques and temples.
the nature of changes that have taken place in the Public areas such as parks, service points like hand
settlement. The timeline approach was used with pumps and ration shops were also identified.
community members to get an overview of key
events in a chronological order. Stakeholder Analysis: The SIC core members
along with the community members, enumerators
Participatory Social and Resource Mapping: This and field team conducted a stakeholder analysis of
process allowed the team to work with community primary, secondary and tertiary level stakeholders
members to generate a social and resource map to identify the key people in the community. This
to gather information on the spatial layout, location process charted out the individuals and institutions
of houses, and infrastructure facilities. This process that could be engaged in community building
also mapped landmarks, roads, intersecting railway processes.
Orientation of SICs
After the formation of SICs, the PRIA team SIC members to widen their perspective of the
provided regular mentoring and coaching support issues/problems faced by informal settlements
to the core members. Regular meetings were and to deal with them in a more informed and
held with each SIC to understand the nature of constructive manner.
their problems, priorities as well as ideas on how
to solve these issues. Concurrently, the team As SICs advanced, core members were nominated
prepared profiles of each SIC member to assess to participate in orientations held by PRIA. These
their learning needs. Based on this, orientation orientations furthered their understanding and built
and training programmes were designed to create on their existing knowledge, while providing for
an understanding of the role of the SIC, as well as leadership development, articulation of problems,
the rights of residents of these settlements. These and role of municipality and other state agencies.
orientations were planned in three to four rounds Some SIC members became interested in
of short, interactive sessions and were conducted conducting enumerations along with the selected
in a participatory manner focusing on topics such enumeration team of animators, details of which
as the need for organising community, leadership are mentioned in the respective sections on
development, conducting community meetings, enumeration team selection. The SIC members
etc. The orientation sessions were organised who were trained in the PSE method, became
for a cluster of SICs (with three to four SICs in involved in the participatory process of house
each cluster). These orientation sessions helped listing and subsequent steps.
House listing
The PSE included all the households in listing process for each settlement. It was
a particular settlement. It required a clear essential for the house numbering activity to
demarcation and house numbering or house be a participatory process to ensure that every
8 Knowledge, Voice, Participation: Participatory Settlement Enumeration for Sanitation Services in Jhansihousehold bore a systematically assigned PRIA on the process of house numbering. A
number. The team, comprising the SIC members full description of the house listing method is
and community enumerators, were trained by presented in Annex 1.
Designing and administering the questionnaire
A total of 3,665 households were enumerated, enumeration. On visiting the field, the team
spread across 43 informal settlements (a list identified eight settlements spread over six wards
of informal settlements/slums is provided in that were marked as slums under the official
Annex 2). Out of 3,665 households, data from a DUDA list, but in reality did not have slum like
total of 3,185 households in 35 settlements were conditions. Out of these eight slums, five slums
collected through a mobile-based enumeration (Budha, Mairi, Nagari Kua, Piriya, Leher Girdh)
process. A total of 479 households in eight were part of three wards (Ward nos. 10, 39 and
settlements were enumerated through traditional 24), which were designated Gram Panchayats
paper-based enumerations, the reasons for until the delimitation process in 2005, after
which are explained later in this report. The total which they were brought under the jurisdiction
population of household members of the JMC. Fifteen wards, including the three
covered through these enumerations stands mentioned above, were declared as slums and
at 14,100. fell within the municipal limit.
The administered questionnaire was divided into These five slums as well as the remaining three
sections for ease of data filling and analysis. slums (Bhandari Gate Outside, Khushipura
While the thrust of the questionnaire was to gauge and Narsingh Rao Tauriya in wards 46, 14 and
the level of sanitation facilities in the informal 56, respectively) were either built up areas
settlements, it also captured basic information with multi-storey residential units with basic
about households, which was often important for infrastructure in place or were area patches
correlation analysis. that displayed slum-like characteristics.
Furthermore, these slums were above-average
The questionnaire design (Figure 2) was large settlements for which conducting mobile-
prepared and used for mobile-based based PSEs would have been time consuming.
Figure 2: Various aspects of questionnaire
Registration form • Classification of settlement
• Basic details including name of respondent and head of household, mobile number, address
Basic household • Type of house
information • Ownership and registration
• Family income
• Religion and caste
Household • Household members and their gender, age, level of education, occupation
members' details • Access to documents like birth certificate, aadhaar card, bank account, and voter card by
household members
Toilet, water, SWM • Type of toilet facility available and its utilisation
and sewerage • Desire and availability of space for toilets and application process for the same
• Waste water outlets
Section 2: Methodology 9Therefore, to avoid confusion, the team worked characteristics. The team focussed particularly
with their official status as slums and decided on patches where households dominantly
to conduct a paper-based sample enumeration practiced open defecation despite good
for the area patches that displayed slum infrastructure in all the eight slums.
Selecting and training the enumeration team
A semi-structured one-day training was organised Additionally, understanding on smart phone-based
for 15 community enumerators who were selected enumeration was also discussed. This focussed
from the youth residing in various informal on basic aspects like the use of GPS, power
settlements. They were identified during the management, data connections, etc.
PUA processes and often played a crucial role
in SIC formation. All settlements covered for the These trained enumerators and the PRIA team
enumeration in the city were divided within these hosted a half-day orientation session for some
15 members. Their presence made communities SIC members who were keen to work along
feel more comfortable. with enumerators to conduct enumerations in
their own settlements. Many enumerators and
The training session introduced the participants SIC members had never utilised a smart phone
to the questionnaire, followed by an intensive before, and an additional step thus was to
discussion on the rationale and logical flow of demystify technology.
various questions. Once an understanding of the
questionnaire had developed, the participants The execution of PSE required a planned
were taken through the customised mobile delegation of responsibilities with checks and
application designed to capture the enumerations. balances. The first step was to define the roles
Following this, the key areas of monitoring and and responsibilities of the three-layered team, as
verification of the enumeration were discussed. elaborated in Table 1.
Table 1: Roles and responsibilities of different team members
Team member Key responsibilities
Community Enumerator • Identifying households to be enumerated
and SIC Members
• Conducting household level enumerations
• Responding to all queries raised by the coordinator and administrator for various
records
The Survey Coordinator • Supervising the implementation of the enumeration
• Providing guidance in the implementation and monitoring of enumerations
• Quality check of enumeration records
Survey Administrator • Random monitoring and quality checking of enumeration records
• Providing support and guidance to supervisors and enumerators
• Troubleshooting of errors and any other issues faced
• Updating application when required
10 Knowledge, Voice, Participation: Participatory Settlement Enumeration for Sanitation Services in JhansiMonitoring the enumeration process
Enumeration monitoring is an essential part of Apart from such back-end precautions, a strict
ensuring data quality. One of the advantages of horizontal and vertical division of responsibility
a mobile-based application lies in the fact that a with checks and balances was set up as a
large number of monitoring aspects can be built system. A pre-enumeration planning procedure
right into the application. It is to be noted that the secured responsibilities into a three-tier system
enumeration was created with built in skip logic, as discussed in Table 1. Once a settlement was
which means that subsequent questions were enumerated, a Survey Coordinator checked the
based on previous answers and the selection of data for consistency. The Survey Administrator
certain variables. Additionally, to avoid common conducted random evaluations as well. Some
mistakes, the application was built to reject and of the aspects checked by the Coordinator and
warn against certain errors. Administrator are mentioned in Table 2.
Table 2: Checklist used in monitoring data
Form 1 • Check spelling of respondent / Head of the household, and surname.
• Check address of house and format for entry.
• Check slum name and slum code.
• Check date of enumeration.
• Check for non-participants, and whether these houses can be visited again.
• Check for total number of houses and corresponding number of enumerations.
• Since house numbering has been conducted, check to see if all addresses are a part of the
enumeration.
Form 2 • Check type of house.
• Depending on notification status of slum, check responses received for land ownership
(patta, etc.). Ensure that responses are in line with others received in the settlement.
• Check religion and caste.
Form 3 • Check for total number of members in house (using the definition of household as provided in
National Census).
• Check for spellings of family members.
• Ensure that age is written in complete years. In case of children less than 1 years of age,
enumerators are to write 0.
• Check to see if the age of members matches with education and occupation profile; Use
appropriate filters to check this.
Form 4 • Check for type of toilet.
• Check to see if outlets of Bathroom, Kitchen, and Toilet match. If not, probe to understand why.
Also check if certain responses stand out from those that are general to that slum.
• Check for facility of garbage collection and if it matches with facilities available in the settlement.
• Check similarly for drinking water sources.
• Check if source of drinking water matches other water sources. If not, probe to understand why.
Form 5 • Check if mobile numbers have been entered.
Form check • This is elaborated above. Make sure there are no incomplete enumerations and ensure that
enumerations are completed in adequate time (neither too fast nor too slow).
Section 2: Methodology 11This report presents the data in a consolidated and Aadhaar cards, since the data points are
form. The researchers believe that any comparison dynamic and evolving. The annex contains a list
across settlements should be conducted with of settlements surveyed along with the month and
caution, especially pertaining to data about toilets year of survey.
Analysis, validation and sharing
The entire enumeration process came full circle Keeping in mind the dynamic nature of informal
through the analysis, validation and sharing of settlements, these analyses were then validated
the data generated. The analysis consisted of at multiple rounds of group meetings with the
the tabulation of settlement-wise breakdown of community members. Dated information was
the demographics of all respondents and their changed and modified as per changes on
households. Basic household information, inclusive the ground. This process kept the community
of cross-tabulation between the type of houses engaged and participative in ensuring that the data
with ration cards and income, as well as ownership reflected the current status of their settlements.
and registration of houses were analysed. A few Once validated, the data was shared with the
cases included the cross-tabulation of member other stakeholders, including elected councillors
level details such as gender, age, education and and municipal officials. The community and
occupation with access to legal documents. The other stakeholders discussed the results of the
analysis also exhibited the state of access to enumeration for potential solutions and positive
sanitation facilities, such as toilets, and the kind of changes.
structural set up dominant in the settlements.
12 Knowledge, Voice, Participation: Participatory Settlement Enumeration for Sanitation Services in JhansiSection 3
Findings from the
Participatory Settlement
Enumeration
Demographic and Socio Economic Profiles
Respondents 89% (3,252). Eleven per cent (400) households
belonged to the Muslim religion, and other
Fifty eight per cent (2,109) respondents were head religions included Sikhism and Christianity.3
of households. The other respondents included
members of households, including parents, As far as the distribution of caste is concerned,
children, sons-in-law, grandchildren, and in a few 6% (226) households enumerated in the slums
cases, other relatives. belonged to the General category. As per Census
2011, Scheduled Castes (SC) constituted 28.14%
Religion and caste of the city’s population. Compared to that, the
current enumeration showed that a total of 53%
Similar to the findings of the 2011 Census (91.26% (1,948) SC households lived in the enumerated
Hindu and 7.40% Muslim), the households slums and a significant 40% (1,354) belonged to
predominantly belonged to the Hindu religion with Other Backward Classes (OBC). It clearly showed
that the slums were inhabited by significantly
Chart 1: Religion of the household (N=3,665)
larger number of SC and OBC communities as
400, 11% compared to the General category. This also
reflected the disadvantaged social and economic
conditions of the SC and OBC communities
and lack of access to basic services, rights and
entitlements to them.
Findings for the Scheduled Tribe (ST) category
are also in line with the Census 2011 report, which
places the ST population at 0.19% for the city. As
3,252, 89% per our findings, 4% (131) households belong to
the ST category.
Hindu Muslim
* Includes paper surveys
3 Only the two most dominant categories of religion have been displayed in the chart, as the respondents from other religions formed a minor
percentage.
Section 3: Findings from the Participatory Settlement Enumeration 13Distribution of sex Chart 3: Age distribution of household members
(N=13,621)
As per Census 2011, males constituted 53% 893, 6% 1058, 8%
of the slum population in India, while females
constituted 47%. The analysis generated through
1237, 9%
the current enumeration exhibited a similar trend
of a male population of 54% (7,558) and female 1305, 10%
population of 46% (6,540).4 This feeds well into
various possibilities. One would be the unfortunate
and persistently disparate sex ratio in India.
Another possibility is that a higher part of the male
population migrate from poor villages to cities 9128, 67%
for livelihood and affordability makes slums an
obvious choice of residence. This hypothesis also 0 to 4 years 5 to 9 years 10 to 14 years
reflected on the data where a dominant portion 15 to 59 years 60 years and above
(67%) of the slum population belonged to the
category of working age group.
working population, of which a significant portion
Chart 2: Distribution of male-female to total is constituted by youth. Only 6% (893) of the
population (N=14,100) population belonged to the age group of 60 years
and above. This was followed by the age group
6,540, 46% between 10-14 years at 10% (1,305).
Sex and age-wise distribution of
educational status
The questions related to gender and age-
wise disaggregation of the educational status
for household members was not asked in the
paper enumeration. Therefore, the analysis
7,558, 54%
of age distribution in slum settlements was
based on 35 slums covered through mobile-
Men Women
based enumerations. Based on this, the total
* Includes paper surveys population of all household members was 13,621
(N=13,621).
The question regarding the age of individual
members in households was not asked in paper- The literacy rates (Census of India, 2013) for
based enumeration, and therefore the analysis slums in India reflect a gender disparity, with male
of the age distribution in the slums is based on literacy at 83.7% and female literacy at 71.2%. A
the 35 slums covered through the mobile-based similar and more jarring disparity is reflected in the
enumeration process. This reduces the sample to literacy rates in Census 2011 for Uttar Pradesh,
N=13,621 in Chart 3. with male literacy rate at 77.28% and female
literacy rate at 57.18% (Census of India, 2011).
Sixty seven per cent of the population belonged The current analysis revealed a similar trend. It
to the age group of 15-59 years. This is the must be kept in mind, however, that this question
4 There were two transgender respondents who have not been included in Chart 2 due to their numerical value being less than 0% compared to
the total percentage.
14 Knowledge, Voice, Participation: Participatory Settlement Enumeration for Sanitation Services in Jhansiwas not administered to the age group of five unequal right to education between girls and
years and below. Twenty nine per cent (1,863) boys.
of the male and a staggering 43% (2,534) of the
female population in the enumerated slums were The analysis of age-wise distribution of education
found to be illiterate. Only 14% (930) of the male (Chart 5) suggests that dominantly, 67% (597)
population and 13% (748) of the female population of the population in the age group of 60 years
had received an upper primary education. The and above, and 39% of those between 15 – 59
results are slightly better for those educated till years were illiterate. This is largely attributable
secondary schooling with men at 26% (1,684) and to a lack of access to education in the earlier
women at 18% (1,077). The graduate population generation’s childhood, or even to any kind of
remained under 8% for both genders as shown in adult education.
Chart 4.
Another disappointment is visible in the analysis
This is a vital area that the JMC could focus on. of the 5 to 9 year bracket. While 61% of this
Government programmes like National Urban bracket is enrolled in school, 22% have been
Livelihood Mission, which aims to promote listed as functionally literate, and 16% as illiterate.
self-employment, as well as corporations like This highlights the higher drop out rates and
National Skill Development Corporation that substantiates the explanation that many children
aims to create quality skill training institutes for in these informal settlements end up helping their
the youth could be partnered with for improving families in livelihood generation or domestic chores.
the skill and education of the youth. Improved
and equal access to education will have a The state of education disaggregated by age
bottom up effect in terms of living conditions, is very grim, especially keeping in mind the
social and civil responsibilities and equitable disabling effect it has on the most productive age
opportunities for women and men. Without group of any nation. It is essential for the JMC to
these, a large chunk of the youth and working look at this as a motivation to ensue serious adult
population will dwell in informal economies education programmes and incentive schemes
with unprotected and exploitative jobs, wherein like mid-day meals and free stationary/uniforms
traditional notions of gender roles will remain to reach out to a larger population across ages to
unchallenged, perpetuating the vicious cycle of impart equal and quality education.
Chart 4: Sex wise education status of household members
60
50%
50%
43%
40
Percentage
29%
26%
18%
14%
20
13%
9%
8%
8%
7%
6%
6%
5%
4%
0.4%
0.2%
1%
1%
0%
0%
0%
0%
0%
0%
0%
0
Illiterate Functional Primary Upper Secondary Upper Graduate Graduate Other
literate educated primary schooling secondary or above
educated schooling
Men (N=6,435) Women (N=5,828) Other (N=2)
5 This figure can vary by 3–5% as there may have been some students currently attending school who may have been captured here.
Section 3: Findings from the Participatory Settlement Enumeration 15You can also read