Literature Review Gas Infrastructure Advice - Infrastructure Victoria
←
→
Page content transcription
If your browser does not render page correctly, please read the page content below
APRIL 2021 | GAS INFRASTRUCTURE ADVICE – LITERATURE REVIEW

                                                             Literature
                                                             Review
                                                             Gas Infrastructure Advice
                                                             Final version

OFFICIAL                                                                         Gas Infrastructure Advice – Literature Review   1
Table of Contents

                 Introduction ........................................................................................................................................................... 3
                 Literature review ................................................................................................................................................... 5
       2.1       Victorian gas infrastructure ..................................................................................................................................... 5
                 2.1.1        Gas value chain ........................................................................................................................................ 5
                 2.1.2        Greenhouse gas emissions .................................................................................................................... 13
       2.2       Decarbonisation technologies ............................................................................................................................... 16
                 2.2.1        Need for decarbonisation ........................................................................................................................ 16
                 2.2.2        Australian decarbonisation pathways...................................................................................................... 17
                 2.2.3        Hydrogen ................................................................................................................................................ 18
                 2.2.4        Biogas ..................................................................................................................................................... 26
                 2.2.5        Carbon capture and storage (CCS) ........................................................................................................ 30
       2.3       Analysis of decarbonisation pathways .................................................................................................................. 33
                 2.3.1        Scenario description ............................................................................................................................... 34
                 2.3.2        Cost benefit analysis ............................................................................................................................... 37
                 2.3.3        Energy system modelling ........................................................................................................................ 42
                 2.3.4        Hydrogen roadmaps ............................................................................................................................... 48
                 2.3.5        Spatial analysis ....................................................................................................................................... 51
       2.4       Role of government............................................................................................................................................... 54
                 2.4.1        Literature overview.................................................................................................................................. 54
                 2.4.2        Government actions ................................................................................................................................ 56
                 Conclusion .......................................................................................................................................................... 58
       3.1       Victorian gas infrastructure ................................................................................................................................... 58
       3.2       Decarbonisation technologies ............................................................................................................................... 59
       3.3       Analysis of decarbonisation pathways .................................................................................................................. 61
       3.4       Role of government............................................................................................................................................... 62
       References ...................................................................................................................................................................... 63

OFFICIAL                                                                                                                          Gas Infrastructure Advice – Literature Review                 2
Introduction

       Background
       The fifth Synthesis Report of the Intergovernmental Panel on Climate Change (IPCC) provides the most recognised
       scientific analysis of the role of human influence on the climate system. Recent anthropogenic emissions of greenhouse
       gases are the highest in history. Continued greenhouse gas emissions will cause further warming and long-lasting
       changes in the climate, increasing the likelihood of severe, pervasive, and irreversible impacts for people and
       ecosystems. To slow or limit these risks, humanity must both adapt to a changing climate and take measures to reduce
       greenhouse gas emissions (IPCC 2014).
       Countries and their jurisdictions have committed to reduce and manage the risk of climate change around the world. In
       2017, the Victorian Parliament created the Climate Change Act 2017 to establish a long-term emissions reduction target
       of net zero by 2050.
       Natural gas is a naturally occurring gas that primarily consists of methane. The fossil fuel is made from carbon-rich,
       decomposed plants and animal matter subject to intense heat and pressure under the Earth’s surface for millions of
       years. The combustion of natural gas produces environmentally harmful greenhouse gases like CO2, contributing to a
       changing climate. In 2018, the energy sector in Victoria produced 89.5% of Victoria’s total net emissions, including
       electricity generation, direct combustion, transport, and fugitive emissions from fuels.
       The cost of energy is also a key influence on living and doing business in Victoria. Victoria has Australia’s largest
       network of natural gas infrastructure, providing over two million households and businesses with natural gas. Natural gas
       combustion is used as an energy source in the energy sector for industrial and residential heating, cooling, and electricity
       generation. Compressing natural gas into a liquid form is also used in the transport sector as a fuel for vehicles. In the
       chemical industry, natural gas is used as an industrial fuel and chemical feedstock to produce ammonia as a fertiliser.
       While many national and global studies focus on the emissions impact of the electricity sector, the gas sector has not
       been fully considered. The exact pathway forward to decarbonise gas technology and infrastructure domestically and
       internationally is not yet known. There are several uncertainties: First, there are uncertainties as to which technologies
       can be applied to achieve decarbonised gas infrastructure. Second, the development of pathways and scenarios, timing,
       scale, and growth trajectories are uncertain. Finally, economic, social, and environmental impacts on costs and benefits
       of those pathways are unknown.

       Scope of Advice
       The Victorian Government has asked Infrastructure Victoria to advise on the nature and timing of decisions relating to
       Victoria’s extensive gas transmission and distribution networks in 2050 where: net zero emissions are economy-wide
       sufficient, and suitable energy and chemical feedstocks are available for domestic, commercial, and industrial use; and
       hydrogen and biomethane solutions are viable.
       To inform this advice, Infrastructure Victoria will engage with industry, government, regulators, consumer groups and
       other key stakeholders and seek out evidence to inform our recommendations. Infrastructure Victoria will also
       complement and build upon existing state and federal strategies, policies, and regulatory frameworks, including Victoria’s
       Gas Roadmap funded in the 2020-21 State Budget, led by the Department of Environment, Land, Water and Planning
       (DELWP).
       The advice will examine two or more appropriate scenarios for a net zero emissions energy sector in 2050 and assess
       their relative economic, social, and environmental impacts. It will explore the implications of these for gas production,
       electricity generation, and transmission and distribution networks, identifying the infrastructure decisions that need to be
       made, and the timing of these decisions.
       Infrastructure Victoria will consider the extent to which gas infrastructure can be used for hydrogen, carbon capture and
       storage (CCS) and/or biomethane, where existing gas infrastructure can be optimised, and the role for the Victorian
       Government in supporting these technologies as they transition. Our advice will also assess the cost and reliability
       impacts of key infrastructure decisions, including how to minimise the social, environmental, and economic costs to
       businesses, industry, and the community.

OFFICIAL
At the request of the Victorian Government, our analysis will also examine key uncertainties, trigger points and
       interdependencies associated with the infrastructure decisions identified, including any significant risks and mitigation
       options.
       Our advice takes a multi-disciplinary approach to research, drawing on analysis from interstate and international
       jurisdictions. Existing available evidence and modelling will be used where it is available, and the sources of that
       evidence clearly identified. The analysis will consider the implications for gas infrastructure relative to related trends,
       such as the use of zero-emission vehicles, low emission fuels, industry transitions, and sector pledges to reduce
       greenhouse gas emissions.

       Scope of Literature review
       This review presents key issues and opportunities identified in current literature sourced from academia, industry, think-
       tanks, and governments. The reviewed literature contributes to our understanding of the critical risks and opportunities
       towards net zero emissions for Victoria's gas infrastructure. The literature review helps to understand where the gaps are
       in the current evidence and what further research may be needed to inform our final advice. This review is not intended
       to be a comprehensive analysis of all literature related to gas infrastructure in a net zero emissions electricity sector.
       Instead, it is targeted areas relevant to our advice. In particular, the literature review addresses the following questions:
       1.   What are the key risks and opportunities for existing natural gas transmission and distribution infrastructure in
            relation to achieving net zero emissions in Victoria by 2050, particularly in relation to hydrogen, biomethane and
            carbon capture and storage (CCS)?

       2.   What pathways have been proposed to replace:
               a. energy, and
               b. chemical uses of natural gas?

       3.   What is the technical and commercial maturity of those pathways?

       4.   What modelling, if any, has been conducted that can assist our understanding of the environmental, social, and
            economic (ESE) costs and benefits of the transition to net zero emissions for the gas sector in Victoria?

       5.   What are the key assumptions and conclusions?

       6.   What is the role of the government?

OFFICIAL                                                                                      Gas Infrastructure Advice – Literature Review   4
Literature review

       The purpose of this literature review is to identify critical risks and opportunities for gas infrastructure as Victoria
       transitions to net zero emissions by 2050.
       Section 2.1 outlines the current role of gas infrastructure in Victoria, while section 2.2 covers the three technologies
       currently being developed to support decarbonisation: hydrogen, biogas and carbon capture and storage (CCS). Section
       2.3 Analysis of decarbonisation pathways illustrates options to replace energy and chemical uses with natural gas.
       Finally, section 2.4 examines the Role of government in achieving the net zero emissions of the gas infrastructure
       globally and locally in Victoria. Chapter 3 summarises key findings and answers the key questions of the literature
       review.

       2.1       Victorian gas infrastructure
       Section 2.1 identifies critical risks and opportunities for gas infrastructure in Victoria to 2050.

       2.1.1 Gas value chain
       Victorian gas infrastructure is defined as the entire value chain of consumption, production, export, gas shortfall,
       transmission and distribution, storage, and end-use.

       Energy consumption
       Primary energy consumption measures the total amount of energy demand in an economy, including the energy sector's
       consumption, its energy losses during the transformation from oil or gas into electricity, its energy distribution, and the
       final consumption by its end users, including domestic use and export.

       Energy consumption by state
       The amount and mix of energy sources used in each Australian state vary widely. Victoria has the third-largest energy
       consumption with a share of 20.9% (see Table 1). Since 2008-09, Victoria’s energy consumption has fallen by around
       1.0%, mainly due to the shift from coal-fired electricity generation to renewable energy. This fall can be attributed largely
       to small-scale and large-scale solar and wind power (DISER 2020a).
       Table 1: Australian energy consumption by state and territory in 2018-19 (DISER 2020a)

                                               Energy consumption in 2018-19                         Average annual growth
                                     PJ                            Share in %                2018-19 in %           10 years in %
           NSW & ACT                 1,540.6                       24.9                      -0.3                   -0.7
           VIC                       1,297.6                       20.9                      -1.5                   -1.0
           QLD                       1,525.3                       24.6                      -1.8                   1.8
           WA                        1.261.0                       20.4                      4.5                    3.7
           SA                        322.6                         5.2                       -3.8                   -0.7
           TAS                       108.8                         1.8                       -1.9                   -0.6
           NT                        140.1                         2.3                       53.8                   4.5
           AUS                       6,196.00                      100                       0.6                    0.7

OFFICIAL                                                                                       Gas Infrastructure Advice – Literature Review   5
Energy consumption by fuel type
       In 2018-19, most (95%) of Victoria’s energy came from fossil fuels. Oil, (including crude oil, liquefied natural gas (LNG),
       and refined products), account for the largest share of energy consumption with 39%, followed by coal (34%) and gas
       (22%), the third-largest energy consumption. In 2018-19, renewable energy accounted for 6% of Victoria’s total energy
       consumption (DISER 2020a).

       Figure 1: Australian energy mix, by state and territory in 2018–19 (DISER 2020a)

       Victoria is very similar to the national average (refer to Figure 1) with fossil fuels accounting for 94% of Australia’s energy
       consumption in 2018-19. Oil accounts for the largest share of energy consumption (39%) followed by coal (29%) and gas
       (27.5%). In 2018-19, gas consumption increased by 2% with the expansion of LNG exports (DISER 2020a).

       Table 2 shows Victoria is the third-largest gas consumer compared to other Australian states. Including domestic use
       and export processing, gas accounted for 42% (668.7 petajoules (PJ)) of energy consumption in Western Australia,
       18.4% (292.6 PJ) in Queensland, closely followed by Victoria with 17.8% (283.9 PJ) (DISER 2020a).
       Table 2: Australian primary energy consumption by fuel type in 2018-19 (DISER 2020a)

                                                             Energy consumption 2018-19 in PJ
                             Coal                 Oil                  Gas                   Renewables            Total
           NSW & ACT         640.3                657.9                131.4                 90.4                  1,540.6
           VIC               444.1                501.3                283.9                 72.0                  1,297.6
           QLD               554.0                574.6                292.6                 123.9                 1,525.3
           WA                126.8                438.6                668.7                 26.8                  1,261.0
           SA                26.3                 141.1                114.1                 39.0                  322.6
           TAS               10.0                 41.6                 10.0                  46.6                  108.8
           NT                -                    47.0                 91.9                  1.1                   140.1
           AUS               1,801.6              2,402.1              1,592.7               399.6                 6,196.0

       Although natural gas consumption in Western Australia and Queensland is higher than Victoria, consumption is driven
       mainly by gas-fired power generation (GPG) and mining (refer to Figure 2). Victoria is the highest user of residential and
       commercial gas.

       The next step is to analyse how energy demand is met and how much energy Australia needs.

OFFICIAL                                                                                     Gas Infrastructure Advice – Literature Review   6
Figure 2: Major category gas consumption by state (% share of total) in 2018-19 (AEMO 2020a)

       Energy production
       Primary energy production is defined as the total amount of primary energy produced in the Australian economy,
       measured before consumption or transformation into secondary energy products, e.g., coal into electricity.

       Australian gas production

       Looking at gas production only, Australia produced in total 5,498.1 PJ of natural gas in 2018-19 (see Table 3).
       Conventional gas accounted for around three-quarters, and coal seam gas (CSG) one-quarter of the Australian gas
       production. Western Australia produces around 60% of Australian gas, followed by Queensland (25%) and Victoria (9%)
       (DISER 2020a).
       Table 3: Australian production of gas in 2018-2019 (DISER 2020a)

                                                     Gas production in 2018-19
                          Conventional gas in PJ      CSG in PJ                   Total in PJ               Total in %
           NSW & ACT      -                           3.8                         3.8                       0.1%
           VIC            517.2                       -                           517.2                     9.4%
           QLD            37.7                        1,404.4                     1,442.1                   26.2%
           WA             3,350.4                     -                           3,350.4                   60.9%
           SA             121.0                       -                           121.0                     2.2%
           TAS            -                           -                           -                         0.0%
           NT             63.6                        -                           63.6                      1.2%
           AUS            4,090.0                     1,408.1                     5,498.1                   100%

       Gas export
       Comparing Australia’s total gas production with its gas consumption, it can be seen that most of Australia’s gas
       producution is exported. Having a closer look at Australia’s gas flows (see Figure 3), the majority of Australia’s gas
       production (72% or 4,094 PJ) is exported as LNG (DISER 2020a). A large amount of energy is needed to convert natural
       gas into LNG. With a share of 7.5% (or 425 PJ), the second-biggest consumer of gas in Australia is the gas industry itself
       (Climate Council 2020b).

       A total of 20.5% (or 1,167 PJ) of gas consumption is domestically used for gas-fired power generation (8.2% or 469 PJ),
       manufacturing (6.6% or 373 PJ), residential (3.0% or 169 PJ), and mining (1.2% or 66 PJ) (DISER 2020a).

OFFICIAL                                                                                  Gas Infrastructure Advice – Literature Review   7
Figure 3: Australian natural gas flows, in PJ, 2018–19 (DISER 2020a)

       Victorian gas shortfall
       The Victorian Gas Planning Report (VGPR) provides an overview of the gas transmission network planning for Victoria.
       The majority of Victoria's natural gas is produced in the Gippsland Basin and processed at the Longford gas plant (refer
       to Table 4). Natural gas is also supplied from other gas fields in Gippsland, Otway Basins, offshore from the Bass Coast
       area and interstate (AEMO 2021b).
       Table 4: Victorian gas production facilities (AEMO 2021b)

           System        Total           Gas plant        Project                     Project ownership
           Withdrawal    available in
           Zones (SWZ)   2020
           Gippsland     316 PJ          Longford Gas     Gippsland Basin Joint       • Esso Australia Resources, 50%
                                         Plant            Venture                     • BHP Billiton Petroleum, 50%
                                                          Kipper Unit Joint Venture   • Esso Australia Resources, 32.5%
                                                                                      • BHP Billiton Petroleum, 32.5%
                                                                                      • Mitsui, 35%
                                         Lang Lang        BassGas Project             • Beach Energy Limited, 53.75%
                                         Gas Plant                                    • Mitsui, 35%
                                                                                      • Prize Petroleum International, 11.25%
                                         Orbost Gas       Sole Gas Project            • Cooper Energy, 100%
                                         Plant
           Port          44 PJ           Otway Gas        Otway Gas Project           • Beach Energy Limited, 60%
           Campbell                      Plant                                        • O.G Energy, 40%
           (Geelong)
                                                          Halladale/Speculant         • Beach Energy Limited, 60%
                                                          Project                     • O.G Energy, 40%
                                         Iona Gas         Iona UGS                    • QIC, 100%
                                         Plant
                                                          Casino Henry Joint          • Cooper Energy, 50%
                                                          Venture                     • Mitsui, 50%
                                         Minerva Gas      Casino Henry Joint          • Cooper Energy, 50%
                                         Plant            Venture                     • Mitsui, 50%

       Victoria’s gas demand has been relatively constant over the last five years. In 2020, Victoria consumed 220 PJ. By 2025,
       Victoria’s annual gas demand is forecast to decline 12.7% to around 191 PJ. The decline in consumption is due to
       uncertainties around renewable energy output, the existing Victorian Energy Upgrades (VEU) program to upgrade gas
       appliance efficiency, the end of gas production in some fields, the timing of proposed investments in new generation, and

OFFICIAL                                                                                 Gas Infrastructure Advice – Literature Review   8
variable gas prices (AEMO 2020b, AEMO 2021b). Monthly natural gas consumption fluctuates widely, and the average
       daily is about three times higher in winter than in summer. For example, during winter 2021, from June to August,
       maximum monthly system consumption is forecast to be over 25 PJ per month (PJ/m). During summer 2021, from
       December to February, natural gas consumption is forecast to be less than 10 PJ/m (AEMO 2021b).

       Victoria produced 361 PJ of natural gas in 2020 (see Table 5)1. Overall production from existing gas production facilities
       is forecast to decline by 43% from 2021 to 2025. In 2024, critical Gippsland gas fields and other smaller gas fields that
       supply the Longford gas plant are forecast to cease production. That is earlier than the forecast in the 2020 VGPR
       Update. Victoria can prevent the predicted gas shortfall from 2024 due to additional gas supply, mainly from gas import
       terminals in NSW (AEMO 2021b). In the past, Victoria could export more natural gas than import, making Victoria a net
       exporter over the average year. With anticipated investment in new import infrastructure, Victoria can prevent the gas
       supply shortfall from 2024, which was forecasted in VGPR 2020.
       Table 5: Forecast Victorian annual gas consumption and production, 2021-25, with 2019 and 2020 actuals (AEMO
       2020b, AEMO 2021b)

                                                      2019           2020           2021           2022           2023           2024            2025
                                                      (actual)       (actual)

           Total VIC available production in          343            361            360            341            287            261             205
           PJ
           Imports from NSW in PJ                     0              0              0              0              60             60              60
           Total VIC consumption in PJ                232            220            207            202            198            195             191
           Surplus quantity with VIC and              111            145            154            139            149            126             74
           NSW available supply in PJ

       In 2017, the Victorian Government imposed a moratorium on all onshore conventional gas exploration and development,
       the Resources Legislation Amendment (Fracking Ban) Act 2017. With the Constitution Amendment (Fracking Ban) Bill
       2020 the permanent ban on fracking and the enshrining of unconventional gas (coal seam and shale gas) in Victoria
       remains in place (Premier of Victoria, The Hon Daniel Andrews 2021).

       The restart of the onshore conventional gas sector is on track for 1 July 2021, after three years of detailed scientific
       investigations by the Victorian Gas Program (VGP). The Victorian Government’s geoscience agency undertook scientific,
       technical, environmental and social studies to assess the risks, benefits and impacts of new onshore conventional gas
       (Geological Survey of Victoria 2020). The VGP identifies potential new onshore conventional and offshore gas
       resources, as well as new underground gas storage. The geoscientific investigations conclude that there is likely to be
       128-830 PJ of commercially feasible onshore conventional gas yet to be discovered in Victoria.

       Potential locations include the Otway Basin in south-west Victoria and Gippsland in south-east Victoria. The VGP has
       also started to support commercial exploration of new offshore gas, with environmental controls in place to protect
       Victoria’s coastal areas. The exploration permit is the beginning of the offshore exploration process, including desktop
       research and modelling, and is expected to take several years. There is no guarantee that the exploration will produce
       new offshore gas fields (Geological Survey of Victoria 2020).
       The VGP states the production of these resources could help avoid a predicted gas shortfall. Further, new gas resources
       would generate around AUD $300 million annually for regional economies and create up to 6400 jobs. The VGP also
       states that this additional gas resource production would have a “negligible” impact on Victoria’s greenhouse gas
       emissions (Geological Survey of Victoria 2020).
       Several projects to improve the annual gas supply balance in the short-term have started to prevent the possible gas
       shortfall in Victoria. Projects include (AEMO 2021b):
               •    The anticipated development of two major gas fields that are processed through the Longford Gas Plant
                    increases the available gas supply until 2025.
               •    The potential construction of LNG terminals to import gas from Australian or international export facilities. The
                    AGL Crib Point project to the east of Melbourne just has been rejected due to environmental concerns (AGL
                    2021). The Viva project in Geelong and the Vopak project at Avalon, both to the west of Melbourne, is not
                    expected to be available until 2024.
               •    Proposed pipeline projects outside of Victoria can increase gas supply in the South-East gas market. Australian
                    Industrial Energy (AIE) committed to proceeding with constructing the 500 terajoules per day (TJ/d) Port

       1
           There is a discrepancy between DISER’s and AEMOs gas production capacities based on differences in acquired data and reporting time
             frame.

OFFICIAL                                                                                                      Gas Infrastructure Advice – Literature Review   9
Kembla LNG import terminal in NSW. Jemena committed to modifying the Eastern Gas Pipeline (EGP) to
                     enable reverse flow from Port Kembla into the Victorian DTS. AIE and Jemena will have completed these
                     projects ahead of winter 2023.
               •     Distributed gas supply of biogas and hydrogen does not produce significant quantities to prevent a gas shortfall
                     within the next five years' outlook period. Until 2025, distributed gas supply projects are expected to produce
                     less than 100 TJ per year. From 2025 to 2030, there is potential for this quantity to increase up to 4-5 PJ per
                     year.

       Gas transmission and distribution networks
       Victoria has a Declared Wholesale Gas Market (DWGM). Victoria has a significant natural gas distribution network and
       storage facilities to help meet demand peaks and significant interconnections with other states. Victoria’s gas networks
       comprise a transmission network owned by one market participant (APA) and three distribution businesses based on
       geographic regions (see Table 6). Victoria’s gas network extends over 30,000 kilometres and provides over two million
       end-users with gas. The gas infrastructure is valued at nearly AUD $6 billion, with network operators generating an
       annual revenue of nearly AUD $700 million and investing $345 million in 2019-20 (AER 2020).2
       Victoria’s net zero emissions targets coupled with falling costs of renewable energy could mean this immense gas
       infrastructure could become an underutilised or stranded asset long before the end of its useful life of 30 to 40 years
       (Global Energy Monitor 2020).
       Table 6: Victoria's gas networks in numbers (AER 2020)

           Network                   Type                      Customer              Length in            Asset base           Annual       Annual
                                                               numbers               km                   in $ million         investment revenue in $
                                                                                                                               in $ million million
           APA Victorian             Transmission              n/a                   1,992                1,074                50                109
           Transmission
           System
           AusNet Services           Distribution              710,000               11,650               1,727                99                175
           Multinet                  Distribution              687,000               9,866                1,321                82                176
           Australian Gas            Distribution              613,454               10,447               1,811                114               228
           Networks
           Total                                               2,010,454             33,955               5,933                345               688

       Figure 4 shows a map of the Victorian gas transmission network.

       The Victorian Declared Transmission System (DTS) supplies natural gas to households and business in Victoria. Gas is
       transported from Longford in Victoria’s east, via the Tasmanian gas pipeline, to and from Culcairn in Victoria’s north, via
       the NSW transmission pipeline, and to and from Port Campbell in Victoria’s west, via the SEA gas pipelines (AEMO
       2020b).

       2
           Investment and revenue are the annual averages for the current period using actual figures where available and forecast figures for the
              remaining years.

OFFICIAL                                                                                                          Gas Infrastructure Advice – Literature Review   10
Figure 4: The Victorian Declared Transmission System (AEMO 2021b)
Gas storage
Victoria is reliant on storage capacity during peak winter periods. Victoria has two facilities for storing gas, the Iona
Underground Gas Storage (UGS) in Port Campbell and the Dandenong LNG storage. The UGS reinjects gas into
depleted gas reservoirs, which can be withdrawn out a later point in time. Victorian storage capacity, mainly Iona UGS, is
needed to supply winter consumption. There is a risk that storage consumption will exceed the Iona UGS storage
reservoir capacity if forecasted winter consumption is higher, forecasted production is lower or there is not additional
supply from NSW (AEMO 2021b).
The declining Victorian production capacity during the outlook period is expected to reduce system resilience. Victoria
relies on the Dandenong LNG storage facility to provide fast response peak shaving gas supply to alleviate threats to
system security (AEMO 2021b). The Dandenong LNG storage facility provides the Victorian gas market with flexibility. It
mainly provides gas buyers options to manage gas supply and demand during production outages or emergencies, and
peak demand periods (AEMO 2020b).
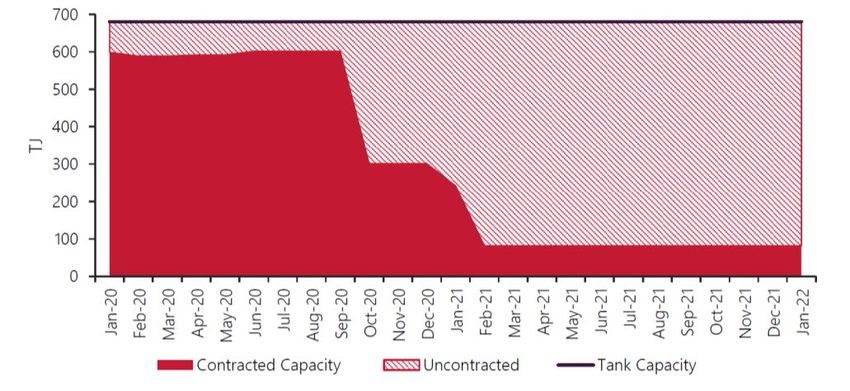
Dandenong LNG plays a vital role in managing intra-day gas system pressures in Victoria. After it reached a high
capacity in September 2020, storage levels fell to 443 terajoules on 31 December 2020 (see Figure 5). Capacity was at
its overall lowest level, outside of winter since the beginning of the Declared Wholesale Gas Market (DWGM) in winter
2007. The decrease is driven by lower levels of contracted gas and slowing demand (AEMO 2021).
Figure 5: Dandenong contracted and uncontracted LNG (AEMO 2021)
OFFICIAL Gas Infrastructure Advice – Literature Review 11Pipeline flows
As a gas exporter, Victoria has significant interconnections with other states. Although Victorian gas production slowed in
2020, Victorian net gas transfers to other states increased. Figure 6 shows an increased net gas flow to NSW of 5.3 PJ
in the fourth quarter of 2020 compared to Q4 2019. The increased gas flows are caused by higher gas demand in NSW,
which replaced gas supply from Queensland, and the Moomba – Sydney distribution pipeline to meet Queensland LNG
export demand (AEMO 2021).
Figure 6: Victorian net gas transfers to other regions (AEMO 2021)
Gas end-use
Table 7 gives an overview of Victorian natural gas consumption, including LPG end-use by sector. The residential,
manufacturing, electricity supply, and transport sectors accounted for nearly 90% of gas consumption in Victoria in
2018–19. Around 21% of Victorian natural gas consumption is needed for manufacturing mainly food, beverages, and
tobacco, but also non-metallic mineral products, paper, and textiles. Natural gas is also used to meet peak electricity
supply, with a share of 16.5%. The commercial and services sectors consume around 12.6% of natural gas. A small
amount of natural gas is consumed in the mining sector, where natural gas is needed for oil and gas extraction. The
transport sector consumes small quantities of LPG for road transport. The largest gas consumer in Victoria is the
residential sector with a share of around 39%.
Table 7: Victorian gas consumption by sector in 2018-19 (DISER 2020a)
Victorian gas consumption in 2018-2019
PJ Share
Agriculture 1.0 0.3%
Mining (oil & gas extraction) 19.8 6.6%
Manufacturing 62.1 20.7%
Electricity (and water & waste) services 49.6 16.5%
Construction 1.8 0.6%
Commercial and services 37.9 12.6%
Transport 12.1 4.0%
Residential 116.2 38.7%
Total 300.6 100%
Due to its colder climate, homes in Victoria use much more residential gas than other states. Table 8 shows how
Victorians use residential gas and how much of it is used in Australia. Natural gas is widely used in Australian homes for
cooking, space, and water heating. Gas cooktops are commonplace in Victoria but consume only 2% of the states’
residential gas use. Water heating consumes more natural gas than cooking, with a share of 24% of the Victorian
residential gas use. Space heating is the most extensive use of natural gas, with 74% in Victoria. As a result, Victorians
consume almost half of Australia's residential gas consumption only for heating. Where other states do not need heating,
have single-room gas wall furnaces, or use electric heating, Victoria is highly dependent on inefficient gas ducted heating
in all rooms (Grattan Institute 2020).
OFFICIAL Gas Infrastructure Advice – Literature Review 12Table 8: Victorian residential gas use (Grattan Institute 2020)
Cooking Space heating Water heating Other Total
appliances
Share of VIC residential 2 74 24 0 100
gas use, in %
Share of national 1 48 16 0 65
residential gas use, in %
Gas prices
In recent years, wholesale gas prices have significantly risen in eastern Australia, including the Victorian and
Queensland gas market. By 2018, wholesale gas prices rose from AUD $4 and AUD $6 per gigajoule to AUD $8 and
AUD $10 per gigajoule for new gas contracts. Whereas the eastern gas prices have risen, the Western Australian gas
price remained stable at around AUD $5 per gigajoule, see Figure 7 (Grattan Institute 2020).
Figure 7: Comparison of east coast and WA average gas prices (Grattan Institute 2020)
Domestic gas prices were pushed by increased demand for Australian LNG from a larger and higher-priced international
gas market, in particular Asia. Asian LNG prices soared to a new high of AUD $17.6 per gigajoule at the end of 2020 due
to a colder than usual winter in the northern hemisphere, train outages at several major LNG facilities, and shipping
disruptions. While prices on the east coast electricity and gas market have been highly correlated in recent years, they
diverged in the second half of 2020, with gas prices rising but electricity prices remaining low (AEMO 2021). To meet the
increased demand for natural gas, supply was increased by exploring more expensive gas sources, which further
pushed prices in the east coast market (Grattan Institute 2020).
High prices on Australia’s east coast, including Victoria, will increase risk and uncertainty for future energy costs and gas
supply forecasts (CSIRO 2018). Lower international prices could suppress domestic exploration and development
expenditure, reducing the longer-term gas supply outlook (AEMO 2020b).
2.1.2 Greenhouse gas emissions
The combustion of fossil fuels like oil, coal, and natural gas produces environmentally harmful greenhouse gases like
carbon dioxide and methane.
Emissions by state
The State and Territory Greenhouse Gas Inventories Report 2018 provides an overview of the latest available estimates
of greenhouse gas emissions for Australia (DISER 2020b). Victoria is the third-largest contributor to Australia’s total net
emissions (19%), behind Queensland (32%) and NSW (25%) in 2018. Between 2005 and 2018, Victoria’s total net
emissions fell by 17.5% to 102.2 mega tonnes (Mt) (equivalent in 2018).3 Victoria has the third-highest emission
reduction results after Tasmania (111%) and South Australia (31.6%), which have more ambitious climate and
renewable energy generation targets. Land-use changes and forestry have contributed to Tasmania achieving better
3
2005 is the reference year for Victoria’s emissions reduction target (Climate Change Act 2015)
OFFICIAL Gas Infrastructure Advice – Literature Review 13than net zero (negative). In Western Australia and the Northern Territory ,emissions have increased due to strong growth
in mining and exports, and increased transport emissions (DISER 2020b). Victorian emissions reductions are partly due
to increased renewable energy generation, as well as the closure of the coal-fired Hazelwood Power Station in March
2017 (DELWP 2018).
The Victorian Greenhouse Gas Emissions Report 2018 states that the emissions of the energy sector, which comprises
electricity generation (45.4%), direct combustion (17.4%), transport (22.9%), and fugitive emissions from fuels (3.8%),
produced in total 89.5% of Victoria’s total net emissions in 2018. Other emission contributors are agriculture (15.3%),
industrial processes and product use (3.8%), and waste (2.5%). Land use, land-use change, and forestry (LULUCF)
absorbed more emissions than it generated with, minus 11.2% of net emissions (DELWP 2018).
Figure 9: Direct combustion emissions by
Figure 8: Victorian emissions by sector and energy sub-sector in 2018
end-use in 2018 (DELWP 2018)
(DELWP 2018)
Natural gas emissions
Natural gas emissions are only reported by the Department of Industry, Science, Energy and Resources (DISER) and
the Department of Environment, Land, Water and Planning (DELWP) in the context of direct combustion and fugitive
emissions.
Fugitive emissions comprise greenhouse gas emissions from the extraction and distribution of coal, oil, and natural gas.
In 2018, total emissions from fugitive fuels were 54.4 Mt of carbon dioxide equivalent in Australia with a Victorian share
of 7.1% (or 3.9 Mt of carbon dioxide equivalent) (DISER 2020b).
Whereas natural gas has a small fraction of Victoria’s electricity generation, gas is the primary fuel used for direct
combustion, representing 62% of the total fuels used in 2018 (see Figure 9). Direct combustion emissions arise from
burning fossil fuels for generating heat, steam, or pressure for major industrial operations and burning gas for household
heating, hot water, and cooking. In 2018, Victoria consumed a total of 237 PJ of natural gas in direct combustion
activities, with the highest consumption in residential activities (38.7%), followed by manufacturing (20.7%) and
commercial (12.6%) activities. Almost 61% of fugitive emissions in Victoria arise from leakage of gases during the
exploration, production, transmission, storage, and distribution of natural gas. Most of Victoria’s remaining fugitive
emissions relate to flaring and venting associated with oil and natural gas production and processing (DELWP 2018).
About 19% of Australia’s total greenhouse gas emissions come from natural gas (see Figure 10). That is estimated to
consist of about 14% of total emissions from burning the gas and approximately a further 5% from fugitive emissions.
While natural gas combustion causes fewer emissions than coal, the amount of fugitive emissions is likely
underestimated, and the negative climate effect of natural gas might be even more significant (Grattan Institute 2019).
OFFICIAL Gas Infrastructure Advice – Literature Review 14Figure 10: Share of energy consumed and share of greenhouse gas emissions (Grattan Institute 2019) OFFICIAL Gas Infrastructure Advice – Literature Review 15
2.2      Decarbonisation technologies
       This section gives an overview of the three transformational technologies that may be able to be deployed to
       decarbonise the Victorian gas infrastructure. It also explores the risks and benefits of each technology.

       2.2.1 Need for decarbonisation
       Available modelling work in this space provides global and Australia-wide analysis. No Victoria-specific work has been
       identified.
       Economic recovery with decarbonisation
       The COVID-19 pandemic has caused great economic impacts globally. Many governments are creating stimulus
       packages to boost their economies and recognise decarbonisation as an opportunity to create new jobs and tackle
       emissions reduction.
       A 2020 McKinsey survey finds government spending on renewable energy like wind, solar, and bioenergy and energy
       efficiency (including industrial energy efficiency and smart grid), creates more jobs than spending on fossil fuels like oil,
       coal, and natural gas. A balanced low carbon stimulus portfolio of push and pull factors can also produce significant
       additional economic and environmental benefits. For example, on the regulation side in some jurisdictions, industrial
       emitters may be required to adopt carbon capture and storage (CCS) technologies (push). Therefore, funding in CCS
       infrastructure in industrial hubs is required (pull) (McKinsey & Company 2020). The survey provides a global overview.
       The conclusions are based on existing scientific studies released before the pandemic. There are no conclusions for the
       infrastructure of natural gas or zero emission gas.
       The Australian think-tank Beyond Zero Emissions refers to McKinsey’s study and delivers detailed conclusions for
       Australia. The Million Jobs Plan describes how Australian sectors such as renewable energy, buildings, transport, and
       manufacturing could generate more than one million new jobs, reversing the losses from COVID-19. It says Australia
       could quickly become a world leader in the production of hydrogen, ammonia, steel, aluminium, and other metals using
       100% renewable energy, creating 230,000 jobs. The analysis was carried out using a macro-econometric model (Beyond
       Zero Emission 2020). No further information on the methodology or the analysis approach is provided.
       Another Australian think-tank, the Climate Council, comes to a similar conclusion. Its Clean Jobs Plan, modelled by
       Alphabeta, offers 12 policy opportunities to stimulate a low-emission economy and create 76,000 jobs over the next three
       years for resilient long-term recovery and zero emissions in Australia. In Victoria, the plan would create an estimated
       15,000 – 20,000 jobs in the short-term. Major job creators include installing utility-scale renewable energy (3,000 –
       4,000) and organic waste management (2,000 – 2,500). It finds green hydrogen and electric vehicle (EV) charging
       networks have an insignificant influence on job creation in the short-term. Alphabeta applied a detailed methodology
       including the review of existing international policies, assessed against key selection criteria, and evaluated by experts
       from both policy and industry. Detailed economic analysis using data from the Australian Bureau of Statistics was
       conducted to estimate potential jobs impacts (Climate Council 2020a).
       Global climate risk natural gas
       The most compelling reason to decarbonise energy and gas infrastructure is the climate risks from carbon and methane
       emissions. The challenge for the gas industry is to restructure itself for an emission-free energy future.
       The International Energy Agency (IEA) provides a yearly update in its World Energy Outlook. Detailed scenario analysis
       provides an outlook of future energy use, emissions and their implications for investment and policy. The report finds that
       while natural gas has a better global outlook than oil and coal, there remain “crucial” uncertainties around the methane
       emissions from gas technologies. It finds methane abatement can be reached via alternative gases such as biomethane
       and low carbon hydrogen (see detailed description in section 2.2.3 Hydrogen) and technologies like carbon capture,
       utilisation and storage (CCUS), which need rapid innovation and deployment in the 2020s (IEA 2020c). The IEA is an
       autonomous intergovernmental organisation established in the framework of the OECD.
       The Institute for Energy Studies at the University of Oxford highlights the need for the gas community to reach the
       COP21 targets. Therefore, the gas industry needs to develop decarbonisation technologies including size and timing of
       developing commercial-scale projects for biogas, biomethane, and hydrogen from power to gas (electrolysis). It finds
       that, since there are uncertainties around fugitive emissions for the production and transport of natural gas, pathways
       that extend the use - like reforming methane to produce hydrogen - must be avoided.
       To preserve gas decarbonisation options and enable a future low carbon gas sector, a 'regulatory revolution' is
       necessary, which needs government funding and substantial corporate investment (University of Oxford 2019). The
       report assumes that the future gas industry will maintain current natural gas demand levels. Alternative pathways like
       electrification are regarded as unsatisfactory because of the stranding risk of substantial gas network assets. The Oxford
       Institute for Energy Studies Natural Gas Research Programme is sponsored by private sector organisations including
       members of the gas industry. The report is peer reviewed.

OFFICIAL                                                                                   Gas Infrastructure Advice – Literature Review   16
Meanwhile, not-for-profit group the Global Energy Monitor describes the risks of the global LNG infrastructure becoming
underutilised or stranded assets before their end of life of 30 to 40 years. One reason is the pandemic-related decline of
global oil and gas demand could lead to a high default rate on planned LNG export terminal projects. It says another
reason natural gas should only be viewed as a "bridge fuel" is its impact on climate change, and that fugitive emissions
have been underestimated. It suggests extending fossil combustion and switching from coal to gas does not offer a
valuable strategy to achieve zero emissions. Emissions from LNG, including recent estimates of methane leakage
throughout the system, are 29% lower to 16% higher than coal-fired power (Global Energy Monitor 2020). The correct
estimation of fugitive emissions remains questionable. The Global Energy Monitor receives funding from primarily
environmental organisations. Data is attributed to a source and transparent, and conclusions focus on the achievement
of ecological and social goals.
Local climate risk natural gas
Australian think-tank ClimateWorks discusses the challenges and opportunities in reshaping transport, energy, water,
communications, and waste infrastructure for a net zero emissions future. Combined, these sectors generate around
70% of Australia’s greenhouse gas emissions. Emissions from natural gas contribute a share of 12.7%, mainly caused
by operating gas networks and fugitive emissions. The contribution of fugitive emissions is uncertain (ClimateWorks
2020b).
ClimateWorks suggest emissions reduction strategies should be developed that do not attempt to predict the future but
offer greater certainty, as well as minimise risks in public and private investment decisions. For example, if natural gas is
replaced by electricity in the residential sector, the value of gas networks’ is reduced and run the risk of becoming
stranded assets, unless they are adapted to supply zero emission gas. To reduce these risks, a broad range of scenarios
should be explored (ClimateWorks 2020b).
The Climate Council’s Passing Gas report gives a detailed overview of Australia's gas market. The report concludes that
natural gas emissions are under-reported in Australia. Further, extracting and burning natural gas will escalate
Australia’s climate risk and miss global climate change targets. Australia’s dependency on export and decreasing
international gas market prices shows Australia is further exposed to job losses and energy price volatility. The report
finds Australia can transition to a 100% renewable electricity supply supported by a mix of battery storage and demand-
side solutions (Climate Council 2020b) and that new gas infrastructure is not needed. However, solutions for hard-to-
abate gas industries and consumers, the risks of stranded assets, nor re-purposing the gas networks with zero emission
fuels are not discussed.
The Grattan Institute gives an overview of natural gas production, prices, policies, and possible net zero emissions
pathways in Australia, including specific recommendations for action. The Grattan Institute discuss multiple factors that
could be included in future energy scenarios or pathways to lower emissions. For example, in the Grattan scenario,
natural gas as a “backstop” is not a baseload power source but a flexible power source during demand peaks and
persistent periods of low wind and sun. Also, it states the use of natural gas for residential heating must decline,
particularly in Victoria. Grattan acknowledges that favouring electricity over gas is cost intensive through the inclusion of
new appliance costs and connection upgrades. Therefore, low-emissions gas supply like biomethane and hydrogen need
to be developed and applied in the long-term, requiring clear policy signals and commitment. The report concludes the
priority now is to better understand the technical and economic viability of low-emissions gas substitutes (Grattan
Institute 2020).
2.2.2 Australian decarbonisation pathways
Some research has been done on decarbonisation pathways for Australian gas infrastructure. Most of the work focuses
on cost benefits analysis of different scenarios in 2050. Work funded by Energy Networks Australia, the peak body for
Australia’s gas distribution networks is considered to present results in the interests of the gas sector. However, the
pathways deliver helpful insights and will be further analysed in the section Analysis of decarbonisation pathways.
ClimateWorks’ Decarbonisation Futures report (2020) models least-cost and feasible decarbonisation pathways for
Australia. It finds that Australia can achieve net zero emissions by 2050 and live within its recommended carbon budget,
using technologies that exist today, while maintaining economic prosperity. Decarbonisation is based on an ambitious
program of energy efficiency, low carbon electricity, electrification, fuel switching and reducing non-energy emissions in
industry and agriculture. Natural gas is replaced, eliminated, or emissions are captured.
For example, electricity generation switches to low carbon energy sources such as renewable energy technologies or
CCS. For residential use, natural gas switches to a decarbonised electricity supply. For the transport sector, electric
batteries and hydrogen fuel-cells for cars and light commercial vehicles are used. However, natural gas is used in place
of oil extensively for road freight. Emissions from natural gas use in industry and agriculture are captured via CCS or
offset with carbon forestry (ClimateWorks Australia 2020a).
Energy Networks Australia’s (ENA) Gas Vision 2050 also provides an overview of the current gas industry, market, and
technologies. The ENA presents a vision for net zero gas use in homes, cities, industrial uses, and power generation.
Options to reduce natural gas emissions include energy efficiency, decarbonisation of fuel (including hydrogen and
biomethane), electrification of heat and carbon offsets. It includes analysis by Frontier Economics which includes a
OFFICIAL Gas Infrastructure Advice – Literature Review 17scenario analysis of decarbonised fuel options and their projected costs. It finds net zero emissions can be reached with
hydrogen at half the cost of electrification when Australia’s existing gas infrastructure and natural gas resources are used
(Energy Networks Australia 2019).
ENA engaged both Frontier Economics and Deloitte Access Economics to model net zero emissions scenarios plus
projected costs. The Frontier Economics modelling includes electrification, renewable fuels with green hydrogen, and
zero-carbon fuel with blue hydrogen. It finds each of the three scenarios can reach net zero emissions but will entail
additional costs. The modelling finds renewable fuels and the zero-carbon fuels scenarios have lower costs than the
electrification scenario, suggesting that there is value in continuing to make use of Australia’s gas network and resources
(Frontier Economics 2020b).
Deloitte Access Economics analyses the decarbonisation of gas distribution networks using biogas, hydrogen, and CSS
to deliver zero carbon energy. The analysis suggests a variety of decarbonised gas options that are likely to be cost
competitive with electrification over the long-term (Deloitte Access Economics 2017).
The Australian Gas Infrastructure Group (AGIG) also worked with Deloitte to analyse converting to hydrogen as
Victoria’s decarbonisation pathway. Two scenarios relevant only to the energy sector are compared: full electrification
and the hydrogen conversion case, in the energy sector only. The cost analysis concludes that the use of hydrogen is
40% less expensive than the complete electrification of the gas infrastructure for energy generation in Victoria (AGIG
2018).
2.2.3 Hydrogen
Many of the identified publications in this literature review deal with hydrogen only. Therefore, technical details are briefly
explained to better understand hydrogen applications.
Technical Details
Hydrogen (H2) is the most common chemical in the universe. Hydrogen is a colourless, odorless, highly combustible
gas. If hydrogen burns with oxygen, it forms water (H2O) (J.P. Morgan 2020).
Hydrogen use
Hydrogen can be used as both an energy supply and an industrial feedstock for chemical production, and could
contribute to greenhouse gas emission reduction, depending on how it is produced. The use of hydrogen rather than
natural gas depends on the (mainly costs) competitiveness of alternative technologies (CSIRO 2018).
Hydrogen production
Hydrogen can be produced from water in three different processes, see Figure 11.
Figure 11: Production pathways for clean hydrogen (COAG Energy Council 2019)
Figure 11 and Table 9 give an overview of hydrogen production methods and their carbon credentials. The colour
attributes help to describe the emission intensity of the used input fuels. However, hydrogen is a colourless and
odourless gas.
OFFICIAL Gas Infrastructure Advice – Literature Review 18Table 9: Production methods of hydrogen and its attributed colours (J.P. Morgan 2020)
Hydrogen Production method Input fuel to produce Carbon credentials
‘colour’ hydrogen
Brown Coal gasification (CG) Brown or black coal Very high process emission,
very high total emissions
Grey Steam methane reforming Natural gas High process emission, high
(SMR) total emissions
Blue/ clean CG/SMR + CCS Coal or natural gas with carbon Moderate process emission,
offsets moderate total emissions
Turquoise/ Molten Metal Pyrolysis of Natural gas Low/zero process emission,
clean Methane moderate to high total emissions
Green/ clean/ Electrolysis of water Renewable energy (wind, solar, Zero process emission,
renewable hydro) moderate total emissions
A) Brown Hydrogen (using coal gasification): Gasification is a thermochemical process using brown or black coal to
produce hydrogen. The fossil fuel coal produces CO2 emissions that are commonly not captured and stored via CCS. If
hydrogen is produced by coal, it is often referred to as “brown hydrogen” (J.P. Morgan 2020) (Deloitte 2019).
Currently, gasification with SMR is the most common process to produce hydrogen. Gasification already has a high
technical maturity and produces hydrogen at low cost. However, future cost reductions are limited as there is little scope
for further process efficiency (CSIRO 2018). Producing brown hydrogen is also emissions intensive and requires
substantial CCS capacities to produce emission-free hydrogen, which must be factored when considering overall
emission reduction targets (J.P. Morgan 2020).
B) Grey or Blue Hydrogen (using steam methane reforming): SMR is a thermochemical process using natural gas
and pressured steam to produce a blend of CO2 and hydrogen. CO2 emissions must be captured and stored via CCS for
the hydrogen to be considered low or zero emissions. If hydrogen is produced by natural gas without CCS, it is referred
as “grey hydrogen”. If it is produced using natural gas and CCS, it is often referred as “blue hydrogen” (J.P. Morgan
2020) (Deloitte 2019). Blue hydrogen using fossil fuels with carbon offsets with CCS is also sometimes referred to as
“clean hydrogen”, “low emission hydrogen” or “CCS hydrogen”.
Currently, SMR is, along with gasification, the most common process used to produce hydrogen. SMR already has a
high technical maturity and produces hydrogen at low cost. However, future cost reductions are limited as there is little
scope to improve process efficiency (CSIRO 2018). Grey hydrogen (without CCS) is a highly polluting production method
that conflicts with emission reduction targets. Blue hydrogen that uses CCS still results in some emissions, but these are
considered negligible. Blue hydrogen using CCS may be a possible pathway to replace natural gas, using existing gas
infrastructure while producing only moderate emissions but there are still significant uncertainties about the economic
feasibility of this at scale. (J.P. Morgan 2020).
The Hydrogen Council also lists Autothermal Reforming (ATR) which uses oxygen and natural gas to produce hydrogen.
This process can more easily capture carbon emissions but remains unproven at scale (Hydrogen Council 2020).
C) Green Hydrogen (using electrolysis): The electrolysis process extracts hydrogen from water using electricity. If
renewable electricity like wind or solar energy is used, hydrogen is often referred to as “green hydrogen” (J.P. Morgan
2020) or “renewable hydrogen” (COAG Energy Council 2019). Using renewable electricity, electrolysis produces no
emissions. However, if fossil fuel-based electricity is used (such as in Victoria), the hydrogen is technically referred to as
blue or brown hydrogen. In order to qualify as green hydrogen, equivalent emissions for the electricity generated must be
captured and stored via CCS (J.P. Morgan 2020). As with blue hydrogen, green hydrogen is sometimes referred to as
"clean hydrogen" or "low-emission hydrogen".
The most promising production methods include the Polymer Electrolyte Membrane (PEM) and the Alkaline Electrolysis
(AE). However, electrolysis is still an emerging technology, characterised by low maturity, and process inefficiencies with
high energy requirements (CSIRO 2018). Currently, it is very costly to produce hydrogen with electrolysis. However,
depending on the investment level in research and development, electrolysis has the highest efficiency growth potential
to produce low cost, zero emissions hydrogen in the future. Green hydrogen may be a possible pathway to replace
natural gas, using upgraded existing gas infrastructure without causing emissions (J.P. Morgan 2020).
OFFICIAL Gas Infrastructure Advice – Literature Review 19You can also read