London Borough of Southwark: Dulwich Streetspace Monitoring - Champion Hill, East Dulwich and Dulwich Village: April 2021
←
→
Page content transcription
If your browser does not render page correctly, please read the page content below
London Borough of
Southwark:
Dulwich Streetspace
Monitoring

Champion Hill, East Dulwich and
Dulwich Village: April 2021
Executive
                                   Summary

LA CONFIANCE TRANSPORTE LE MONDE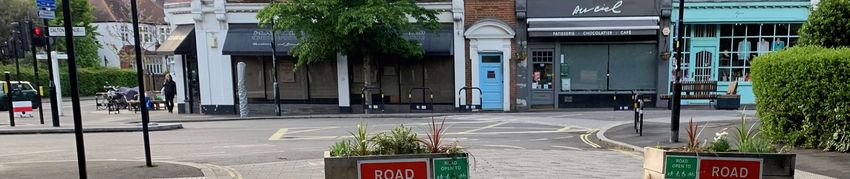
Executive Summary (1)
This April interim monitoring report presents the results of data collected on the impact of the Streetspace trials
installed in Dulwich Village and East Dulwich in 2020, and Champion Hill in 2019.
Results should be considered in the context of overall traffic levels being down -12% across Southwark
between April 2021 and April 2019.
For streets where data was collected both pre-implementation and in April 2021, the following impacts have
been observed:
The volume of motor traffic counted on internal streets had decreased by -31% around Dulwich Village,
and -79% in East Dulwich.
The volume of motor traffic counted on external streets had decreased by -11% around Dulwich Village
and –3% around Champion Hill, but increased by +2% around East Dulwich.
The volume of cycles on internal streets had increased by +103% around Dulwich Village, and +29% in East
Dulwich and +19% on Champion Hill.
The volume of cycles on external streets had also increased by between +43% to +70%.
The overall volume of motor traffic recorded across all streets has decreased by -16%
Data from Vivacity Sensors shows increases in the number of cycles counted of +126%, +48% +86%, +69% and
+292% on Calton Avenue, Townley Road, Burbage Road, Melbourne Grove and Champion Hill respectively.
3
Executive Summary (2) The streets on which analysis has been completed are shown to the right, along with areas defined as Dulwich Village, East Dulwich or Champion Hill. It should be noted that the proximity of the three areas means each will be impacting the others, so the traffic impacts on external streets without restrictions should not be associated to a single measure. The streets marked are those on which data has been collected and reported on. The measures implemented are either permanent permeable road closures that do not permit through motor traffic, or timed restrictions that permit cycles, buses and taxis only in one direction during peak hours. Streets where measures implemented restrict or prevent through traffic are defined as internal, whilst those with no change has been made to throughflow are defined as external. 4

Executive Summary (3)
The total number of cars/LGVs, cycles and all motor traffic recorded on streets where a
traffic count was completed in the same location both prior to the impact of COVID-19 and in
April 2021 is shown below. Details of further data collected in other months are provided
within the main report. Results should be considered in the context of overall traffic levels
being down -12% across Southwark between April 2021 and April 2019.
Cars/LGVS All Motor Traffic* Cycles
Post – % Change Post – % Change Post – % Change
April April April April April April
Pre 2021 Change 2021 Pre 2021 Change 2021 Pre 2021 Change 2021
Dulwich
Internal 40,781 27,236 -13,545 -33% 43,128 29,841 -13,287 -31% 2,237 4,531 2,293 103%
Dulwich Village
External 52,774 46,913 -5,861 -11% 57,222 51,062 -6,160 -11% 788 1,338 551 70%
Internal 5,082 962 -4,120 -81% 5,610 1,168 -4,442 -79% 203 262 59 29%
East
External 24,608 25,081 473 2% 26,965 27,427 462 2% 744 1,078 333 45%
Champion
Internal 3,332 3,633 301 9% 3,694 4,070 376 10% 417 496 79 19%
Hill
External
10,216 10,185 -31 0% 11,728 11,429 -300 -3% 215 307 92 43%
All Counts 136,793 114,010 -22,783 -17% 148,347 124,997 -23,349 -16% 4,604 8,012 3,408 74%
5 *Includes car, LGV, HGV and motorcycle, but not pedal cycle
About SYSTRA

LA CONFIANCE TRANSPORTE LE MONDE

Introducing SYSTRA SYSTRA is a global leader in mass transportation and mobility, employing over 7,000 global employees across 80 countries. SYSTRA has the unique advantage of being not only a Transport Consultancy, but also Social and Market Research Consultancy. Our team members have an in-depth understanding of both the transport sector and of social and market research techniques, providing expert support in monitoring and evaluation both direct to clients and also in a peer review capacity. We provide a wealth of experience in conducting both qualitative and quantitative transport research with stakeholders to help understand their priorities and to inform options for future investment and policy development. 7

Introduction

LA CONFIANCE TRANSPORTE LE MONDE

Introduction
This report sets out the April interim monitoring
results on the impact of the trial measures
implemented by the London Borough of Southwark
in Dulwich, as part of their Streetspace programme
responding to the COVID-19 pandemic.
All results are shown as comparisons to pre-
implementation data collected primarily in 2019.
It covers the measures introduced across Dulwich,
formed of three Streetspace schemes:
Champion Hill
East Dulwich
Dulwich Village
The measures implemented are shown on the map
on the right.
9
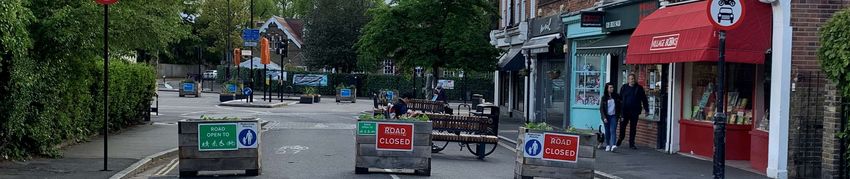
Champion Hill Scheme A permeable road closure on Champion Hill was installed in February 2019, preventing motor vehicles from using Champion Hill to drive from Dog Kennel Hill to Denmark Hill. The aim of the scheme was to reduce traffic volumes to support the delivery of Quietway 7, which runs north-south along the length of the Borough. In early 2020, the Council consulted on making the vehicular No-Entry permanent, but as part of the COVID-19 transport response the Experimental Traffic Order for the scheme was extended an additional 18 months. 10
East Dulwich Scheme The East Dulwich scheme was delivered in two phases: Phase 1: permeable road closure on Melbourne Grove, south of Tell Grove. Implemented on 30th June 2020. Phase 2: permeable road closures on Melbourne Grove, Derwent Grove, Elsie Road and Tintagel Crescent at the junction with Grove Vale, and a school street closure during school drop-off and pick-up on Tintagel Crescent and Elsie Road. Implemented on 4th September 2020. Existing measures that will also affect traffic flow in the area include: Right turn ban from Grove Hill Road into Grove Lane. Right turn ban from East Dulwich Grove to Lordship Lane. One way on Matham Grove and Oxonian Street. 11
Dulwich Village Scheme The Dulwich Village scheme was delivered in two phases: Phase 1: Court Lane, Calton Avenue and Dulwich Village modal filter. Implemented on the 30th June 2020. Phase 2: camera enforced timed restrictions (from 8- 10am and 3-6pm on weekdays) of motor traffic travelling northbound on Burbage Road, Dulwich Village and Townley Road and eastbound on Turney Road. Buses, taxis and cycles are exempt from the timed restrictions. Phase 2 was implemented on the 16th November 2020, but not enforced until January 2021. A right turn ban from A205/Thurlow Park Road to Croxted Road was already in place. 12
Monitoring Study

LA CONFIANCE TRANSPORTE LE MONDE
Monitoring Programme
SYSTRA has been commissioned by LB Southwark to produce an independent monitoring
report on the impact of the Streetspace schemes, analysing a range of data collected by the
Council largely between 2019 and 2021.
Traffic data has been collected on various roads, both within and on the edge of the scheme
areas via Automatic Traffic Counters (ATCs), with a mixture of weeklong samples and
continuous collection, providing cycle and motor vehicles flows, and average speeds. Bus
journey time data from TfL has also been analysed, along with data from Active Travel
Monitors, which record and classify all road users.
Two reports will be produced for the monitoring:
Report 1: first interim report, using data collected to the end of April 2021.
Report 2: monitoring update using data to the end of June 2021.
14Data Collection 22 Automatic Traffic Count (ATC) locations have been utilised to analyse the impact of the three schemes on traffic flows. These locations are shown to the right. LB Southwark has also collected data in additional locations, but only sites where counts were completed both pre- and post- implementation of the Streetspace measures have been included in the analysis. The majority of ATC sites were in place in September 2019, September 2020 and March/April 2021, however some count data used within this report dates from earlier periods. Data was not collected at all locations in all time periods. The shaded areas indicate the broad area affected by each of the Streetspace schemes, but it is noted that they are strongly interlinked and therefore share scheme impacts. A complete summary of the all data collected is shown in the appendices. In addition to the traffic data, data has also been analysed with respect to bus journey times and road user types, the latter as recorded by Active Movement Sensors. 15
COVID-19
                                   Impacts on Traffic
                                   Flows

LA CONFIANCE TRANSPORTE LE MONDE
Impact of COVID-19 on Vehicular Traffic
Since the onset of the pandemic, people’s travel behaviour has changed significantly, with the majority making
far fewer trips, particularly during national lockdowns. This has led to reductions in vehicle traffic throughout
London, as can be seen in the chart below, which compares traffic volumes in Southwark and that of five south
London Boroughs (excluding Central London) against traffic volumes for the same areas in April 2019, according
to continuous traffic counts collected by TfL.
Difference in Traffic Volume Against Apr-19 Traffic has been consistently lower than pre-pandemic,
with particularly pronounced drops during lockdowns,
110%
and patterns in Southwark very similar to the wider
South London areas. Results for most motor vehicle
100% flows presented in this report should therefore be
considered in this context.
90%
The difference between total vehicle volumes in April
2021 vs. April 2019 is presented in the table below for
80%
each area.
70% Difference April
Area
2021 to April 2019
60% Southwark -11.6%
Southwark
Southwark, Lambeth, Lewisham, Wandsworth, Greenwich* Southwark, Lambeth, Lewisham,
-12.8%
50% Wandsworth, Greenwich*
17 *Excluding Central LondonImpact of COVID-19 on Cycle Flows
As with motor traffic volumes, the number of people cycling has also been affected by the pandemic. The
Department for Transport’s Road Traffic Statistics estimate a 38% increase in cycling in London in 2020,
relative to the average for 2017-2019. Other estimates include:
a 35% increase in London from 2019 to 2020 among Strava users;
a 7% increase in Inner London and a 22% increase in Outer London from 2019 to 2020 as measured by
the company Eco-Counter.
The chart below shows the volume of cycle trips compared to a pre-COVID, March 2020 baseline across
England1. A large increase is shown in 2020, although levels appear to have reverted to below or similar to
pre-COVID levels in the latter part of the year and in 2021. This will partly be related to the weather, given
the comparison to March.
All differences in cycle flows throughout
Cycle Volumes in England Compared to National March
reporting should be considered in the
Baseline
context of the above observations.
250%
200%
150%
100%
50%
0%
18 1https://www.gov.uk/government/statistics/transport-use-during-the-coronavirus-covid-19-pandemicImpact of COVID-19 on Bus Journey Times
Bus journey times will also have been affected by the pandemic, with lower traffic volumes
leading to decreased journey times. The chart below illustrates average bus speeds in
Southwark across the course of 2020-21 against the average speed for the year pre-
lockdown1.
As can be seen, speeds significantly increased in the first lockdown, and have not yet returned
to pre-COVID levels. It could therefore be expected that in the absence of any other changes,
bus speeds in Dulwich would have followed similar patterns.
13
12
Speed - mph
11
10
9
8
7
6
Period Commencing
London pre-COVID Average London Southwark pre-COVID Average Southwark
19 1https://tfl.gov.uk/corporate/publications-and-reports/buses-performance-dataPre-
Implementation
Flows
LA CONFIANCE TRANSPORTE LE MONDEPre-Implementation Flows Pre-implementation flow data was collected across a range of months since late 2017. To provide consistency, all pre-implementation motor vehicle data (including for Burbage Road and Court Lane, where the only data available is from June 2020) has been adjusted to April 2019 levels for a fairer basis of comparison. This also takes into account both April 2019 and April 2021 having contained the Easter holidays, comprising two school holiday weeks. This adjustment has been conducted based on differences in background traffic flows captured by TfL counters between the month of data capture and April 2019. These TfL counters have been operating continuously for many years, and for Dulwich, the adjustment has been made using all counters in Southwark, Lambeth, Lewisham, Wandsworth and Greenwich, excluding Central London. 21
Pre-Implementation Flows – Cars/LGVs
The average total daily pre-implementation flows
of cars and LGVs* (combined) are presented in the
map to the right, showing the general trend of
traffic within and surrounding the three schemes.
The highest flows are recorded on peripheral roads
such as Half Moon Lane, Grove Lane, East Dulwich
Grove (South), Lordship Lane and Dulwich Village,
all of which carry over 10,000 vehicles per day.
Vehicle flows are also high (exceeding 4,000
vehicles per day) along Turney Road, Calton
Avenue and Croxted Road.
Smaller residential roads generally record lower
vehicular flows (below 3,000 vehicles per day).
Basemap: Stamen
22 *Light Goods Vehicle (i.e. delivery vans or similar)Pre-Implementation Flows – Cycles
The maps to the right shows the average total daily
pre-implementation flows of cycles.
The highest flows recorded are on Half Moon Lane
(611 average cycles per day) and on Townley Road
(506 average cycles per day).
Cycle flows on roads leading to Dulwich Village are
between 250 and 350 cycles per day.
Basemap: Stamen
23 *Lordship Lane not a full day, data collected 0700-0900, 1300-1900 onlyPre-Implementation Flows – HGV
The average total daily pre-implementation flows
of HGVs are shown in the map to the right.
HGV flows are high on main roads surrounding the
scheme areas, with the highest volumes recorded
on Croxted Road (1,142 average vehicles per day)
and along Grove Vale and Grove Lane (1,116 and
1,133 average daily vehicles, respectively).
Lordship Lane, East Dulwich Grove and Dulwich
Village all have flows of at least 400 HGVs per day.
Flows are lower on internal roads (below 150
vehicles on average) and very low on minor
residential roads (below 100 vehicles).
Basemap: Stamen
24 *Lordship Lane not a full day, data collected 0700-0900, 1300-1900 onlyPost-
Implementation
Monitoring
Round 3/April
2021
LA CONFIANCE TRANSPORTE LE MONDEApril 2021 Flow Change – Cars/LGVs
Basemap: Stamen
The map to the right outlines changes in counts of cars and
LGVs (combined) compared to pre-implementation, at sites
where data has been collected in April 2021.
Increases in flows have been observed on East Dulwich
Grove, Burbage Road, Zenoria Street and Dovercourt Road,
the largest of these being +27% on East Dulwich Grove
(East). These increases are higher than those recorded in
March 2020 at the same sites.
The decreases in flows on internal roads remain similar to the
those recorded in March 2021.
Lordship Lane has recorded a higher decrease in flows than in
March 2021 (-24% compared to -16% in March).
Note that overall traffic levels in Southwark were down
12% in April 2021 vs. April 2019. NB. Position of ATC at Melbourne Grove South and Townley Road moved compared to previous
counts.
26April 2021 Flow Change – Cycles Basemap: Stamen
The map to the right outlines changes in cycles counted
compared to pre-implementation, at sites where data
has been collected in April 2021.
Most sites have seen an increase in cycling, with the
largest being a 231% increase on Calton Avenue. Other
sites around Dulwich Village have also seen large
increases in cycle counts, such as on Eynella Road
(+136%) and Dulwich Village (+130%).
A higher increase in flows compared to March 2021 has
also been recorded on boundary roads, such as on
Croxted Road (+91%), Grove Lane (+43%) and Grove
Vale (+35%).
NB. Position of ATC at Melbourne Grove South and Townley Road moved compared to September 2019 and 2020 counts. These are likely to have affected cycle counts more so than motor vehicles, the former are therefore not shown.
Court Lane East and Burbage Road North, comparison is to June 2020 rather than data collected pre-COVID, meaning likely smaller comparative increase.
27 *Some sites excluded due to ATC appearing to have lost some or all cycle dataVivacity Data Analysis – Cycle Flows
Basemap: Stamen
Vivacity Data is recorded through sensors that are able to recognise and
differentiate between road users. LB Southwark has placed Vivacity
Sensors in key junctions around the Streetspace schemes since
implementation. Where data has been collected at the same location prior
to implementation, a comparison has been made.
Vivacity Data collected in March and April 2021 has been compared to
counts of the numbers of people cycling made in September 2019, either
via manual counts or an ATC. The results are shown below*.
September
Site 2019 March 2021 Change April 2021 Change
Calton Avenue / Dulwich
923 2,146 +133% 2,083
Village +126%
Townley Road 1,003 1,367 +36% 1,488 +48%
Champion Hill 41 139 +239% 161 +292%
Burbage Road 460 855 +86% 857 +86%
Melbourne Grove 178 243 +37% 300 +69%
All sites have shown increases in the number of people counted cycling between pre- and post-implementation
of the Streetspace schemes. These increases are beyond what may have been expected as a result of
seasonality or COVID-19 alone.
28 *Average total number of cycles recorded 7AM – 7PM, School Term Time Weeks Compared OnlyApril 2021 Flow Change– HGV Basemap: Stamen
The map to the right outlines changes in counts of HGVs
compared to pre-implementation, at sites where data has been
collected in April 2021.
HGV flows have increased at many sites, with the largest
increases recorded on Townley Road West (+48%), Half Moon
Lane and Dovercourt Road (both +39%). These increases are
equal or lower than those recorded in March 2021 at the same
sites.
Some boundary roads where flows had increased in March 2021
recorded a decrease in flows, such as Grove Vale (-23%) and East
Dulwich Grove South (-19%)
It should be noted, that on a national basis, whilst car traffic was
at 84% of pre-COVID levels in April 2021, HGV traffic was
exceeding pre-COVID volumes1.
NB. Position of ATC at Melbourne Grove South and Townley Road moved compared to previous
counts.
29 1https://www.gov.uk/government/statistics/transport-use-during-the-coronavirus-covid-19-pandemicPost-
Implementation
Monitoring
Round 2/March
2021
LA CONFIANCE TRANSPORTE LE MONDEMarch 2021 Flow Change – Cars/LGVs Basemap: Stamen
The map to the right outlines changes in counts of cars and
LGVs (combined) compared to pre-implementation at sites
where data has been collected in March 2021. This is after the
implementation of the Dulwich Village timed restrictions.
Flows have decreased at nearly all sites where restrictions were
in place, with the largest reductions on Calton Avenue (-85%)
and Melbourne Grove North (-91%).
Increases in flows have been observed on Burbage Road (+4%)
and East Dulwich Grove East (+15%). These increases are lower
than those recorded in September 2020 at the same sites.
Note that overall traffic levels in Southwark were down 12% in
March 2021 vs. April 2019.
NB. Position of ATC at Melbourne Grove South and Townley Road moved compared to
September 2019 and 2020 counts.
31March 2021 Flow Change – Cycles Basemap: Stamen
The map to the right outlines changes in counts of cycles
compared to pre-implementation at sites where data has been
collected in March 2021. This is after the implementation of the
Dulwich Village timed restrictions.
Most sites have seen an increase in cycling, with the largest
being a +177% increase on Calton Avenue. Other sites around
Dulwich Village have also seen large increases in cycle counts,
namely Eynella Road (+104%) and Dulwich Village (+109%).
Increases in cycle numbers are generally lower around Champion
Hill and on boundary roads such as East Dulwich Grove and
Croxted Road.
It should be noted that, nationally, cycle numbers in March 2021
had reverted to close to pre-COVID levels.
NB. Position of ATC at Melbourne Grove South and Townley Road moved compared to September 2019 and 2020 counts. These are likely to have affected cycle counts more so than motor vehicles, the former are therefore not shown.
Court Lane East and Burbage Road North, comparison is to June 2020 rather than data collected pre-COVID, likely explaining smaller comparative increase.
32 *Some sites excluded due to ATC appearing to have lost some or all cycle dataMarch 2021 Flow Change– HGV Basemap: Stamen
The map to the right outlines changes in counts of HGVs
compared to pre-implementation at sites where data has
been collected in March 2021. This is after the
implementation of the Dulwich Village timed restrictions.
HGV flows have increased at many sites, with the largest
increases recorded on Half Moon Lane (+56%) and Grove
Vale (+50%). Increases have also been observed on
Burbage Road, Dulwich Village and Turney Road.
Melbourne Grove, Court Lane and Calton Avenue have all
seen decreases in flows.
It should be noted, that on a national basis, whilst car
traffic was at 70% of pre-COVID levels in March 2021,
HGV traffic was exceeding pre-COVID volumes1.
NB. Position of ATC at Melbourne Grove South and Townley Road moved compared to September
2019 and 2020 counts.
33 1https://www.gov.uk/government/statistics/transport-use-during-the-coronavirus-covid-19-pandemicPost-
Implementation
Monitoring
Round 1/Sep 2020
LA CONFIANCE TRANSPORTE LE MONDESeptember 2020 Flow Change – Cars/LGV
The map to the right outlines changes in counts of cars and LGVs
(combined) compared to pre-implementation, at sites where data
has been collected in September 2020. This is prior to the
implementation of the Dulwich Village timed restrictions.
Calton Avenue, Melbourne Grove and Court Lane have all seen
decreases in excess of 50% in traffic volumes following the
introduction of the measures. Traffic levels have also reduced on
Turney Road West, Woodward Road and Eynella Road.
Flows have increased in volume on some surrounding roads, for
example East Dulwich Grove (+37% and +24%)
Prior to the implementation of timed restrictions, flows have also
increased on Burbage Road (+93%), Turney Road East (+37%),
and Dulwich Village (+10%).
Note that overall traffic levels in Southwark were down 4% in
September 2020 vs. April 2019.
Basemap: Stamen
35September 2020 Flow Change – Cycles Basemap: Stamen
The map to the right outlines changes in counts of
cycles compared to pre-implementation at sites
where data has been collected in September
2020*. This is prior to the implementation of the
Dulwich Village timed restrictions.
Cycle flows have generally increased throughout
the Streetspace scheme areas.
The greatest increase has been seen on Calton
Avenue (+301%), with large increases also on
Dovercourt Road (+194%) and the southern end
of Lordship Lane (+186%).
NB. Court Lane East and Burbage Road North, comparison is to June 2020 rather than data
collected pre-COVID, likely explaining smaller comparative increase.
36 *Some sites excluded due to ATC appearing to have lost some or all cycle dataSeptember 2020 Flow Change – HGVs
The map to the right outlines changes in counts of
HGVs compared to pre-implementation at sites
where data has been collected in September 2020.
This is prior to the implementation of the Dulwich
Village timed restrictions.
HGV flows have decreased in locations with
restrictions, such as Calton Avenue (-54%), Court
Lane (-72%) and Melbourne Grove (-71%)
However, at this point, increases in HGVs have been
recorded on Dulwich Village, Turney Road and
Burbage Road, being over 70% at the latter two
sites. Grove Vale has also seen an increase.
It should be noted, that on a national basis, whilst
car traffic was at 92% of pre-COVID levels in
September 2020, HGV traffic was exceeding pre-
Basemap: Stamen
COVID volumes1.
37 1https://www.gov.uk/government/statistics/transport-use-during-the-coronavirus-covid-19-pandemicBus Journey Time
Monitoring
LA CONFIANCE TRANSPORTE LE MONDEBus Journey Times, Context TfL continuously monitors bus journey times. Analysis of this data has been completed, considering the average bus journey speeds, excluding time taken to pick up and drop off passengers. 2021 journey times have been compared to the average journey time in the 12 months prior to March 2020 for each bus corridor around or through Dulwich. The average speed for all routes, combined on each corridor, has been assessed. The maps on the following slides illustrate each corridor and each direction, whether bus journey times have stayed the same or changed by a limited amount, increased or decreased. Results are the average for the 12 hours from 7AM – 7PM. These maps show the averages for each of September 2020, March 2021 and April 2021, in line with the main periods of data collection for the traffic data. Continuous data showing weekly journey times from March 2020 to date can be found in Appendix C. It should be noted that the week commencing 19th March saw journey times double on many routes, before reverting to previous levels. This week has therefore been excluded, being anomalous and unlikely related to the Streetspace schemes. 39
Bus Journey Time Analysis – May 2021 Bus journey times for May 2021 have been compared with average pre-implementation journey times. The analysis shows an increase in bus journey times along East Dulwich Grove in both directions, on Croxted Road northbound and on Red Post Hill southbound. The only improvement in journey times has been recorded on Dulwich Village southbound, while in every other road only limited changes were recorded. 40
Bus Journey Time Analysis – April 2021 Bus journey times for April 2021 have been compared with average pre-implementation journey times. Bus journey time analysis shows an increase in journey times on Croxted Road, Grove Lane northbound and Red Post Hill southbound. Improvements in journey have been recorded on Dulwich Village in both directions and on Red Post Hill northbound. 41
Bus Journey Time Analysis – March 2021 Bus journey times for March 2021 have been compared with average pre-implementation journey times. The analysis shows improvements in journey times, on Dulwich Village in both directions and on Red Post Hill northbound. Journey times for buses travelling on the South Circular, Croxted Road, Red Post Hill and on Half Moon Lane have increased in one direction. 42
Bus Journey Time Analysis – September 2020 Bus journey times for September 2020 have been compared with average pre-implementation journey times. The analysis shows an increase in journey times along peripheral roads, especially along East Dulwich Grove in both directions. Bus journey times have improved on Red Post Hill northbound and Dulwich Village southbound. Limited change was recorded on other roads. 43
Vehicle Speed
                                   Monitoring

LA CONFIANCE TRANSPORTE LE MONDE
Vehicle Speeds
Whilst the objective of the Streetspace schemes is not to reduce vehicle speeds, it is possible
that changes in traffic volumes will lead to changes in speeds on roads inside or outside the
scheme areas.
A review of the data has been completed, comparing the average, and 85th percentile speeds as
well as the percentage of vehicles travelling above the speed limit.
Whilst some variation has been observed, in general this has been very low, or related to low
vehicle flows. Some sites where greater changes have been recorded are:
Croxted Road - average speed has dropped from 24mph pre-implementation to less than 20mph
Dovercourt Road – increase in % of drivers above speed limit from less than 5% to over 20%. This
represents a roughly 1mph increase in average speeds.
Lordship Lane South – decrease in % of drivers above speed limit from over 70% to less than 60%
Melbourne Grove South – average speed has dropped from 18mph pre-implementation to 15mph
45You can also read