Lung retention and particokinetics of silver and gold nanoparticles in rats following subacute inhalation co-exposure
←
→
Page content transcription
If your browser does not render page correctly, please read the page content below
Kim et al. Particle and Fibre Toxicology   (2021) 18:5
https://doi.org/10.1186/s12989-021-00397-z

 RESEARCH                                                                                                                                          Open Access

Lung retention and particokinetics of silver
and gold nanoparticles in rats following
subacute inhalation co-exposure
Jin Kwon Kim1, Hoi Pin Kim2, Jung Duck Park3, Kangho Ahn1, Woo Young Kim1, Mary Gulumian4,5,6,
Günter Oberdörster7* and Il Je Yu2,8*

  Abstract
  Background: Inhalation exposure to nanomaterials in workplaces can include a mixture of multiple nanoparticles.
  Such ambient nanoparticles can be of high dissolution or low dissolution in vivo and we wished to determine
  whether co-exposure to particles with different dissolution rates affects their biokinetics.
  Methods and Results: Rats were exposed to biosoluble silver nanoparticles (AgNPs, 10.86 nm) and to biopersistent gold
  nanoparticles (AuNPs, 10.82 nm) for 28 days (6-h/day, 5-days/week for 4 weeks) either with separate NP inhalation
  exposures or with combined co-exposure. The separate NPs mass concentrations estimated by the differential mobility
  analyzer system (DMAS) were determined to be 17.68 ± 1.69 μg/m3 for AuNP and 10.12 ± 0.71 μg/m3 for AgNP. In
  addition, mass concentrations analyzed by atomic absorption spectrometer (AAS) via filter sampling were for AuNP
  19.34 ± 2.55 μg/m3 and AgNP 17.38 ± 1.88 μg/m3 for separate exposure and AuNP 8.20 ± 1.05 μg/m3 and AgNP 8.99 ±
  1.77 μg/m3 for co-exposure. Lung retention and clearance were determined on day 1 (6-h) of exposure (E-1) and on post-
  exposure days 1, 7, and 28 (PEO-1, PEO-7, and PEO-28, respectively). While the AgNP and AuNP deposition rates were
  determined to be similar due to the similarity of NP size of both aerosols, the retention half-times and clearance rates
  differed due to the difference in dissolution rates. Thus, when comparing the lung burdens following separate exposures,
  the AgNP retention was 10 times less than the AuNP retention at 6-h (E-1), and 69, 89, and 121 times lower less than the
  AuNP retention at PEO-1, PEO-7, and PEO-28, respectively. In the case of AuNP+AgNP co-exposure, the retained AgNP
  lung burden was 14 times less than the retained AuNP lung burden at E-1, and 26, 43, and 55 times less than the
  retained AuNP lung burden at PEO-1, PEO-7, and PEO-28, respectively. The retention of AuNP was not affected by the
  presence of AgNP, but AgNP retention was influenced in the presence of AuNP starting at 24 h after the first day of post
  day of exposure. The clearance of AgNPs of the separate exposure showed 2 phases; fast (T1/2 3.1 days) and slow (T1/2
  48.5 days), while the clearance of AuNPs only showed one phase (T1/2 .81.5 days). For the co-exposure of AuNPs+AgNPs,
  the clearance of AgNPs also showed 2 phases; fast (T1/2 2.2 days) and slow (T1/2 28.4 days), while the clearance of AuNPs
  consistently showed one phase (T1/2 54.2 days). The percentage of Ag lung burden in the fast and slow clearing lung
  compartment was different between separate and combined exposure. For the combined exposure, the slow and fast
  (Continued on next page)

* Correspondence: Gunter_Oberdorster@URMC.Rochester.edu;
u1670916@chollian.net
7
 Department of Environmental Medicine, University of Rochester, Rochester,
NY, USA
2
 Aerosol Toxicology Research Center, HCTm CO.,LTD, Icheon, South Korea
Full list of author information is available at the end of the article

                                       © The Author(s). 2021 Open Access This article is licensed under a Creative Commons Attribution 4.0 International License,
                                       which permits use, sharing, adaptation, distribution and reproduction in any medium or format, as long as you give
                                       appropriate credit to the original author(s) and the source, provide a link to the Creative Commons licence, and indicate if
                                       changes were made. The images or other third party material in this article are included in the article's Creative Commons
                                       licence, unless indicated otherwise in a credit line to the material. If material is not included in the article's Creative Commons
                                       licence and your intended use is not permitted by statutory regulation or exceeds the permitted use, you will need to obtain
                                       permission directly from the copyright holder. To view a copy of this licence, visit http://creativecommons.org/licenses/by/4.0/.
                                       The Creative Commons Public Domain Dedication waiver (http://creativecommons.org/publicdomain/zero/1.0/) applies to the
                                       data made available in this article, unless otherwise stated in a credit line to the data.
Kim et al. Particle and Fibre Toxicology (2021) 18:5 Page 2 of 12 (Continued from previous page) compartments were each 50% of the lung burden. For the single exposure, 1/3 of the lung burden was cleared by the fast rate and 2/3 of the lung burden by the slow rate. Conclusions: The clearance of AgNPs follows a two- phase model of fast and slow dissolution rates while the clearance of AuNPs could be described by a one- phase model with a longer half-time. The co-exposure of AuNPs+AgNPs showed that the clearance of AgNPs was altered by the presence of AuNPs perhaps due to some interaction between AgNP and AuNP affecting dissolution and/or mechanical clearance of AgNP in vivo. Keywords: Gold nanoparticles, Silver nanoparticles, Subacute inhalation exposure, Co-exposure, Particokinetics, Toxicokinetics, Lung retention Background AuNPs administered by intravenous injection separately Nanomaterials have many applications. For example, or in combination over 4 weeks, where the nanoparticle silver nanoparticles are widely used as an antibacterial clearance was then evaluated during a 4-week recovery component in textiles, personal care products, cosmetics, period. The results indicated that the AgNPs and AuNPs home furnishing appliances, and biomedicine [1, 2], were distributed in different target tissues depending on while gold nanoparticles are often used in biomedical their bio-solubility, and that co-administration lowered fields, such as drug delivery, image diagnostics, and target tissue levels, suggesting a competitive cellular up- therapies [3–5]. Inhaled airborne particles, such as dust, take and confirming that the NP tissue translocation was ultrafine particles, fumes, from environmental and occu- in a particulate rather than ionic form [12]. The present pational sources are deposited in all regions of the subacute AgNP inhalation study was also based on the re- respiratory tract depending on their size [6, 7]. Workers vised OECD test guideline 412. The result suggested that in occupational settings and consumers of nanomaterial- Ag from AgNPs is cleared through two different phases, containing products are likely exposed to multiple nano- involving fast and slow clearance. The fast clearance com- materials, including both soluble and poorly soluble ponent - which was concentration-dependent - could be nanomaterials. AgNP and AuNP can be representative related to the rapid dissolution of AgNPs and the slow nanomaterials for soluble and insoluble nanomaterials. clearance could be due to mechanical AgNP clearance Toxicokinetics or particokinetics of nanomaterials and low dissolution of AgNPs to form secondary particles including studies on the absorption, distribution, metab- originating from silver ions reacting with biogenic anions. olism, and elimination (ADME) of naomaterials are These secondary AgNPs might be cleared by mechanisms essential in assessing their potential health effects. other than dissolution such as mucociliary escalation, Recognizing the difference in toxicokinetic evaluation translocation to the lymphatic system, or other organs between conventional chemicals including pharmaceuti- [13]. A similar observation was made with 20 nm AgNP cals and nanomaterials, the current OECD toxicokinetic 1.5 h inhalation exposure and PEO-28 period [14]. test guideline 417 explicitly stated that the guideline is However, understanding the biokinetics of NPs follow- not intended for testing nanomaterials [8]. While it is ing co-inhalation is essential, given that inhalation is the under revision, the newly revised OECD inhalation test main mode of exposure for workers and consumers and guidelines included some portion of toxicokinetics such that in the future more frequently the exposure may be as lung burden measurement of particulate aerosols in- simultaneous to more than one NP. cluding nano-range aerosols. The recently revised OECD We decided, therefore, to perform subacute (28-days) guidelines for subacute (TG 412) and subchronic (TG separate and combined inhalation exposures of rats to 413) inhalation toxicology testing stated that “testing of AgNPs and/or AuNPs of similar sizes and at similar con- poorly soluble solid aerosols should include measure- centrations. Following exposure, lung burdens were ments of lung burden and clearance kinetics” [9, 10]. measured at 1, 7, and 28 days post-exposure to deter- Therefore, such test guidelines require additional post- mine the clearance kinetics of high dissolution AgNPs exposure observation (PEO) periods that include lung and low dissolution AuNPs, and to assess if any inter- burden measurements to inform on lung clearance action may have occurred between these two types of behavior and translocation. The guideline and GD (guid- nanoparticles upon co-exposure. ance document) 39 recommended 2–3 time points during the post-exposure observation (PEO) to study lung Materials and methods burden after nanoparticle inhalation exposure [9–11]. In a AgNP and AuNP aerosol generation previous toxicokinetic study, the current authors investi- The aerosol generator consisted of a small ceramic gated the distribution (particulate or ionic) of AgNPs and heater connected to an AC power supply that was
Kim et al. Particle and Fibre Toxicology   (2021) 18:5                                                      Page 3 of 12

housed within a quartz tube furnace. The heater dimen-       Canada) using nitric acid (Fluka, Lot; BCBM5181V).
sions were 50 × 5 × 1.5 mm, and a surface temperature of     Two samples collected daily from each chamber were
about 1500 °C within a local heating area of 5 × 10 mm2      analyzed during the 28-day exposure period.
was achieved within about 10s. For long-term testing,
the source materials (about 160 mg), silver wire (100 mg,    Transmission electron microscopy
99.99% purity, 0.5 mm diameter, Higgslab Co., Ltd.,          The AgNPs, AuNPs, and AuNPs+AgNPs were collected
Korea), and gold wire (70 mg, 99.99% purity, 0.5 mm          on a TEM grid (electron microscope, 200 mesh, For-
diameter, Higgslab Co., Ltd., Korea), were positioned in     mvar/Carbon, TEDpella, CA) and imaged for morph-
a separate ceramic heater at the highest temperature         ology using a field emission transmission electron
point. The quartz tube was 70 mm in diameter and 140         microscope (FE-TEM, JEM2100F, 200 kV, JEOL, Tokyo,
mm in length. Clean (dry and filtered) air was used as       Japan). Their chemical composition was analyzed using
the carrier gas, and the gas flow maintained at 25.0 L/      an energy-dispersive x-ray analyzer (EDS, TM200, Ox-
min (Re = 572, laminar flow regime) using a mass             ford Instruments PLC, Oxfordshire, UK), while the
flow controller (MFC, AERA, FC-7810CD-4 V, Japan)            CMD and GSD were obtained after measuring 200 parti-
[15–18]. In the current study, the exposure system           cles for each nanoparticle.
consisted of four nose-only chambers; fresh air
control, AgNP exposure, AuNP exposure, and AuNP+             Animal care and housing conditions
AgNP co-exposure (Supplement 1). Each generator              Seventy-six male 6-week-old specific-pathogen-free
used 4–5 Lpm (liters per minute), and the remaining          Sprague-Dawley rats (average body weight 178.53 ± 0.63
air flows of AgNP, AuNP, and AuNP+AgNP were                  g) were purchased from OrientBio (Seongnam, Korea)
25.1 ± 0.10 Lpm, 24.8 ± 0.15, and 24.2 ± 0.1 Lpm             and acclimated for 1 week before commencing the
(AgNP 11.9 ± 0.12 Lpm / AuNP 12.3 ± 0.11 Lpm),               experiments. Three to four rats were housed in polycar-
respectively. The total airflow in each chamber was          bonate cages during the acclimation and experimental
35 Lpm, controlled by the mass flow controller. The          period. The animal room temperature, humidity, and
airflow from the generators was divided by a valve           light/dark cycle were 21.40 ± 0.55 °C, 48.67 ± 5.56%, and
controller into the AgNP, AuNP, and AuNP+AgNP                12 h, respectively. Filtered water and a rodent diet (BSC,
exposure chambers (NITC, HCT, Icheon, Korea). The            Republic of Korea) were supplied ad libitum. The rats
target nanoparticle diameter was 10 nm for each              were adapted to the nose-only tubes for a week with
nanoparticle exposure, and the target mass concentrations    daily tube placement for 2 h. The 7-week-old rats weigh-
for the AgNP, AuNP, and AuNP+AgNP exposures were             ing 273.63 ± 2.83 g were divided into four groups: fresh
20 μg/m3, 20 μg/m3, and 10 μg/m3 AgNP+ 10 μg/m3              air control, AgNP, AuNP, and AuNP+AgNP exposure
AuNP, respectively.                                          groups sacrifice, and exposed 6 h/day, 5 days/week for 4
                                                             weeks. Each exposure group included 19 animals (4 rats
Monitoring of inhalation chambers and analysis of AgNPs      for 1-day (6 h) exposure and 5 rats for 1-day, 7-days, and
and AuNPs                                                    28-days post-exposure, respectively). The animals were
In each chamber, the nanoparticle size distribution, in-     examined daily on weekdays for any evidence of
cluding the count median diameter (CMD), geometric           exposure-related effects, including respiratory, dermal,
standard deviation (GSD), particle number, volume, and       behavioral, nasal, or genitourinary changes suggestive of
predicted surface area, were recorded using a differential   irritation. The body weights were evaluated at the time
mobility analyzer system (DMAS) comprised of a differ-       of purchase, at the time of grouping, once a week during
ential mobility analyzer (DMA-20, 4220, range 6–225          the inhalation exposure and post-exposure period, and
nm, HCT Co., Ltd. Korea) and condensation particle           before necropsy (results are not shown). The rat experi-
counter (CPC, 3775, size range 4 nm- 1 μm, TSI INC.,         ments were approved by the Hanyang University Institu-
Shoreview, MN). Nanoparticles from 6 to 225 nm were          tional Animal Care and Use Committee in South Korea
measured using sheath air at 15 L/min and polydispersed      (HY-IACUC-2017-0143A).
aerosol air at 1.5 L/min for the DMAS with a density of
10.49 g/cm3 for Ag and 19.32 g/cm3 for Au, respectively.     Quantitative analysis of lung tissue burden using ICP-MS
In addition, the mass concentrations of AgNP and AuNP        Immediately after the 6-h. exposure on day 1 and 1, 7,
were determined chemically by using an atomic absorp-        and 28 days after the 28-day exposure period, rats were
tion spectrophotometer (AAS, Perkin-Elmer 900 T, Wal-        sacrificed by anesthetizing via an intraperitoneal injec-
tham, MA, USA) after sampling on a mixed cellulose           tion of pentobarbital (EntobarVR, Hanlim Pharm Co.
ester (MCE) filter (size: 37 mm and pore size 0.45 μm,       Ltd., Seoul, Korea) at a dose of 150 mg/kg body weight.
SKC, UK) at a flow rate of 1.0 L/min and digesting the       The animals in the control group were sacrificed first,
samples on a hot plate (PerkinElmer, Concord, ON,            and all the dissection instruments were thoroughly
Kim et al. Particle and Fibre Toxicology (2021) 18:5 Page 4 of 12
washed with 70% ethyl alcohol in between the dissections clearance kinetics were calculated by applying a first-
to avoid NP contamination from one organ to another. order decay model and a two-phase model. The first-
After measuring the lung weights, the lungs were fixed order model is described by Eq. 2. The two-phase model
with 10% neutral buffer formalin for further processing. or two-exponential time-decay function used computer
The fixed lungs were then digested as described in NIOSH programming based on Eq. 3, prior to which the reten-
7302 [19] using a microwave (MARS 230/60, CEM, tion fractions were converted to logarithmic variables.
Matthews, NC) with the following three steps: 1) increase The retention half-time (T1/2) was derived using λ 1, λ 2,
the temperature to 110 °C for 15 min; 2) maintain this and natural log (2) as shown in Eq. 4.
temperature for 60 min (1600w); and 3) cool for 15 min.
The digestion solution for lung tissue consisted of 2 mL of MðtÞ ¼ P 1 expð − λ1 t Þ ð2Þ
nitric acid (purity of 69.0%; CAS.no of 7697-37-2, Fluka, Where
Germany), and 3 mL of 1% nitric acid to make a final
volume 5 ml. The samples were then analyzed using an in- M(t); lung burden at time (t)
ductively coupled plasma mass spectrometer (ICP-MS, P1; fraction of lung burden cleared (1.0 for one-
PerkinElmer NEXION 300S, Concord, ON, Canada). The compartment model)
ICP-MS analysis was conducted according to NIOSH λ1; clearance rate per day for one-compartment
8200 [20]. model
The concentrations of Ag and Au in the lungs were
determined by ICP-MS based on standard curves estab-
lished with un-exposed clean lungs spiked with test NPs
sampled from the respective inhalation chambers, where MðtÞ ¼ P 1 expð − λ1 t Þ þ P2 expð − λ2 t Þ ð3Þ
the results from digestion, extraction, and dilution were
all performed in duplicates. The quantitative analyses for
Ag and Au in the lungs were corrected using the spiked M(t); lung burden at time (t)
standard curve. The recovery yields of AgNPs and P1; fraction of lung burden cleared by fast phase
AuNPs were 81–113% and 84–105%, respectively, as λ1; fast clearance rate per day for two-compartment
shown in Supplement 2. The spiked standard curves model
ranged from 0.2–5 ng/g of lung tissue for AgNPs and 2– P2; fraction of lung burden cleared by slow phase
100 ng/g of lung tissue for AuNPs. When analyzing the λ2; slow clearance rate per day for two-compartment
samples, the dilution factor was 100 times. The digestion model
recovery of AgNPs and AuNPs in the lung tissue was
calculated using Eq. 1.
ln ð2Þ 0:693
T 1=2 ¼ ≈ ð4Þ
Recovery ð100%Þ ¼ measured concentration ðng=gÞ
λ λ
=spiked concentrationðng=gÞ 100
ð1Þ λ1 is for fast phase half-time (T½fast)
λ2 is for slow phase half-time (T½slow)
The samples were all analyzed using a standard cali-
bration curve that ranged from 0.05–0.5 ppb for Ag and Statistical analysis
1–10 ppb for Au. After analyzing standard blanks 40 An analysis of variance (ANOVA) test and Dunnett T3
times, the measured LOD and LOQ were 0.086 μg /L multi-range tests were used with up to two points, where
and 0.260 μg /L, respectively, for Ag and 0.027 μg /L and one point compared the single and co-exposure groups,
0.082 μg/L, respectively, for Au. while two points compared each group from PEO-1 to
PEO-28. The level of significance was set at P < 0.05.
Retention kinetics
The lung retention kinetics for the AgNPs, AuNPs, and Results
AuNP+AgNP co-exposure were determined based on Characterization of AgNP and AuNP aerosols in inhalation
lung burdens measured on 1-day (6-h) of exposure (E-1) chambers
and on post-exposure observation days 1 (PEO-1), 7 The total number concentrations, CMD, GSD, and
(PEO-7), and 28 (PEO-28). Half-times were calculated surface area of the AgNPs, AuNPs, and AuNPs+AgNPs
based on the assumption from previous data and our measured by the DMAS are presented in Table 1 and
experimental design that Au had a monoexponential de- Supplement 1. FE-TEM revealed non-agglomerated
cline and Ag had a two- phase decline. The lung particles (Supplement 3) and TEM-EDS identified AgNPKim et al. Particle and Fibre Toxicology (2021) 18:5 Page 5 of 12
Table 1 Aerosol data for AuNPs, AgNPs, and AuNP+AgNP co-exposure
AuNPs AgNPs AuNP+AgNP co-exposure
DMASa Total particle concentration(#/cm3) 1.38 × 10⁶ ± 1.32 × 10⁵ 1.44 × 10⁶ ± 1.003 × 10⁵ 1.10 × 10⁶ ± 1.110 × 10⁵
CMD (nm) 10.82 ± 0.24 10.86 ± 0.20 10.91 ± 0.22
GSD 1.28 ± 0.01 1.27 ± 0.01 1.28 ± 0.01
Particle mass concentration (μg/m3) 17.68 ± 1.69 10.12 ± 0.71 –
2 3 8 7 8 7
Surface area (nm /cm ) 5.79 × 10 ± 7.60 × 10 6.06 × 10 ± 5.591 × 10 5.32 × 10 ± 5.120 × 10⁷
8
3 3 9 8 9 8
Volume (nm /cm ) 1.28 × 10 ± 2.01 × 10 1.34 × 10 ± 1.358 × 10 1.18 × 10⁹ ± 1.21 × 10⁸
FE-TEMb CMD (GSD) 10.40 (1.36) 9.48 (1.49) 9.00 (1.19)
AASc Particle mass concentration (μg/m3) 19.34 ± 2.55 17.38 ± 1.88 AuNPs: 8.20 ± 1.05
AgNPs: 8.99 ± 1.77
(Mean ± S.D), a) DMAS Differential Mobility Analyzing System conducted measurements during 28 days of exposure period; b) CMD and GSD were analyzed based
on counts of 200 particles using FE-TEM; c) AAS Atomic Absorption Spectrometer; n = 40 (2 cases each day for a total of 20 days)
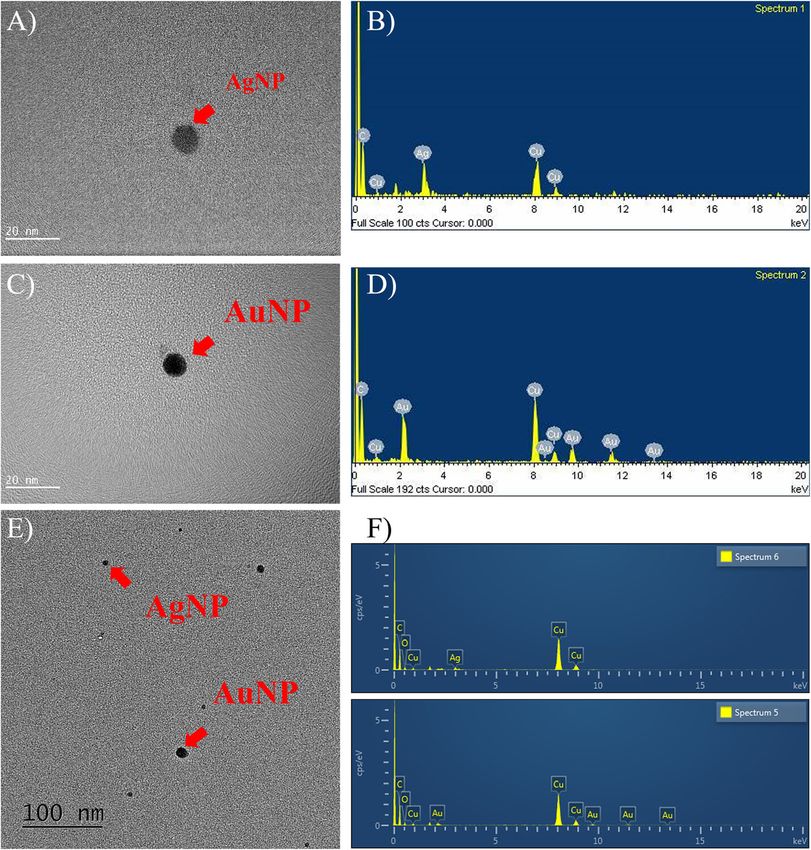
and AuNP particles in each chamber (Fig. 1b and d). AgNP and AuNP retention in lungs during post-exposure
The mass concentrations analyzed by AAS via filter sam- observation periods
pling were 17.38 ± 1.88 μg/m3 for AgNPs, 19.34 ± The retained lung burden was expressed as a percent of
2.55 μg/m3 for AuNPs for single exposure, and 8.99 ± PEO-1 lung burdens. Thus, at PEO-1, PEO-7, and PEO-
1.77 AgNPs + 8.20 ± 1.05 AuNPs for AuNP+AgNP for 28, the retained lung burden of Au was 100 ± 0, 90.1 ±
co-exposure, while the mass concentrations estimated by 11.6, and 78.50 ± 6.5%, respectively, for single AuNP ex-
DMAS were 10.12 ± 0.71 μg/m3 for AgNPs and 17.68 ± posure. For AuNP+AgNP co-exposure, the retained lung
1.1.69 μg/m3 for AgNPs, respectively. There were some burden of Au at PEO-1, PEO-7, and PEO-28 were 100 ±
discrepancies in the mass concentrations between filter 0, 87.0 ± 6.1 and 68.2 ± 6.2%, respectively, which is simi-
sampling and DMAS estimation. The discrepancies lar as those observed in the single AuNP exposure
could be caused by sampling and chemical analysis (Table 2). At PEO-1, PEO-7, and PEO-28, the retained
errors of filter sampling. To avoid these sampling and Ag lung retentions were 100 ± 0, 69.4 ± 5.8, and 45.0 ±
chemical analytical errors, we used AuNP and AgNP 8.9%, respectively, for single AgNP exposure. For
concentrations measured by DMAS rather than AAS AuNP+AgNP co-exposure, retained Ag lung burden at
based concentrations. Detailed mass calculation from PEO-1, PEO-7, and PEO-28 were 100 ± 0, 52.8 ± 6.6 and
DMAS measurement is described in Supplement 4. 27.4 ± 3.8% respectively, which is different from those
TEM indicated that the AgNPs, AuNPs, and AuNPs+ observed in the single AgNP exposure (Table 2). Since
AgNPs were the particle diameters log-normally distrib- exposure concentrations (μg/m3) of AuNP and AgNP in
uted between 6 and 30 nm. The CMD and GSD mea- the co-exposure of AuNP + AgNP were nearly half of
surements were 10.40 nm and 1.36, respectively, for the those of the single exposures, the ratios of retained mass
AuNPs, 9.48 nm and 1.49, respectively, for the AgNPs, lung burdens on each post-exposure day between single
and 9.00 nm and 1.19, respectively, for the AuNP+AgNP and co-exposures (B/A and C/D in Table 2) was ex-
co-exposure (Table 1). pected to be 0.5 if there was no change in lung retention
kinetics. In the case of AuNP single exposure and
AgNP and AuNP retention in lungs after 1-day (6-h) of AuNP+AgNP co-exposure, the ratios of lung burdens of
exposure co-exposure/single exposure were < 0.5, ranging from
The whole lung burdens from E-1 and PEO-1 to PEO- 0.40 ± 0.01, 0.39 ± 0.03, and 0.35 ± 0.03 at PEO-1, PEO-7,
28 were analyzed using ICP-MS as described in the and PEO-28, respectively, perhaps indicating either
Methods. The AgNP and AuNP deposition/retention per dependence of AuNP clearance on the initial Au lung
lung on day-1 (6-h) of exposure is shown in Table 2 and burden or interference from the presence of AgNPs. In
Supplements 5, 6, 7 and 8 (including lung weights). Des- the case of AgNP single exposure and AuNP+AgNP co-
pite similar airborne sizes of AgNPs and AuNPs, the exposure, however, the lung burden ratios of co-exposure/
retained amount of Ag after 6 h of exposure was much single exposure were > 0.5, ranging from 1.06 ± 0.05,
lower (10 times less) than the amount of Au. As 0.80 ± 0.10 and 0.64 ± 0.09 at PEO-1, PEO-7 and PEO-28,
discussed later, rapid dissolution and Ag ion clearance respectively, indicating a slower clearance of AgNPs in the
may have a significant effect on their retention. Similarly, presence of AuNPs (Table 2). This ratio for E-1 showed
for the co-exposure of AuNPs+AgNPs, the 6-h retained the expected value of 0.49 ± 0.03 for AgNPs indicating
Ag amount in the lung was also much lower (14 times that during the initial short 6-h, exposure (E-1) the pres-
less) than the amount of Au. ence of AuNPs, did not influence AgNP clearance, inKim et al. Particle and Fibre Toxicology (2021) 18:5 Page 6 of 12
Fig. 1 FE-TEM analysis for AgNPs, AuNPs, and AgNP+AuNP co-exposure in chambers; a image of single AgNP (scale 20 nm); b EDS result for
single AgNP; c image of single AuNP (scale 20 nm); d EDS result for single AuNP; e image of AgNP+AuNP co-exposure (scale 100 nm); f EDS
result for AgNP+AuNP co-exposure
contrast to the finding of repeat subacute exposure over and single AgNP exposure and AuNP + AuNP co-
28 days (5 days per week during 4 weeks, total 20 days) exposure are presented in Table 3. For Single AuNP
showing a lower clearance rate in the presence of AuNPs. exposure, a retention half-time (T1/2) was 81.5 days,
The ratio at E-1 for AuNPs was > 0.5, implying also a while co-exposure with AgNP reduced the AuNP T1/2 to
lower clearance rate in the presence of AgNPs during 54.2 days. Given that the retention half times for AuNPs
the short 6-h. exposure; this is opposite to the faster for both scenarios - single and combined exposure - are
clearance during the subsequent longer exposure over within the range of normal physiological alveolar clear-
28 days of 5 days per week for 4 weeks. ance rates of 60–90 days for poorly soluble particles in
rats [21], a significant difference cannot be substantiated.
Lung retention kinetics Therefore, AuNP clearance was likely not influenced by
Given the limited data points of Au and Ag lung reten- the presence of AgNP co-exposure, which is also
tion in the post-exposure period, possible outcomes con- supported by the same retained fraction of Au in the
sistent with these limited data were calculated for the lung at day 28 of both single and co-exposure.
lung retention kinetics are presented in Table 3 and In contrast, between 34 and 49% of deposited Ag was
Fig. 2. Au and Ag lung retention parameters analyzed estimated to be solubilized and removed from the lung
from the elimination curves are presented in Fig. 2. For within 5 days after 28-days of AgNP exposure and
Au, 97.9 and 97.1% were retained after 28-day of AuNP AuNP-AgNP co-exposure (Fig. 2b). Estimated insoluble
and AuNP+AgNP co-exposure, respectively. Calculated AgNPs were retained 66.1 and 51.2% after 28-days of
retention half times and clearance rates for single AuNP AgNP and AgNP+AuNP co-exposure, respectively. TheKim et al. Particle and Fibre Toxicology (2021) 18:5 Page 7 of 12
Table 2 Lung burden of AuNPs, AgNPs, and AuNP+AgNP co-exposure (ng/lung)
AuNP
Single (ng of Au)A Retention % Co-exposure (ng of Au)B Retention% B/A
E-1 (4) 466 ± 34 – 313 ± 18 – 0.67 ± 0.04
PEO-1 (5) 8930 ± 742 100.0 ± 0 3607 ± 133** 100.0 ± 0.0 0.40 ± 0.01
**
PEO-7 (5) 8048 ± 1308 90.1 ± 11.6 3137 ± 220 87.0 ± 6.1 0.39 ± 0.03
PEO-28 (5) 7010 ± 578 78.5 ± 6.5 2458 ± 224a,** 68.2 ± 6.2 0.35 ± 0.03
AgNP
Single (ng of Ag)C Retention% Co-exposure (ng of Ag)D Retention % D/C
E-1 (4) 47 ± 5 – 23 ± 1 – 0.49 ± 0.03
PEO-1 (5) 129 ± 15 100.00 ± 0.0 137 ± 6 100.0 ± 0.0 1.06 ± 0.05
PEO-7 (5) 90 ± 8 69.4 ± 5.8 72 ± 9a 52.8 ± 6.6 0.80 ± 0.10
a
PEO-28 (5) 58 ± 11 45.0 ± 8.9 37 ± 5a,b 27.4 ± 3.8 0.64 ± 0.09
Unit; mean ± S.E; (), number of animals per group; ng (in whole lung); E1, exposed for 1 day, PEO-1, post-exposure observation day 1; PEO-7 post-exposure
observation day 7; PEO-28, post-exposure observation day 28; amount of deposition in whole lung = ng/g lung tissue analyzed by ICP-MS x whole lung weight
and it was corrected the lung tissue spiked standard curve; further data details are included in Supplements 5, 6, 7 and 8; the clearance (%) was comparing PEO-1
for each a groups; B/A and D/C represent co-exposure/single exposure; Significant differences using ANOVA of multiple comparison; a) p < 0.05, comparing PEO-1;
b) p < 0.05, comparing PEO-2; **p < 0.05 compared with single and co-exposure
clearance of single AgNP exposure and AuNP+AgNP burden was cleared by the fast rate and 2/3 of the lung
co-exposure showed 2 phases for Ag clearance; fast and burden by the slow rate.
slow (Fig. 2b). The fast-retention T1/2 after single expos-
ure was 3.1 days, and the slow-retention T1/2 single Discussion
exposure was 48.5 days. AuNP+AgNP co-exposure also This study investigated the differences in the pulmonary
showed 2 phases of Ag clearance; fast and slow, where deposition/retention and clearance kinetics of AgNPs
the fast-retention T1/2 was 2.2 days, and the slow- and AuNPs in rats after daily separate or combined in-
retention T1/2 was 28.4 days. Comparing the clearance of halation exposure for 28 days, followed by a 28-day re-
Ag without and with AuNP co-exposure, the slow Ag covery period. Deposition differences due to size or
clearance rate was 1.7-fold faster in the combined expos- concentration were avoided by using similar concentra-
ure group. The clearance of Ag in the co-exposure group tions of AgNPs and AuNPs with similar physical and
was different in the presence of AuNP. However, the aerodynamic diameters. Thus, similar lung deposition
percent of lung burden in the fast and slow clearing for both NP types was expected, because the observed
compartments were also different between single and different retention kinetics between the two NP types
combined exposure: For the combined exposure, the following separated and combined exposures must be
slow and fast compartment comprised each 50% of the due to the biosoluble property of AgNP, vs the bioper-
lung burden. For the single exposure, 1/3 of the lung sistent property of AuNPs. It would have been advanta-
geous to have more PEOs for lung tissue sampling and
Table 3 Retention kinetics of AuNPs, AgNPs, and AuNP+AgNP co-exposure in lungs
First order model
T1/2, daya
AuNPs 81.5
AuNPs when co-exposed with AgNPs 54.2
Two-phase model
Fast-clearance phase Slow-clearance phase
a
T1/2, days T1/2, daysa
AgNPs 3.1 48.5
AgNPs when co-exposed with AuNPs 2.2 28.4
These data were analyzed using a two-phase model (fast and slow); Ag showed a two-phase model, whereas Au showed first order kinetics
The AuNPs and co-exposed AuNPs were analyzed based on a first order model using the equation [M(t)=P1exp(−λ1t)]
The AgNPs and co-exposed AgNPs were analyzed based on a two-phase clearance (fast and slow) using the equation [M(t)=P1exp(−λ1t)+P2exp(−λ2t)], a) half-time
time; T1/2 = ln(2) / λ (d1 and d2)Kim et al. Particle and Fibre Toxicology (2021) 18:5 Page 8 of 12 Fig. 2 Comparison of AuNPs and AgNPs in lung burden results. a Lung burden results of Au. b Lung burden results of Ag have extended the period beyond PEO-28 because Despite the justifications for this decision, three points poorly soluble AuNP have a long retention half-time. of PEO to study elimination kinetics are insufficient to The rationale for setting three post-exposure time points establish a comprehensive description of pulmonary Ag was based on 1) OECD test guidelines 412 recommends and Au retention, and it may only provide estimates. 3 PEOs, 2) OECD GD 39 [11] suggestion “For normal Furthermore, the study design and the values reported clearance conditions, elimination half-times of particles in this paper are estimates of these parameters con- retained in the lung are in the range of T1/2 = 60 to 90 strained by the sample times in the study design. If more days. Accordingly, post-exposure periods should not be or different time points were collected, the inflection shorter than one generic elimination half-time at normal points could be determined more accurately which may clearance conditions” 3) Our previous study by Jo et al. result in different pharmacokinetic parameters. [13] indicated AgNP has two phases of elimination; fast NPs are rapidly removed from the systemic circulation (2–4 days) and slow (57–100 days), depending on expos- by cells of the mononuclear phagocytic system (MPS) as ure concentration. Given the well-studied and deter- indicated by the observed distribution of a major frac- mined T1/2 for inhaled poorly soluble low toxicity tion of an intravenous injected dose into the spleen and particles in rats [22], and the less well-established reten- liver, thus equilibrium is not reached. This implies that tion kinetics for biosoluble paritcles, and limited by only plasma is usually not a suitable medium to monitor NP 3 post-exposure data points, our experiment was de- exposure and plasma kinetic parameters such as plasma signed to study retention half-times shorter than 60–90 area under the curve (AUC) are generally not relevant days for AgNP and AuNP. Because we are studying the [23]. Therefore, sacrificing a large number of animals to elimination kinetics of both AgNP and AuNP simultan- obtain tissue distribution data from the PEOs after eously, we set the same three post-exposure time points. nanoparticle exposure is required but practically and
Kim et al. Particle and Fibre Toxicology   (2021) 18:5                                                            Page 9 of 12

ethically not possible due to the cost of animal and ani-        average T1/2 of 382 days. In addition to confirming the
mal welfare. Best estimates using 3 data points as sug-          well-established pulmonary T1/2 between about 60 and 90
gested by the regulatory guideline such as the OECD              days for low realistic lung burden, this study also con-
test guideline. Recently several previously conducted            firmed Morrow’s lung particle overload hypothesis of the
toxicokinetic or biokinetic inhalation studies for nano-         prolongation of pulmonary particle clearance with exces-
particles including AgNP, AuNP, TiO2, and MWCNTs                 sive lung burdens [22]. Despite the obvious limitations in
adopted 3 major data points [13, 14, 24–27]. After 5-day         estimating toxicokinetic parameters and considering also
inhalation of AuNP (13 nm), 1, 3, and 28-days PEOs               animal welfare, three data points for the lung burden
showed T1/2 of 44.5 days in the lung [24]. Kreyling et al.       measurement are widely adopted for estmating toxicoki-
[25, 26] used 2 hours of nano [195Au]AuNP intratracheal          netic patterns for nanoparticles for regulatory
inhalation exposure in rats in one study and 48V-radiola-        requirements.
beled, 20 nm TiO2-NP aerosols in the other study and                The completely different retention half-times and
also chose 1, 7, and 28-days of PEOs to analyze pulmon-          clearance rates between these two nanoparticles, where
ary retention. They reported short T1/2 of 23 days and           the AuNPs clearance could be expressed by first-order
25 days, respectively in the lung. These values are              kinetics consistent with alveolar macrophage (AM) me-
shorter than the 60–90 days half-time frequently re-             diated mechanical clearance starting 24 h after the last
ported [28, 29]. The authors realized this and reasoned          day of exposure when deposits on the tracheobronchial
that only three PEO data points of 1, 7, and 28 days are         tree had been cleared via the mucociliary escalator. In
not enough and 28 follow-up is too short to correctly            contrast, the bio-soluble AgNP was eliminated by both
determine the long-term retention half-time. Although            mechanical and dissolution clearance. The fast Ag clear-
we selected the same PEOs in our present study and we            ance component reflects ionic Ag due to the dissolution
agree with this shortcoming, there are clear differences:        of AgNPs, while the slow Ag clearance reflects a com-
(i) 2 hours intratracheal inhalation by Kreyling et al. [25,     bination of mechanical clearance and a possibly lower
26] vs 28 days nose-only inhalation in our present study;        dissolution of secondary AgNP originating from silver
(ii) rats were anesthetized during intratracheal inhalation      ions reacting with cellular target molecules. Recently
vs rats freely breathing during the nose-only inhalation.        published our study [13], lung retention and clearance
Although in both scenarios 24 h post-exposure was the            study after 28-day AgNP exposure of rats with lung bur-
first PEO at which point mucociliary deposits, for the           den data on by PEO-1, PEO-7, and PEO-28 also showed
most part, have been cleared, it is unknown as to                a similar result of two different modes of clearance; fast
whether anesthesia may have had an initially retarding           and slow. We suggested that the fast clearance rate,
effect on this fast clearance mechanism. Clearly, the re-        which was concentration-dependent, could be explained
ported T½ of 23 and 25 days [25, 26] are based on a              by the dissolution of AgNPs and the slow clearance rate
proper mono-exponential modeling of the measured data.           was due to slower clearance secondary Ag particles
Our analogues mono-exponential analysis of the AuNP              originating from dissolved silver ions after reacting with
pulmonary retention (Fig. 2a) resulted in T1/2 of 81 (single     biogenic anions. These secondary AgNPs might be
exposure) and 54 days (co-exposure), the expected range          cleared by mechanisms other than dissolution such as
for a poorly soluble low toxicity particle. Our data are esti-   mechanical, translocation along the mucociliary escal-
mated from a slope based on only a few data points at the        ator and via the lymphatic system to other organs [13].
beginning of an exponential process, however, they are              AgNPs have been known to undergo diverse biochemical
consistent with the 60–90 day OECD recommended                   transformations, including accelerated oxidative dissol-
range, and they are also consistent with results from other      ution in an acidic milieu, thiol binding and exchange, pho-
longer inhalation studies in rats of poorly soluble particles    toreduction of thiol- or protein-bound silver to secondary
of low cytotoxicity [30]. Confirmation of this pulmonary         Ag-NPs, and rapid reactions between silver surfaces and
T1/2 comes from a 28- day rat inhalation study with a            reduced selenium species [31]. Selenide is also observed to
poorly soluble low toxicity particle, TiO2. Creutzenberg         rapidly exchange with sulfide in preformed Ag2S solid
reported the study result of a comprehensive 28-day inhal-       phases. The combined results allow us to propose a con-
ation – including pulmonary retention kinetic - with a 90-       ceptual model for Ag-NP transformation pathways in the
day post-exposure observation time [30]. The study design        human body [31–33]. The formation of secondary AgNPs
involved three nano TiO2 particle types (rutile, anatase,        also occurred in wastewater [34]. These secondary Ag
and the much studied P25, a mixture of both) at 3 concen-        compounds created in the body may be cleared by mecha-
trations each. Lung retention of the 3 TiO2 NPs was simi-        nisms other than dissolution, such as the translocation to
lar, the low concentration (3 mg/m3) resulting in an             the lymphatic system leading to systemic distribution to
average T1/2 of 63 days, the mid concentration (12 mg/m3)        other organs. In contrast, AuNPs deposited in the lower
average T1/2 of 211 days, high concentration (50 mg/m3)          respiratory tract that is of poor biosolubility – equivalent
Kim et al. Particle and Fibre Toxicology   (2021) 18:5                                                            Page 10 of 12

of a poorly soluble low toxicity (PSLT) particle like TiO2 –     observation. The freshly deposited AgNP first dissolved
are mainly cleared at a normal physiological rate after          thereby releasing Ag + ions from their surface. In step 2, a
phagocytosis by alveolar macrophages, involving macro-           fraction of the ions forms layers of Ag-salt molecules
phage ingestion, and removal via mucociliary escalator, or       around the AgNP which retards the further release of
translocation to the interstitial lymphatic system. The co-      Ag + ions from the NP surface (step 3). In step 4, the rest
exposure of AuNPs+AgNPs also showed similar results for          of the Ag + ions form Ag-salt molecules of low solubility
each NP type, with two-compartment fast and slow phase           in the alveolar epithelial lining fluid (ELF) which is rich in
clearance of AgNPs, although one half of the exposure            Cl−, S− 2, PO4− 2 and Se− 2 ions. Due to the high concentra-
concentration used with co-exposure resulted in slightly         tion of the Ag-salt molecules, they precipitate to nano-
faster clearance rates for both phases than those for single     sized clusters (step 5). The Ag-salt clusters scavenge most
AgNP exposure. The co-exposed clearance of AuNPs also            of the Ag-salt molecules (step 6). Both the cores of AgNP
showed a similar trend to single AuNP exposure with a            and the Ag-salt clusters are phagocytized by lung surface
shorter T1/2 associated with the lower concentration, al-        macrophages (step 7) which will gradually transport them
though both half-times were still in the range of normal         to the distal end of the ciliated airways for mucociliary
physiological pulmonary particle clearance for rats.             transport to the larynx where they are swallowed into the
  The deposited AgNP can exist in the form of AgNP or            gastrointestinal tract (step 8). Alternatively, both particu-
Ag ions or secondary Ag compounds, as dissolved forms.           late species may be endocytosed by cells of the alveolar
The latter may be poorly soluble or insoluble bio-               epithelium (e.g. epithelial type 1 + 2 cells) which may exo-
persistent formed by Ag ions reacting with biomolecules          cytose them in exosomes for translocation across the ABB
forming silver protein complexes in the lung [31, 32].           (air blood barrier (step 9). Translocation across the ABB
Non-ionic silver (e.g. metallic) or silver salt is most likely   of both particulate species may also occur directly from
in the form of silver ions after slow or fast dissolution        the ELF. So insoluble AuNP simultaneously deposited to
following uptake to the body. Free silver ions are sub-          the alveolar region with AgNP may compete with insol-
jected to binding to proteins, peptides, and can become          uble components of AgNP in terms of phagocytosis by
a component of the extracellular matrix (ECM) [33].              lung alveolar and interstitial macrophages, endocytosis by
When lung tissue bound with components of ECM                    epithelial cells, fibroblasts, endothelial cells, etc. Between
breaks down, the soluble fragments containing silver ions        single exposure of AgNP and combined exposure of
could translocate to distant locations and deposit, whereas      AgNP, the observed influence of insoluble AuNP on the
the insoluble fragments containing silver ions could re-         clearance of soluble AgNP is not well understood at this
main in tissue as inert sulphide compounds after endo-           time. The underlying differences between AgNPs and
cytosis [31]. Argyrial deposits were found to result from        AuNPs observed between single and combined exposures
the combined pathways involving partial digestion to sol-        require additional investigations, including both in vivo
uble silver in the lungs or GI tract, ion uptake, and sys-       and in vitro studies to highlight the importance of dissol-
temic transport to soluble silver, ion uptake and systemic       ution in cellular retention and clearance.
transport as thiol complexes, photoreduction of Ag (I)
(zerovalent Ag) to immobilized silver in the form of AgNP
in the near skin region and then in situ transformation to       Conclusions
sulfides and selenides [31]. Perhaps, these insoluble silver     This study evaluated the lung retention/clearance and
complexes produced after the fast-phase clearance may be         toxicokinetics of AuNPs and AgNPs in rats during a 28-
cleared by a slow-phase. Since the fast-phase indicates          day post-exposure observation period following subacute
clearance of dissolved Ag ion, single AgNP exposure and          (28-days) inhalation exposure both separately and com-
AgNP combined exposure showed the same trend for this            bined. The nanoparticle concentrations and diameters
faster clearance. The slow-phase clearance may be poorly         were all similar. The clearance of AgNPs was found to
soluble Ag- or AgNP-complexes which may be influenced            have two phases, fast and slow, while the clearance of
by the presence of insoluble AuNP in the co-exposure             AuNPs only showed a slow phase. Moreover, in the co-
study. The percentage of lung burden in the fast and slow        exposure of AuNPs+AgNPs, the clearance AgNPs also
clearing compartment is different between single and             showed fast and slow phases, while the clearance of
combined exposure. For the single exposure, 1/3 of the Ag        AuNPs showed consistently one slow phase. Moreover,
lung burden is cleared by the fast rate and 2/3 of the Ag        the clearance of AuNPs was not affected by the presence
lung burden by the slow rate. In contrast, the slow and fast     of AgNP co-exposure, but the clearance of AgNP was
compartment are each 50% of the Ag lung burden in the            influenced by the co-exposure of AuNP indicating some
co-exposure. A similar observation was reported recently         unknown interactions in the overall clearance in the
by Kreyling et al. [14] after 1.5 h exposure of 105Ag-radi-      presence of poorly soluble and AuNP.
olabeled 20 nm AgNP and thereafter 28-day post-
Kim et al. Particle and Fibre Toxicology          (2021) 18:5                                                                                         Page 11 of 12

Supplementary Information                                                         2.    Ahamed M, Alsalhi MS, Siddiqui MK. Silver nanoparticle applications and
The online version contains supplementary material available at https://doi.            human health. Clin Chimia Acta. 2010;411:1841–8.
org/10.1186/s12989-021-00397-z.                                                   3.    Sperling RA, Rivera Gil P, Zhang F, Zanella M, Parak WJ. Biological
                                                                                        applications of gold nanoparticles. Chem Soc Rev. 2008;37:1896–908.
 Additional file 1: Supplement 1. Schematic of exposure system for                4.    Boisselier E, Astruc D. Gold nanoparticles in nano medicine: preparations,
 generating AuNPs, AgNPs, and AuNP+AgNP co-exposure for nose only                       imaging, diagnostics, therapies and toxicity. Chem Soc Rev. 2009;38:1759.
 exposure chambers. Supplement 2. Spiked standard curve and recovery              5.    Li X, Zhou H, Yang L, Du G, Pai-Panandiker AS, Huang X, et al. Enhancement
 detection for Au and Ag in lung tissue. Range of Au, 2 – 100 ng/g ; range              of cell recognition in vitro by dual-ligand cancer targeting gold
 of Ag, 0.2 – 5 ng/g. Supplement 3. Particle distribution in exposure                   nanoparticles. Biomaterials. 2011;32:2540–5.
 chambers based on DMAS and FE-TEM. Supplement 4. The particle                    6.    Donaldson K, Stone V, Tran CL, Kreyling W, Borm PJ. Nanotoxicology. Occup
 mass concentration of single of AgNP and AuNP using by DMAS. The                       Environ Med. 2004;61:727–8 Available from: https://www.ncbi.nlm.nih.gov/
 particle mass concentrations were calculated based on DMAS data of                     pubmed/15317911.
 number concentration and average of diameter and particle density fol-           7.    Hayes AW. Principles and methods of toxicology. 5th ed. New York: Taylor
 lowing under formula. Supplement 5. Deposition and retention of Au.                    and Francis group; 2007.
 Supplement 6. Deposition and retention of Au in case of co-exposure              8.    OECD (Organization Economic Cooperation and Development). OECD
 with AgNPs. Supplement 7. Deposition and retention of Ag. Supple-                      guideline for the testing of chemicals 417, Toxicokinetcs. Paris: OECD; 2018.
 ment 8. Deposition and retention of Ag in case of co-exposure with                     Available from: https://www.oecd-ilibrary.org/environment/test-no-417-
 AuNPs.                                                                                 toxicokinetics_9789264070882-en
                                                                                  9.    OECD (Organization Economic Cooperation and Development). OECD
                                                                                        guideline for the testing of chemicals 412, 28-day (subacute) inhalation
Acknowledgements                                                                        toxicity study. Paris: OECD; 2018. Available from: https://www.oecd-ilibrary.
Not applicable.                                                                         org/environment/oecd-guidelines-for-the-testing-of-chemicals-section-4-
                                                                                        health-effects_20745788
Authors’ contributions                                                            10.   OECD (Organization Economic Cooperation and Development). OECD
JKK experimental and manuscript preparation; HPK, experimental                          guideline for the testing of chemicals 413, 90-day (subchronic) inhalation
preparation; JDP, Ag and Au ICP analysis; KA, aerosol monitoring advice; Kim            toxicity study. Paris: OECD; 2018. Available from: https://www.oecd-ilibrary.
WY, aerosol monitoring; MG, advice and manuscript review; GO and IJY,                   org/environment/test-no-413-subchronic-inhalation-toxicity-90-day-study_
experimental planning, manuscript preparation and review. All authors read              9789264070806-en
and approved the final manuscript.                                                11.   OECD (Organization Economic Cooperation and Development). Guidance
                                                                                        document on inhalation toxicity studies series on testing and assessment
Funding                                                                                 No. 39. Paris: OECD; 2018. Available from: https://www.oecd.org/
This study was supported by the Global Top Environment Technology                       officialdocuments/publicdisplaydocumentpdf/?cote=env/jm/mono(2009)28/
Development project (No. 2018001860004) funded by the Ministry of                       rev1&doclanguage=en
Environment and 3-Dimensional Real-Time Measurement of Particulate Matters        12.   Lee JH, Sung JH, Ryu HR, Song KS, Song NW, Park HM, et al. Tissue distribution
Near Sources using a Drone System project (No. 2019M1A2A210400212) by the               of gold and silver after subacute intravenous injection of co-administered gold
National Research Foundation of Korea.                                                  and AgNPs of similar sizes. Arch Toxicol. 2018;92:1393–405.
                                                                                  13.   Jo MS, Kim JK, Kim Y, Kim HP, Kim HS, Ahn K, Lee JH, Faustman EM,
                                                                                        Gulumian M, Kelman B, Yu IJ. Mode of silver clearance following 28-day
Availability of data and materials
                                                                                        inhalation exposure to silver nanoparticles determined from lung burden
All data and materials are included in the manuscript, tables, figures and
                                                                                        assessment including post-exposure observation periods. Arch Toxicol. 2020.
supplements.
                                                                                        https://doi.org/10.1007/s00204-020-02660-2.
                                                                                  14.   Kreyling WG, Holzwarth U, Hirn S, Schleh C, Wenk A, Schäffler M, Haberl N,
Ethics approval and consent to participate                                              Gibson N. Quantitative biokinetics over a 28 day period of freshly
The study was carried out in agreement with Korean Animal Welfare Act.                  generated, pristine, 20 nm silver nanoparticle aerosols in healthy adult rats
The study was approved by the Hanyang University’s Institutional Animal                 after a single 1½-hour inhalation exposure. Particle Fibre Toxicol. 2020;17:21.
Care and Use Committee (2017-0134A).                                              15.   Sung JH, Ji JH, Park JD, Yoon JU, Kim DS, Jeon KS, et al. Subchronic
                                                                                        inhalation toxicity of AgNPs. Toxicol Sci. 2009;108:452–61.
Consent for publication                                                           16.   Song KS, Sung JH, Ji JH, Lee JH, Lee JS, Ryu HR, et al. Recovery from silver-
Not applicable.                                                                         nanoparticle-exposure-induced lung inflammation and lung function
                                                                                        changes in Sprague Dawley rats. Nanotoxicology. 2013;7:169–80.
Competing interests                                                               17.   Ji JH, Jung JH, Yu IJ, Kim SS. Long-term stability characteristics of metal
The authors declare that they have no competing interests.                              nanoparticle enerator using small ceramic heater for inhalation toxicity
                                                                                        studies. Inhal Toxicol. 2007;19:745–51.
Author details                                                                    18.   ISO/TR 19601. Nanotechnologies-Aerosol generation for air exposure studies
1
 Department of Mechanical Engineering, Hanyang University, Ansan, South                 of nano-objects and their aggregates and agglomerates (NOAA). Geneva:
Korea. 2Aerosol Toxicology Research Center, HCTm CO.,LTD, Icheon, South                 ISO; 2017.
Korea. 3College of Medicine, Chung-Ang University, Seoul, South Korea.            19.   NIOSH (National Institute for Occupational Safety and Health). NIOSH
4
 National Institute for Occupational Health, Johannesburg, South Africa.                Manual of Analytical Method 7302. Elements by ICP (Microwave digestion).
5
 Haematology and Molecular Medicine, University of the Witwatersrand,                   Cincinnati: NIOSH; 2014.
Johannesburg, South Africa. 6Water Research Group, Unit for Environmental         20.   NIOSH (National Institute for Occupational Safety and Health). NIOSH
Sciences and Management, North West University, Private Bag X6001,                      Manual of Analytical Method 8200. In: Elements in Tissues. Cincinnati:
Potchefstroom 2520, South Africa. 7Department of Environmental Medicine,                NIOSH; 2018.
University of Rochester, Rochester, NY, USA. 8HCT CO., LTD, Seoicheon-ro 578      21.   Driscoll KE, Borm PA. Expert workshop on the hazards and risk of poorly
beon-gil, Majang-myeon, Icheon 17383, South Korea.                                      soluble low toxicity particles. Inhal Toxicol. 2020;32(2):53–62.
                                                                                  22.   Morrow PE. Possible mechanisms to explain dust overloading of the lungs.
Received: 14 May 2020 Accepted: 2 January 2021                                          Fundam Appl Toxicol. 1988;10:369–84.
                                                                                  23.   ISO/TR 22019. Nanotechnologies-Considerations for performing
                                                                                        toxicokinetic studies with nanomaterials. Geneva: Interanational
References                                                                              Organization for Standardization (ISO); 2019.
1. Singh SK, Goswami K, Sharma RD, Reddy MV, Dash D. Novel microfilaricidal       24.   Han SG, Lee JS, Ahn K, Kim YS, Kim JK, Lee JH, Shin JH, Jeon KS, Cho WS,
    activity of nanosilver 2012, Second edition. Int J Nanomed. 2012;7:1023–30.         Song NW, Gulumian M, Shin BS, Yu IJ. Size-dependent clearance of gold
Kim et al. Particle and Fibre Toxicology (2021) 18:5 Page 12 of 12
nanoparticles from lungs of Sprague-Dawley rats after short-term inhalation
exposure. Arch Toxicol. 2015;89(7):1083–94.
25. Kreyling WG, Möller W, Holzwarth U, Hirn S, Wenk A, Schleh C, Schäffler M,
Haberl N, Gibson N, Schittny JC. Age-dependent rat lung deposition
patterns of inhaled 20 nanometer gold nanoparticles and their quantitative
biokinetics in adult rats. ACS Nano. 2018;12:7771–90.
26. Kreyling WG, Holzwarth U, Schleh C, Hirn S, Wenk A, Schäffler M, Haberl N,
Semmler-Behnke M, Gibson N. Quantitative biokinetics over a 28 day period
of freshly generated, pristine, 20 nm titanium dioxide nanoparticle aerosols
in healthy adult rats after a single two-hour inhalation exposure. Particle
Fibre Toxicol. 2019;16:29.
27. Kim JK, Jon MS, Kin Y, Kim TG, Shin JH, Kim BW, Kim HP, Lee HK, Ahn K, Oh
SM, Cho WS, Yu IJ. A 28-day inhalation toxicity study with evaluation of
lung deposition and retention of tangled multi-walled carbon nanotubes.
Nanotoxicology. 2020;14(2):250–62.
28. Semmler-Behnke M, Takenaka S, Fertsch S, Wenk A, Seitz J, Mayer P,
Oberdorster G, Kreyling WG. Efficient elimination of inhaled
nanoparticles from the alveolar region: evidence for interstitial uptake
and subsequent Reentrainment onto airways epithelium. Environ Health
Perspect. 2007;115:728–33.
29. Oberdorster G, Ferin J, Morrow PE. Volumetric loading of alveolar
macrophages (am): a possible basis for diminished am-mediated particle
clearance. Exp Lung Res. 1992;18:87–104.
30. Creutzenberg O. Final Report: Toxic effects of various modifications of a
nanoparticle following inhalation Federal Institute for Occupational Safety
and Health: Germany Project No. F 2246; 2013. available at https://www.
scribd.com/document/176183834/Toxic-Effects-of-Various-Modifications-of-
a-NP-Following-Inhalation#:~:text=This%20publication%20is%20the%2
0final%20report%20of%20the,the%20Federal%20Institute%20for%2
0Occupational%20Safety%20and%20Health
31. Liu J, Wang Z, Liu D, Kane AG, Hurt RH. Chemical transformation of
nanosilver in biological environments. ACS Nano. 2012;6(11):9887–99.
32. Wiemann M, Vennemann A, Blaske F, Sperling M, Karst U. Silver
nanoparticles in the Lung: Toxic effects and focal accumulation of silver in
remote organs. Nanomaterials. 2017;7:441.
33. Walker M, Parsons D. The biological fate of silver ions following the use of
silver-containing wound care products – a review. Int Wound J. 2014;11:
496–504.
34. Azodi M, Sultan Y, Ghoshal S. Dissolution behavior of silver nanoparticles
and formation of secondary silver nanoparticles in municipal wastewater by
single particle ICP-MS. Environ Sci Technol. 2016;50(24):13318–27.
Publisher’s Note
Springer Nature remains neutral with regard to jurisdictional claims in
published maps and institutional affiliations.You can also read