Mapletree Commercial Trust - 3Q & YTD FY20/21 Business Updates 27 January 2021
←
→
Page content transcription
If your browser does not render page correctly, please read the page content below

Mapletree Commercial Trust
3Q & YTD FY20/21 Business Updates

                  27 January 2021

                                    0
Important Notice
This presentation is for information only and does not constitute an offer or solicitation of an offer to sell or
invitation to subscribe for or acquire any units in Mapletree Commercial Trust (“MCT” and units in MCT
(“Units”)).

The past performance of the Units and MCT is not indicative of the future performance of MCT or Mapletree
Commercial Trust Management Ltd. (“Manager”). The value of Units and the income from them may rise or
fall. Units are not obligations of, deposits in or guaranteed by the Manager or any of its affiliates. An
investment in Units is subject to investment risks, including the possible loss of the principal amount
invested. Investors have no right to request the Manager to redeem their Units while the Units are listed. It is
intended that unitholders may only deal in their Units through trading on the SGX-ST. Listing of the Units on
the SGX-ST does not guarantee a liquid market for the Units.

This presentation may also contain forward-looking statements that involve risks and uncertainties. Actual
future performance, outcomes and results may differ materially from those expressed in forward-looking
statements as a result of risks, uncertainties and assumptions. Representative examples of these factors
include general industry and economic conditions, interest rate trends, cost of capital, occupancy rate,
construction and development risks, changes in operating expenses (including employee wages, benefits
and training costs), governmental and public policy changes and the continued availability of financing. You
are cautioned not to place undue reliance on these forward-looking statements, which are based on current
view of management on future events.

Nothing in this presentation should be construed as financial, investment, business, legal or tax advice and
you should consult your own independent professional advisors.

                                                                                                                    1
Content
Key Highlights Page 3
Financial Performance Page 6
Portfolio Updates Page 10
Outlook Page 19
2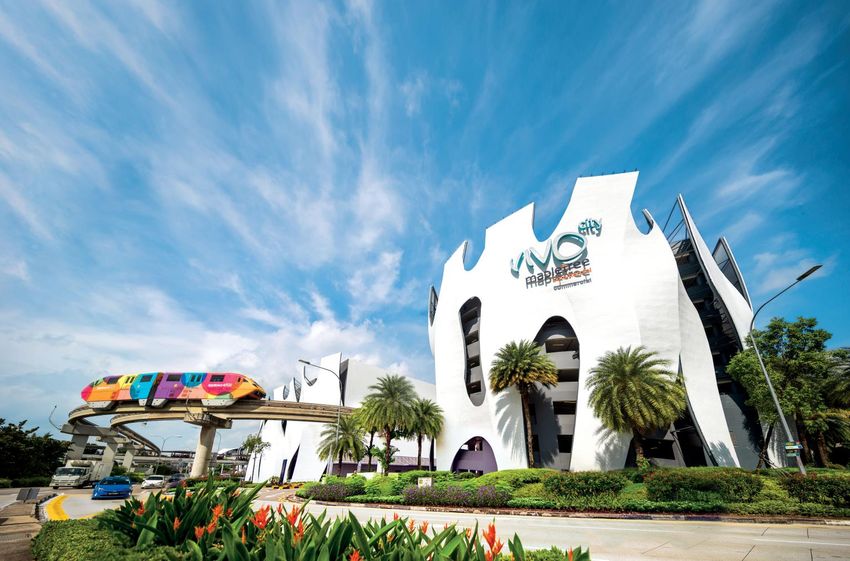
Key Highlights

                 VivoCity
Key Highlights
Financial Performance
YTD FY20/21 gross revenue and net property income (“NPI”) down 1.9% and 1.2%
respectively mainly due to COVID-19 rental rebates for eligible tenants but offset by
contribution from Mapletree Business City (“MBC”) II
Portfolio Performance
Progressive recovery of shopper traffic and tenant sales at VivoCity since Phase
Two of Singapore’s re-opening, further boosted by festivities in 3Q FY20/21
Revitalised F&B cluster on Level 1 well-received by shoppers since its progressive
opening from September 2020
Existing tenant, adidas, expanded its footprint to introduce adidas Originals’ largest
flagship store in Southeast Asia
Portfolio achieved 98.1% committed occupancy
MBC continues to be an anchor of stability
4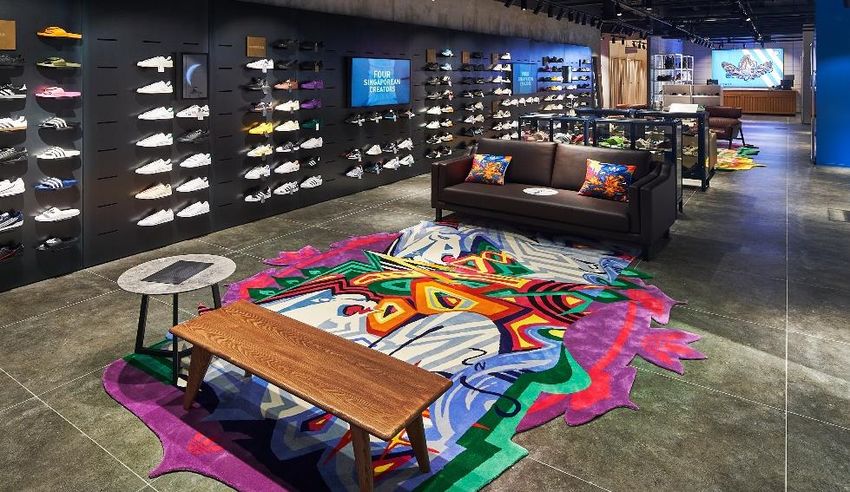
Key Highlights
Capital Management
Proactive and prudent capital management continues to prioritise financial flexibility
and liquidity
Facilities in place to refinance all borrowings due in FY21/22
Well-distributed debt maturity profile with no more than 24% of debt due for
refinancing in any financial year
5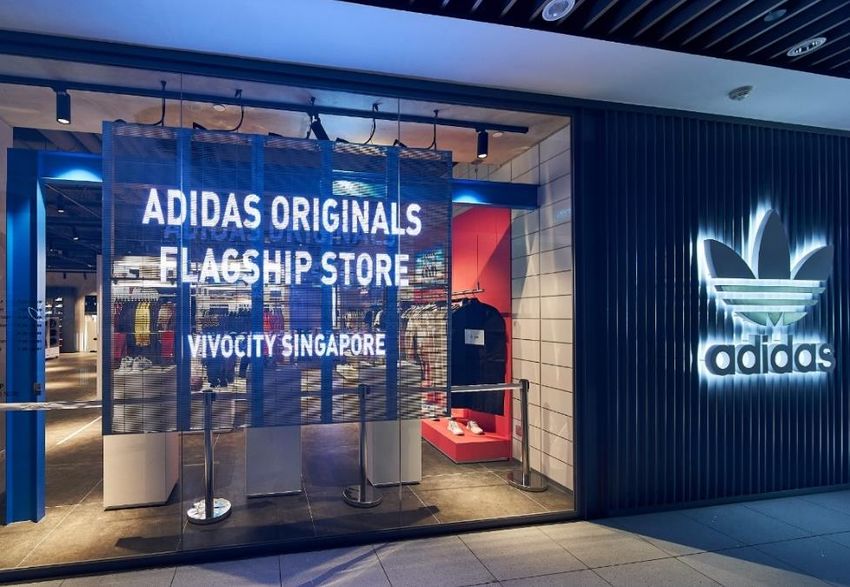
Financial
Performance

         VivoCity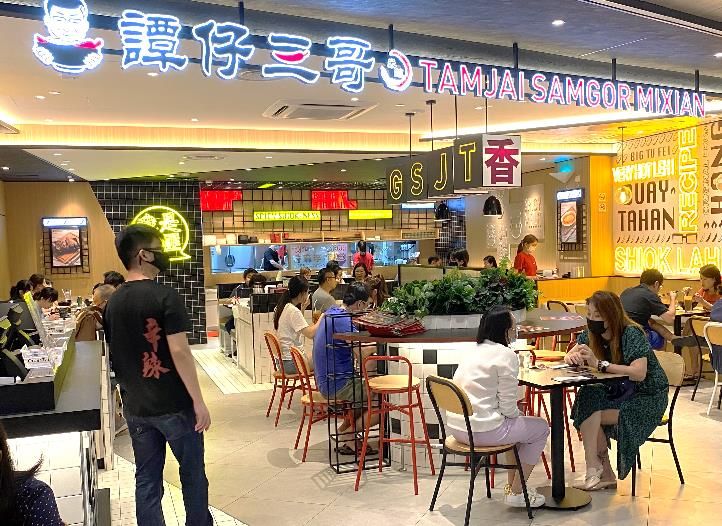
YTD FY20/21 Financial Scorecard
            YTD FY20/21 gross revenue and NPI down 1.9% and 1.2% respectively mainly due to
             COVID-19 rental rebates for eligible tenants but offset by contribution from MBC II

                Gross Revenue                                     Property Expenses                           Net Property Income
                          1.9%                                               4.4%                                        1.2%

                355.5           348.7
                 15.0            14.8                                                                           279.41      275.91
                 23.1            25.8                                                                            12.0           12.0
                 38.0            30.5                   80.0          76.11                                      18.1           20.8
                                                        76.0                         72.8                        28.7
                 14.9                                   72.0           3.0                                                      22.3
                                                                       5.0           2.8
(S$ mil)                         63.8                (S$68.0
                                                         mil)                        4.9           (S$ mil)      12.0
                                                        64.0           9.3                                                      51.8
                 99.0                                   60.0                         8.2
                                                        56.0           2.9
                                                        52.0                         12.0                        82.0
                                                        48.0          16.9
                                 96.5                   44.0
                                                        40.0                                                                    80.5
                                                        36.0                         16.0
                                                        32.0
                                                        28.0
                165.5                                   24.0
                                                        20.0          39.1                                      126.5
                                117.3                   16.0                         28.9                                       88.4
                                                        12.0
                                                         8.0
                                                         4.0
                                                         0.0
            YTD FY19/20 YTD FY20/21                               YTD FY19/20    YTD FY20/21                  YTD FY19/20 YTD FY20/21

                                 VivoCity          MBC I           MBC II       mTower2     Mapletree Anson      MLHF

           1. Total does not add up due to rounding differences
           2. Former PSA Building
                                                                                                                                        7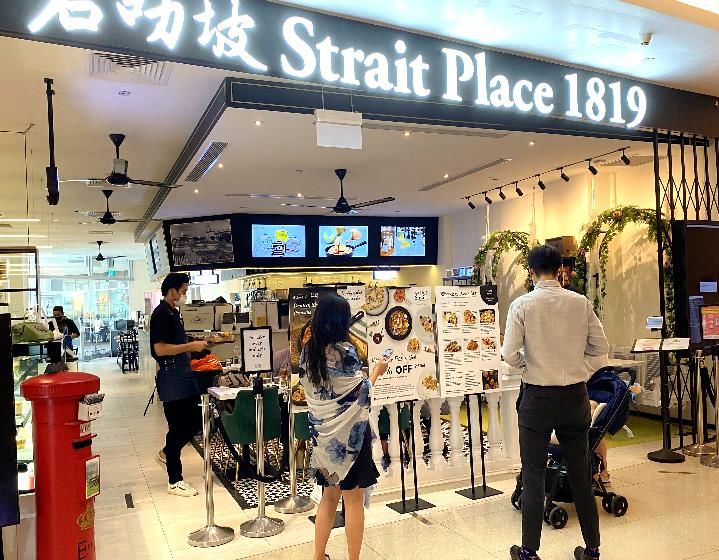
Key Financial Indicators
                                     Maintained robust balance sheet
             Every 25 bps change in Swap Offer Rate estimated to impact DPU by 0.06 cents p.a.

                                                               As at                                As at                                As at
                                                         31 December 2020                     30 September 2020                    31 December 2019
Total Debt Outstanding                                        S$3,002.9 mil                        S$2,998.9 mil                        S$3,014.2 mil

Gearing Ratio                                                      34.0%1                                33.8%                                33.4%
Interest Coverage Ratio
                                                                 4.2 times                            4.0 times                            4.5 times
(12-month trailing basis)
% Fixed Rate Debt                                                   71.4%                                71.5%                                75.3%
Weighted Average All-In Cost
                                                                   2.51%3                               2.57%4                               2.96%5
of Debt (p.a.)2

Average Term to Maturity of Debt                                 4.4 years                            4.5 years                            4.4 years

Unencumbered Assets as %
                                                                    100%                                 100%                                 100%
of Total Assets
MCT Corporate Rating
                                                            Baa1(negative)                       Baa1(negative)                         Baa1(stable)
(by Moody’s)
1.   Based on total gross borrowings divided by total assets. Correspondingly, the ratio of total gross borrowings to total net assets is 53.6%
2.   Including amortised transaction costs
3.   Annualised based on YTD ended 31 December 2020
4.   Annualised based on 1H ended 30 September 2020
5.   Annualised based on YTD ended 31 December 2019
                                                                                                                                                        8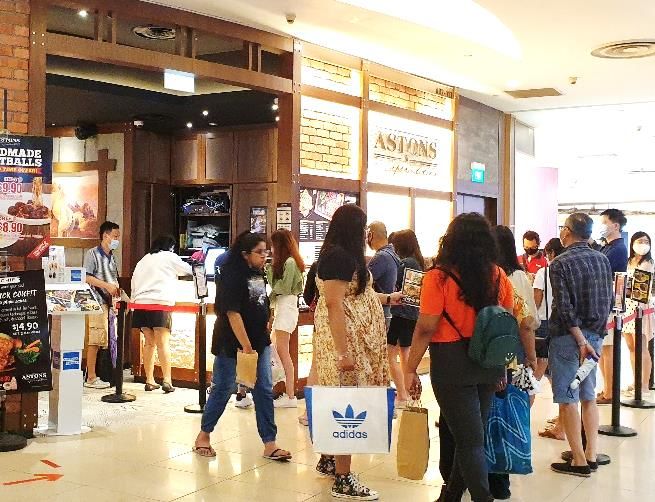
Debt Maturity Profile (as at 31 December 2020)
Financial flexibility from more than S$500 mil of cash and undrawn committed facilities
Well-distributed debt maturity profile with no more than 24% of debt due in any financial year
Total gross debt: S$3,002.9 mil
Facilities in place to refinance all borrowings due in FY21/22
800 Bank Debt
725.0 Medium Term Note
700
625.0
600
Gross Debt (S$ mil)
500 489.9
550.0
400
505.0
289.9
300
255.0
488.0
200
170.0
250.0
100 200.0 175.0
85.0 120.0 100.0
70.0
0
FY20/21 FY21/22 FY22/23 FY23/24 FY24/25 FY25/26 FY26/27 FY27/28 FY28/29 FY29/30
% of
Total Debt - 2% 16% 9% 21% 17% 24% 3% - 8%
9Portfolio
Updates
Mapletree Business City IPortfolio Occupancy
Achieved healthy committed occupancy of 98.1%
December 2020
December 2019 September 2020
Actual Committed1
VivoCity 99.2% 96.0% 96.9% 99.5%
MBC I 99.7% 97.9% 95.2% 98.2%
MBC II 99.4% 100% 99.9% 100%
mTower 89.1% 69.7%2 71.1%2 88.4%
Mapletree Anson 97.0% 100% 100% 100%
MLHF 100% 100% 100% 100%
MCT Portfolio 98.3% 95.3% 94.7% 98.1%
1. As at 31 December 2020
2. Mainly due to the expiry of a major tenant’s short-term lease on 31 August 2020
11Lease Expiry Profile (as at 31 December 2020)
Portfolio resilience supported by manageable lease expiries
WALE Committed Basis
Portfolio 2.5 years1
Retail 2.1 years
Office/Business Park 2.8 years
21.9%
As % of Gross Rental Income
13.5% 12.8%
12.5%
10.7%
8.6% 8.2%
7.2%
2.5% 2.1%
FY20/21 FY21/22 FY22/23 FY23/24 FY24/25
FY24/25
& beyond
Retail Office/Business Park
1. Portfolio WALE was 2.1 years based on the date of commencement of leases
12VivoCity – Shopper Traffic and Tenant Sales
1Q FY20/21 impacted by ten weeks of mandatory business closures 1
Progressive recovery since Phase Two of re-opening from 19 June 2020 further boosted by
festivities in 3Q FY20/21
Shopper Traffic (mil) Tenant Sales (S$ mil)2
56.1% 31.1%
800.0
714.13
50.0 700.0
45.0 41.2 600.0 270.3
40.0 492.0
35.0 500.0
14.1
30.0 400.0
232.2
25.0
235.0
20.0 14.0 18.1 300.0
15.0 8.5 200.0
183.3
10.0
13.1 6.8 100.0 209.3
5.0
2.8 76.5
0.0 0.0
YTD FY19/20 YTD FY20/21 YTD FY19/20 YTD FY20/21
1Q 2Q 3Q
1. Refers to circuit breaker from 7 April to 1 June 2020 and Phase One easing of circuit breaker from 2 to 18 June 2020 during which the majority of
businesses were closed
2. Includes estimates of tenant sales for a small portion of tenants
3. Total does not add up due to rounding differences
13VivoCity – Progressive Recovery in Shopper Traffic and Tenant Sales
Rebound in tenant sales continued to outpace shopper traffic
But COVID-19 protocols continue to be in place and pose disruptions
Monthly Shopper Traffic and Tenant Sales
(rebased against 2019)
100% Heightened
safe distancing
90% measures
Closure of
80% international
borders
70% Phase Two of
circuit breaker
60% re-opening
Start of
50% circuit breaker Phase Three of
re-opening.
40% Measures such as
border closures
30% and work-from-
home directives
remain
20%
10%
0%
Mar 2020 Apr 2020 May 2020 Jun 2020 Jul 2020 Aug 2020 Sep 2020 Oct 2020 Nov 2020 Dec 2020
Shopper Traffic Tenant Sales
14Assisting Our Tenants to Weather the COVID-19 Headwinds
Rendered approximately S$70 mil1 of rental assistance since the start of the pandemic
To help eligible retail tenants offset on average more than 4 months of their fixed rents
Average quantum of rental rebate/waiver
Period
for eligible tenants
March 2020 ~0.5 month
1Q FY20/21 ~2.8 months
2Q FY20/21 ~0.7 month
3Q FY20/21 ~0.2 month2
February March April May June December
7 February 2020 23 March 2020 7 April – 1 June 2020 2 June 2020 From 28 December 2020
Government No entry or transit Circuit breaker period Easing of circuit breaker Further easing of circuit
raised through Singapore • All non-essential industries and retail Phase One: breaker
DORSCON level for all short-term shall be closed Safe Re-opening – majority of Phase Three: Safe Nation
from yellow to visitors • The public is required to stay at home business continued to be closed – increased capacity limits
orange unless for essential services for events and activities
From 19 June 2020
Further easing of circuit breaker Measures such as border
Phase Two: Safe Transition – closures and work-from-
most businesses allowed to home directives remain
resume operations
1. Refers to assistance for eligible retail tenants granted and/or announced to date, and includes the passing on of property tax rebates, cash grants from the
government and other mandated grants to qualifying tenants
2. The assistance for each tenant is calibrated based on their respective actual sales performance and subject to tenant’s acceptance
15VivoCity – Revitalised F&B Cluster on Level 1
Well-received by shoppers since its progressive opening from September 2020
Entire exercise to deliver ~30% ROI on stabilised basis1
Before
Artisan
Boulangerie
Co
Starbucks
Jamie’s
Italian
Shake Shack – Widely popular American burger joint Green Common –Novel concept championing
known for its delicious burgers and milkshakes sustainable consumption of plant-based products
After
Hoshino Coffee – Japanese-western fusion café Afuri Ramen – Japanese ramen shop well-
featuring hand-dripped coffees and soufflé pancakes known for its signature yuzu-based broth
1. Based on estimated capital expenditure of approximately S$700,000
16VivoCity – Expansion by Existing Tenant
Novel flagship stores by adidas further define VivoCity’s position as key destination mall
adidas Originals doubled its footprint to ~6,000 square
feet on Basement 1, creating its largest flagship store in
Southeast Asia
Carries the most extensive collection including
exclusive and limited editions, as well as
collaborative statement pieces by famed designers
First in Singapore with a dedicated sneakers
collectors lounge
Reopened on 18 December 2020
Work in progress to introduce another adidas flagship
store on Level 1 by 1Q FY21/22 Image courtesy of adidas
Image courtesy of adidas
17VivoCity – Refreshing Tenant Mix
Spicing up VivoCity with new and popular F&B concepts
TamJai SamGor Mixian – Michelin Bib Gourmand Pizzakaya – Pizzeria and café offering HEYTEA – Bubble tea chain best-known for
Noodle House specialising in Yunnan noodles Japanese-style and classic pizzas pioneering the cheese tea trend
Strait Place 1819 – Innovative concept that gives a Astons Specialties – Homegrown steakhouse well- The Original Boat Noodle – Authentic halal Thai
modern spin on Singapore’s favourite dishes loved for its affordable steaks and western cuisine street food famed for its bite-sized noodles bowls
Note: The above only represents a portion of tenants that were introduced in 3Q FY20/21
18Outlook
Bank of America Merrill Lynch HarbourFrontOutlook
Singapore Economy
Based on the Ministry of Trade and Industry’s (“MTI”) advance estimates, the Singapore economy
contracted by 3.8% on a year-on-year basis in the fourth quarter of 2020, an improvement from the
5.6% contraction in the third quarter. On a quarter-on-quarter seasonally-adjusted annualised basis,
the economy grew by 2.1% in the fourth quarter, following the 9.5% expansion in the third quarter. For
the whole of 2020, the Singapore economy contracted by 5.8%.
Retail
According to CBRE, the retail sector remained challenged with continued social distancing measures
and border closures. Nonetheless, compared to the previous quarter, there was greater positivity with
shopper traffic recovering to about 60%-80% of pre-COVID-19 levels.
The prioritising of occupancy by landlords has resulted in more realistic rental expectations,
particularly for spaces in secondary locations and floors.
Although the economy is stabilising and Phase 3 of re-opening will lend some positivity to the retail
sector in 2021, hiring sentiments remain cautious and there are still uncertainties on how the global
pandemic will pan out. The sector will continue to remain under pressure and market recovery could
be long and uneven.
Sources: The Singapore Ministry of Trade and Industry Press Release, 4 January 2021 and CBRE MarketView Singapore Q4 2020
20Outlook
Office
Demand remained relatively weak towards the end of 2020. The lower occupancy of new
developments and the impact from COVID-19 have led to higher vacancy rates in Q4 2020.
The impending rise in vacancy has led to continued downward pressure on office rents. In view of the
pandemic, demand is likely to remain subdued in 1H 2021. However, spots of demand could come
from Chinese technology companies and non-bank financial services firms. Displaced tenants from
upcoming redevelopment projects will also contribute to occupier activities.
The market is poised to benefit from employment gains should economic activities and business
sentiments improve with the rolling out of COVID-19 vaccine. With limited Grade A supply in 2021,
there are prospects for rents to turn upwards by 2H 2021.
Business Park
The business park market continued to deliver a resilient performance towards the end of 2020,
primarily contributed by a pick up in demand in the Rest of Island submarket.
Renewals continued to feature prominently in leasing activities. For the whole of 2020, the technology
sector was a demand driver especially for the City Fringe submarket.
With continued support by high-tech industries, demand for business parks will remain steady.
However, with limited supply within the City Fringe submarket, more transactions may occur in the
outlying decentralised areas.
21Outlook
Overall
Notwithstanding the Phase Three easing of circuit breaker and the availability of COVID-19 vaccine,
there are continued uncertainties posed by COVID-19 on the overall sector, including weaker
economic sentiments, continued border closures, work-from-home directives and social distancing
measures, as well as lower prospective demand for commercial space. Potential challenges could
also arise when the COVID-19 impact hits in full force after the end of government support.
MCT’s focus remains to maintain a healthy portfolio occupancy and sustainable rental income by
working closely with our tenants. MCT will also continue to be proactive and nimble in implementing
appropriate measures such as assisting tenants, managing costs and mitigating the impact from
further disruptions, while supporting the authorities’ effort in containing the outbreak.
Anchored by a well-diversified portfolio with key best-in-class assets, MCT is expected to derive
stable cashflows from high quality tenants. MCT’s resilience will position us well to ride through the
pandemic.
22Thank You
For enquiries, please contact:
Teng Li Yeng
Investor Relations
Tel: +65 6377 6836
Email: teng.liyeng@mapletree.com.sg
23You can also read