Mapping Migration across Generations - Gerrit Bloothoo a, David Onlanda and Jan Pieter Kunstb - Ubiquity Press
←
→
Page content transcription
If your browser does not render page correctly, please read the page content below
CHAPTER 29

            Mapping Migration across Generations
        Gerrit Bloothoofta , David Onlanda and Jan Pieter Kunstb
                    a Utrecht institute of Linguistics – OTS, Utrecht University,
                              b Meertens Institute KNAW, Amsterdam,

                             Corresponding author: g.bloothooft@uu.nl

                                                ABSTRACT
       Flexible software has been developed for the interactive mapping of socio-cultural phenom-
       ena in the Netherlands on the web. The possibilities of such software are demonstrated for
       the mapping of migration in the Netherlands across four generations. Both the origin and
       dispersion of the population can be explored at the geographic levels of municipality, region,
       dialect area and province.

                                         29.1    Introduction

Most people leave their parental home as adolescents, taking with them their cultural capital,
including language. If they remain close to their parents, family and social networks, local and
regional traditions may endure. However, when there is a significant amount of long-distance
migration, intercultural interactions may result in changes in their behaviour and identification. To
understand such socio-cultural changes, including for instance dialectal variation, it is of interest
to know how the composition of a population in a place or region varies over time and to visualise
this complex process in an insightful way. Such a presentation requires both migration data and
mapping software.
  For the description of migration, full population data for the Netherlands was available, includ-
ing place and year of birth, place of residence in 2006 and, most importantly and uniquely, family
relations across four generations. These data can be used to show the roots of the inhabitants of
any municipality (or a larger geographical entity) and their ancestors for up to four generations
(great-grandparents) by means of place of birth (origin maps). Conversely, we can start with the
inhabitants who were born in a municipality between 1880 and 1900 and trace the dispersion of
their descendants over the following three generations both by means of the birthplace and place

How to cite this book chapter:
Bloothooft, G, Onland, D and Kunst, J.P. 2017. Mapping Migration across Generations. In: Odijk, J
    and van Hessen, A. (eds.) CLARIN in the Low Countries, Pp. 351–360. London: Ubiquity
    Press. DOI: https://doi.org/10.5334/bbi.29. License: CC-BY 4.0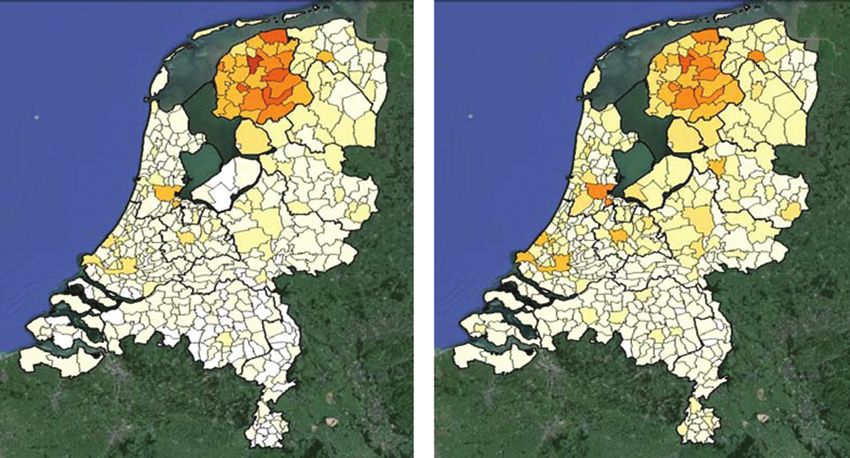
352     CLARIN in the Low Countries

of residence in 2006 – these are the dispersion maps. For the visualisation of migration processes,
mapping software has been developed., The software was designed for flexible online visualisa-
tion of linguistic-cultural phenomena in general, including an easy selection interface. The current
application on migration is a demonstration of the possibilities of this software, and is available at
www.meertens.knaw.nl/migmap. In the following sections, the properties of the underlying data
are described, as well as the presentation options for migration maps, including some examples. A
technical description of the mapping software is given in the appendix.

                                                29.2    Data

                                         29.2.1 Population Data

We investigated and mapped migration on the basis of the date and place of birth as well as the
postal code of Dutch nationals in 2006. These data were a subset of the information which was
made available to the Meertens Institute KNAW and Utrecht University from the Civil Registration
(GBA, municipal personal records database) for onomastic research.1 The full corpus encompasses
22,274,761 individuals, including all 15.6 million Dutch nationals who lived in the Netherlands in
2006, and 6.6 million of their ancestors. For each individual alive in or after 1994 (the start of GBA
digitisation; see Prins and Kuijper, 2007) information on both parents was also available (includ-
ing their date and place of birth). On this basis, and through linking across generations, relations
between up to four generations could be established in so far as the ancestors or descendants were
part of the corpus.
   As the first generation of interest we chose the 4.6 million individuals who were between 30 and
50 years of age in 2006. This is the age when families are usually settled, children are raised and
most people stay in the same place. For this generation, 3.8 million parents, 3 million grandpar-
ents and 1.2 million great-grandparents are known. Because people share ancestors, it cannot be
determined what part of the total number of ancestors are covered by the data. But, at the level of
parents, the coverage should be fairly complete since in most cases the person–parent relationship
is known through identifiers. Parents that died before 1994 have no personal record, which means
that their parents (i.e. the grandparents of the first generation) will in turn be unknown. We esti-
mate that a coverage of 95% at the grandparent level is realistic. Great-grandparents are only known
for grandparents alive in 1994, and we estimate that the coverage at this level is around 50%. In all,
these figures suggest a sample that is sufficiently large to map migration. A comparison of the total
number of births since 1880 as provided by Netherlands Statistics (CBS) and those reconstructed
from the Civil Registration is presented in Figure 29.1.
   Conversely, we started with 1.4 million individuals born in the Netherlands between 1880 and
1900. Based on birth figures from Netherlands Statistics we estimate this to be 60% of all births dur-
ing this period, after correction for infant mortality. As the Civil Registration is fairly complete for
births after around 1945, we assume that most descendants living in 2006 are present in our corpus:
the result is 3.8 million children, 4.9 million grandchildren and 5.5 million great-grandchildren.

                                29.2.2   Geographic Levels of Presentation

The mapping of migration is always done at the level of municipalities, with the administrative
situation in January 2007, when there were 443 municipalities, as a baseline. However, different
geographic areas may be chosen as the basis for the search question. The largest of these is that of

 1
      See the Dutch corpus of first names at www.meertens.knaw.nl/nvb and the Dutch corpus of family names at
      www.cbgfamilienamen.nl/nfb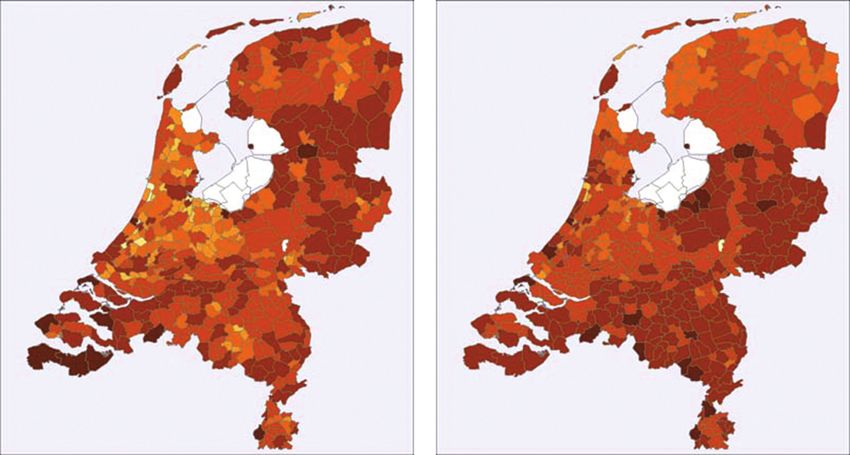
Mapping Migration across Generations          353

                         300

                         250

                         200
        Births (x1000)

                         150

                         100

                         50

                          0
                           1880   1900     1920          1940          1960          1980          2000

Figure 29.1: Number of births in the Netherlands according to Netherlands Statistics (black line)
  and number of births of individuals derived from the digitised Civil Registration (grey line).
  Differences in recent years (about 3%) result from the requirement of Dutch nationality in our
  data selection.

the 12 provinces of the Netherlands. At a more detailed level, we have the 40, so-called COROP
regions,2 which are defined on the basis of a central core and a certain homogeneity of their popula-
tion. Another option is the presentation at the level of 24 dialect areas, as defined by Daan and Blok
(1969), projected on the municipalities of 2007. For example, it is possible to see where the grand-
parents of current inhabitants (the latter of whom are 30–50 years old) of the province of Drenthe
were born. The result will be presented at the municipal level, including within the province of
Drenthe itself.
   The choice to use the level of 443 municipalities in 2007 as a reference meant that we had to
map places of birth to the corresponding 2007 municipalities.3 Fortunately almost all changes in
municipal boundaries have been reductions of the number of municipalities through mergers and
annexations, and therefore did not pose a problem. In a few cases, however, municipalities were
split up or only partially annexed by a neighbouring municipality; as specific birth addresses were
not known this could not be repaired.4
   Another complication are hospital births. These accounted for 30% of all deliveries in 1968
(De Haas-Posthuma and De Haas, 1968), increasing to 77% in 2002 (Anthony et al., 2005).
When the hospital is not in the municipality of the parental home, this confounds the results.
No statistics of this effect are available, although it is likely to be small for the older genera-
tions, for which delivery at home was the standard. For the youngest generations (especially the

 2
     COROP refers to Coördinatie Commissie Regionaal OnderzoeksProgramma. The COROP areas correspond to the level
     3 of the European Nomenclature of Territorial Units for Statistics (NUTS3).
 3
     See www.bprbzk.nl/BRP/Informatiebank/publicaties.rvig.nl/Landelijke tabellen/Landelijke tabellen 32 t m 60
     excl tabel 35/Landelijke Tabellen 32 t m 60 in csv formaat.
 4
     Only in the case of Ermelo (split into Ermelo and Nunspeet in 1972) did we keep the original undivided municipality.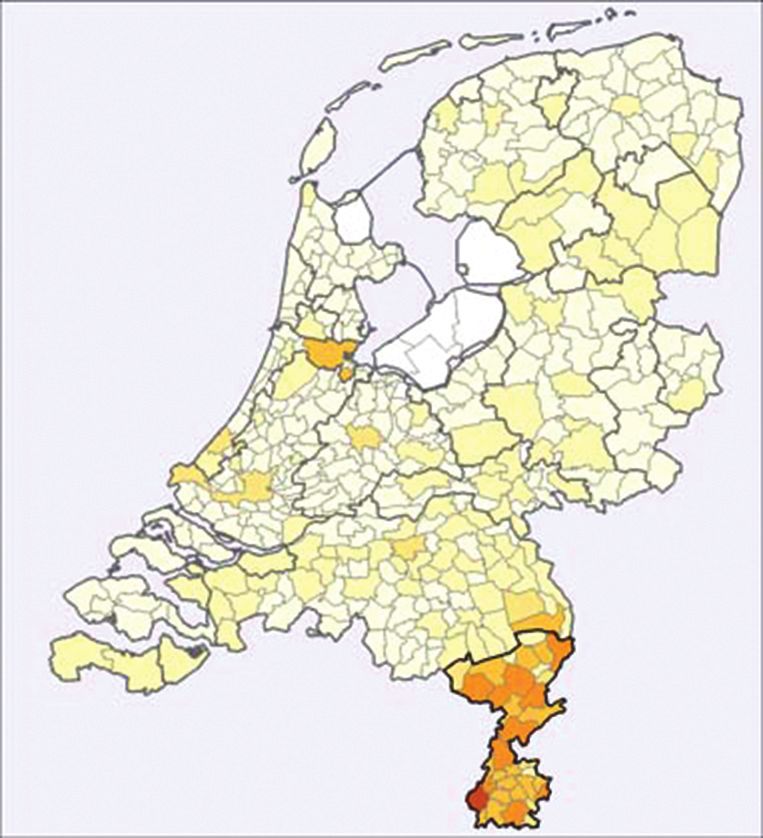
354   CLARIN in the Low Countries

great-grandchildren) it is advisable to consider the place of residence during childhood, as this
may give a better indication of the parental home at the time of birth. An example is the traditional
village of Bunschoten, of which 44.3% of the great-grandchildren were born in the village itself and
23.6% in the nearby city of Amersfoort, while 62.6% live in Bunschoten and only 5.3% in Amers-
foort. Not surprisingly Bunschoten has no hospital within its boundaries, while the nearest large
hospital is in Amersfoort. In this case the figures for residence are likely more representative of the
parental home during birth.
  For places of birth outside the Netherlands (relevant for origins) we give percentages for major
immigration countries in a separate list presented on the map. These are Belgium, Germany,
Turkey, Morocco, Surinam, Netherlands Antilles, Dutch East Indies or Indonesia, Other (Europe),
and Other (World).

                            29.3    Migration Maps Per Generation

Migration is visualised in maps by generation. Starting with a target group, the maps show the
spread across the country for each generation of ancestors or descendants in a percentage per
municipality, represented by a colour gradient on a (partly) logarithmic scale with ranges of 0,
0.001, 0.01, 0.5, 1, 2, 4, 8, 16, >32 %. By using mouse-over the actual percentage per municipality
is shown.
   By choosing to represent time through generation the family relation becomes clear, but the
disadvantage is that the time periods may become increasingly longer for earlier (or later) genera-
tions or even overlap. This could imply that the same motives for migration may apply for different
generations when they share, for instance, the same socio-economic conditions in some period of
time. For the map showing origins (places of birth), the initial generation is born between 1957
and 1977 (a period of 20 years), the parents were born roughly between 1922 and 1952 (30 years),
the grandparents between 1887 and 1927 (40 years), and the great-grandparents between 1852 and
1902 (50 years). Conversely, dispersion maps show the places of birth or residence of descendants,
for an initial generation born between 1880 and 1900 (which is not shown in maps as most of them
were deceased in 2006), children between 1905 and 1935, grandchildren between 1930 and 1970,
and great-grandchildren between 1955 and 2007.
   Percentages are calculated relative to the current number of inhabitants of a municipality (or any
other available geographic entity) or the number of known ancestors per generation. It is assumed
that the geographical distribution of the known individuals is representative of that of the larger
population. While the coverage of generations is high enough in the Netherlands to consider this
assumption to be valid, deviations will occur when parents are born in foreign countries. In that
case the coverage of older generations is poor and their share will be underestimated. For example,
in 2006 in Amsterdam 8.8% of the inhabitants between 30 and 50 years of age were born in Surinam.
For their parents this is a still somewhat realistic 7.8%, but for their grandparents – who most
likely lived in Surinam as well – the percentage drops to 2.6%, because information about most
of them is not available in the Dutch Civil Registration; for great-grandparents this is an even
lower 0.47%.
   The migration maps are based on average figures per place of birth or residence in 2006. No
individual migration history can be deducted from them. But at an aggregate level, a comparison
of maps can illustrate moving patterns over time. For place of birth it should be kept in mind that
this is an indication of the place of residence of the parents. A comparison of two subsequent origin
maps (from older to younger generation) therefore shows – at an aggregate level – the migration
between the parents’ own birth place and their place of residence at the time children were born.
This type of migration (leaving the parental home and starting a family) is among the most dom-
inant in the life-course of individuals (see for example Kley, 2011). In addition, a comparison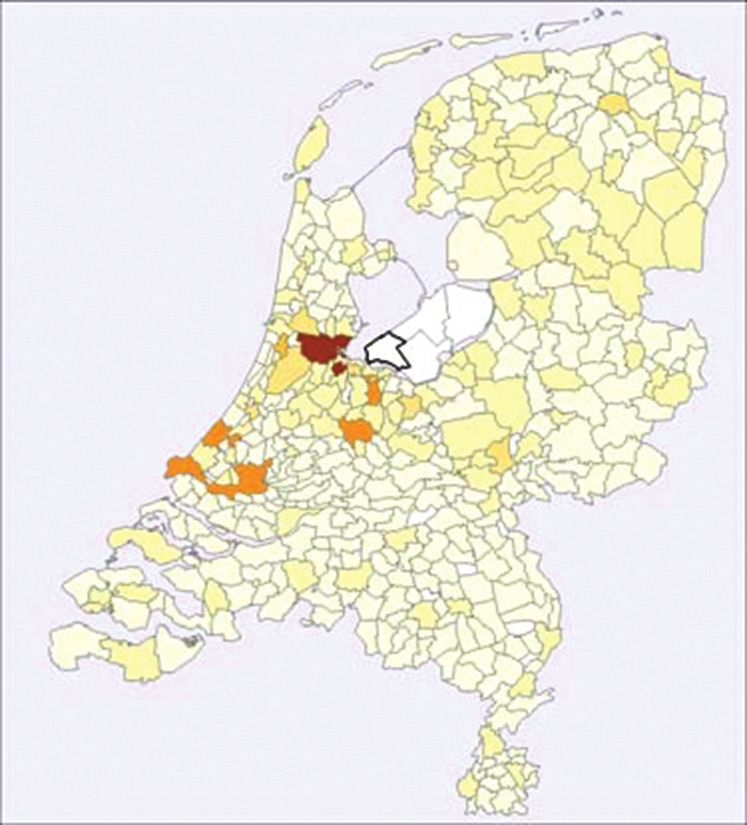
Mapping Migration across Generations 355
between the dispersion maps on the basis of place of birth and place of residence gives an indication
of the move pattern during the (later) lifetime of people. For the older generations, especially, the
place of residence in 2006 will be the final in life.
As a summary of how far people move between generations, the average distance between the
places of birth or residence and the target area is calculated per generation. Because the distribution
of these movements is positively skewed to higher distances, the median distance is used. This
figure is only calculated for those individuals who do not live in the target area anymore. In addition
the percentage of the population that did stay is shown for each generation.
It would be too complicated to include every possible gender combination for different gen-
erations. Nevertheless we provide results for the full female and male family lines, that is:
mothers, grandmothers and great-grandmothers for women; and fathers, grandfathers and great-
grandfathers for men. By comparing male and female lines the effect of gender on migration can
be studied.
29.4 Implementation and Examples
In this section we present some typical examples of the results which show the rich possibilities
for exploration of migration, and the options for presentation and output. The examples stem
from the border municipality of Emmen; the very traditional, religious village of Bunschoten-
Spakenburg; and the town of Almere in the newly reclaimed polder of South-West Flevoland. At
a larger geographic scale the migration patterns for the province of Friesland and for the area of
the Limburgish dialect are shown. Finally, the level of migration across the Netherlands can be
made visible by the percentage of great-grandparents and great-grandchildren that were born in
the same municipality: the lower this percentage, the more migration has taken place.
Figure 29.2 shows a screenshot with the origin maps of the grandparents of those inhabitants
of the municipality of Emmen that are between 30 and 50 years old. In the main map the origin
percentages for foreign countries are shown as well, while the percentage per municipality is given
as a mouse-over effect. The maps for the other generations are shown in a smaller size on the side
which, when clicked, switch places with the main map. The simultaneous presentation of maps
for four generations facilitates the understanding of migration patterns over roughly a century. By
clicking a municipality the corresponding map will be shown, which allows for a fast comparison
of migration patterns between different municipalities. On the right-hand side is the menu with
options to choose one of the 443 municipalities, 40 COROP regions, 24 dialect areas or 12
provinces. The generation, gender line and type of map (origin or dispersion) can also be chosen.
In the right lower corner, some overall statistics are presented.
We can see a typical dispersal pattern in Figure 29.2, with the largest group of grandparents born
in Emmen itself (32.1%) and a rapidly decreasing share the further a municipality lies from the
town. The four nearest municipalities together account for 18.5%, indicating that moving houses
in the region itself is highly preferred. The big cities in the west of the country together account for
4.8% while the northern city of Groningen has a share of 1.3%. Of interest in this border town
are the grandparents born in Germany, constituting a relatively low cross-border migration of
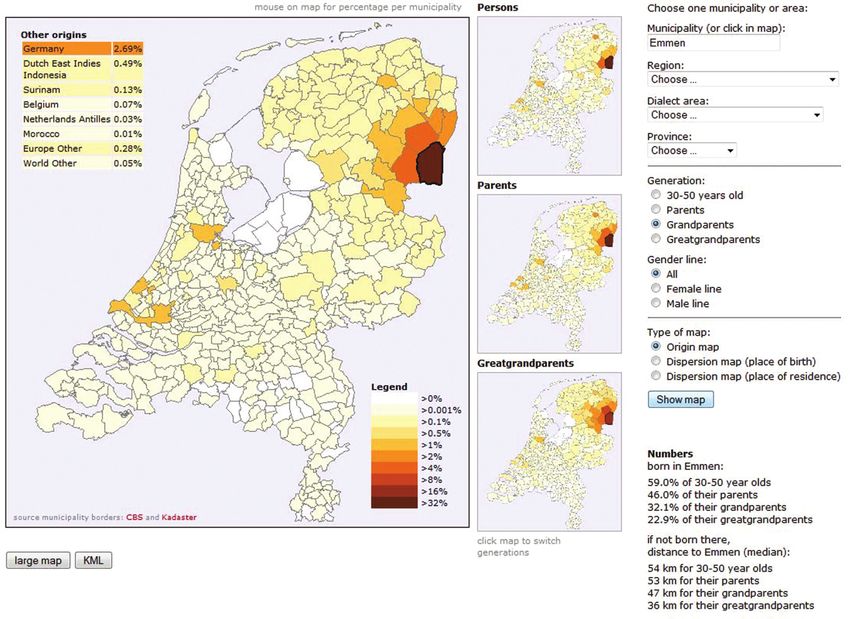
2.7%. Figure 29.3 demonstrates the origin and dispersion of the traditional and religious village
of Bunschoten-Spakenburg, where over two-thirds of the fourth generation were born or still live.
The visualisation allows us to quickly see that this is a municipality with little movement in or out
over the last century, with the exception of the population concentration in the four major cities in
the west of the country.
The opposite effect can be found in Figure 29.4, which presents the roots of inhabitants of the
newly developed town of Almere (founded in 1976). This town was intended to house the quickly
increasing population, especially from the nearby capital of Amsterdam, in which city 28% of356 CLARIN in the Low Countries Figure 29.2: Screenshot of the origin maps of the grandparents of the inhabitants of the munici- pality of Emmen who are 30–50 years of age. Note that the central polders were not yet reclaimed at the birth of this grandparent generation. (The colour legend is valid for all figures.) Figure 29.3: Origin and dispersion for the traditional village of Bunschoten-Spakenburg. Left- hand panel: birth place of great-grandparents (50% in the village); right-hand panel: places of residence of great-grandchildren (63% in the village).
Mapping Migration across Generations   357

Figure 29.4: Birth places of parents of citizens of Almere, created in 1976 in the newly reclaimed
  polder of South-West Flevoland.

Figure 29.5: Origin and dispersion of inhabitants for the province of Friesland, projected on
  Google Earth. Left-hand panel: birth place of inhabitants who are 30–50 years of age (in 2006);
  right-hand panel: places of residence of great-grandchildren of inhabitants born 1880–1900.

the inhabitants of Almere were born. Another significant portion of the inhabitants were born
in Surinam (10%) and in other foreign countries (13.9%).
  Maps can be exported in KML format and projected on Google Earth. Figure 29.5 gives an exam-
ple for origins and dispersion of inhabitants of the province of Friesland. This province has a strong
identity, expressed by its own language. For all ancestral generations about 70% of the generation
were born in Friesland itself, which is the highest percentage in the Netherlands. For descendants,
70% of the great-grandchildren were born in Friesland as well.
358   CLARIN in the Low Countries

  Another approach, which is of linguistic interest, is a look into the origins of the population of
a dialect area. This is shown in Figure 29.6 for the area of Limburgish, where 57% of the great-
grandparents of the current population were born in the area. A strong border effect is noticeable
as well, with the share of German ancestors at 6.5%, several times higher than in other border
regions.
  A special option is the possibility to show the percentage of a generation that were born in the
same municipality as their furthest ancestors or descendants. By choosing ‘alle gemeenten’ (‘all
municipalities’) the site gives an overview of the extent to which people stay in the same munic-
ipality over multiple generations. This is shown for the fourth generation in Figure 29.7. Places

Figure 29.6: Origins in the dialect area of Limburgish, as birth places of great-grandparents.

Figure 29.7: Percentage of great-grandparents that were born in the same municipality as their
  great-grandchildren (left-hand panel), and, conversely, percentage of great-grandchildren that
  still live in the same municipality as their great-grandparents (right-hand panel).
Mapping Migration across Generations   359

that are dark in both panels have the least migration and the most stable population, notably
Urk, Staphorst, Bunschoten-Spakenburg, Volendam, Katwijk and to a lesser extent Goedereede,
Zundert and Maastricht – the first five of which are among the most orthodox Protestant munic-
ipalities. The areas in the west have had a significant influx from the rest of the country, resulting
in a lighter shade.

                                        29.5 Conclusion

The map tool allows for quick analysis of complex data with a geographical and time component.
The current demonstrator on migration across generations can be helpful for the study of linguistic
and social phenomena, by enhancing an understanding of the origins of the current population,
which could serve as an inspiration for further research. An example of a demographic study of
the distance between places of birth of great-grandparents and great-grandchildren is presented in
Ekamper (2013).

                               Appendix: Technical Background

   Maps are produced with the open source (GPLv2) mapping module Kaart, which can be found at
www.meertens.knaw.nl/kaart/. A REST service, which powers the migration maps, is available and
documented at www.meertens.knaw.nl/kaart/v3/rest/. Maps can be downloaded as KML files (via
a button under each map) for presentation in Google Earth and for combination with other types
of maps; downloading of maps as 1200 * 1320 pixel PNG files for e.g. embedding in publications
or presentations is also possible.
   Information about municipalities, COROP areas, dialect areas and provinces, as well as all
migration data underlying the maps, are available under the Creative Commons Attribution-
NonCommercial-ShareAlike 3.0 licence at www.meertens.knaw.nl/migmap/migrationdata/. This
is also the source for migration data used by the Migmap application itself.

                                       Acknowledgements

The MIGMAP (migration mapping) project, as part of the CLARIN-NL programme, was
realised in 2012, with the website launched in January 2013. We wish to thank Peter Ekamper
and Frans van Poppel from the Netherlands Interdisciplinary Demographic Institute (KNAW) for
their helpful comments, and Folkert de Vriend for the integration of the results of the project in
the CLARIN infrastructure.

                                            References

Anthony, S, Amelink-Verburg, M P, Jacobusse, G W and Van der Pal-de Bruin, K M 2005
   De Thuisbevalling in Nederland 1995–2002, rapportage over de jaren 2001–2002. Leiden: TNO
   Kwaliteit van Leven Jeugd.
Daan, J and Blok, D 1969 Van Randstad tot Landrand; toelichting bij de kaart: Dialecten en
   Naamkunde. Volume XXXVII, Bijdragen en mededelingen der Dialectencommissie van de
   Koninklijke Nederlandse Akademie van Wetenschappen te Amsterdam. Amsterdam: Noord-
   Hollandsche Uitgevers Maatschappij.
De Haas-Posthuma, J H and De Haas, J H 1968 Infant loss in the Netherlands. In: Vital and health
   statistics. Analytical studies 3. Washington D.C.: National Center for Health statistics. pp. 3–11.
360 CLARIN in the Low Countries Ekamper, P and Bloothooft, G 2013 Weg van je wortels. De afstand tussen overgrootouders en achterkleinkinderen. DEMOS 29(2): 8. Kley, S 2011 Explaining the Stages of Migration within a Life-Course Framework. European Sociological Review, 27(4): 469–86. Prins, C J M and Kuijper, H 2007 Bevolkingsstatistieken onder het persoonskaartenstelsel en het GBA-stelsel: overeenkomsten en verschillen. Bevolkingstrends, 55: 14–33.
You can also read