Market Outlook Report- 26th MAR 2021 - Webflow
←
→
Page content transcription
If your browser does not render page correctly, please read the page content below

Market Outlook Report- 26th MAR 2021

                                Compiled by:
            CapitalVia Global Research Limited- Investment Advisor
903, B-1, 9th Floor, NRK Business Park, Scheme No. 54, P.U.-4,Vijay Nagar Square,
                               Indore-452010 (M.P.)

                     Head of Research - Gaurav Garg

             For feedback or queries, mail us at pr@capitalvia.com
                            Ph no.: (+91) 88273 92806
Indian Markets

            Index            Last             High              Low             Change          Change%

             Nifty         14324.90         14575.60          14264.40           -224.50           -1.54%

            Sensex         48440.12         49247.95         48236.35            -740.19            -1.51%

           Banknifty       33006.45         32415.25          33550.15           -286.80           -0.86%

           Nifty FUT       14324.50         14560.00          14261.25           -230.80           -1.60%

               The Nifty opened on a flat note on 25th March 2021 and plunged down till 14264 in first half
               to recover and close above 14300 in second half. The expiry session ensured market was
Overview

               volatile, the support seems to be around 14200 and resistance 15050.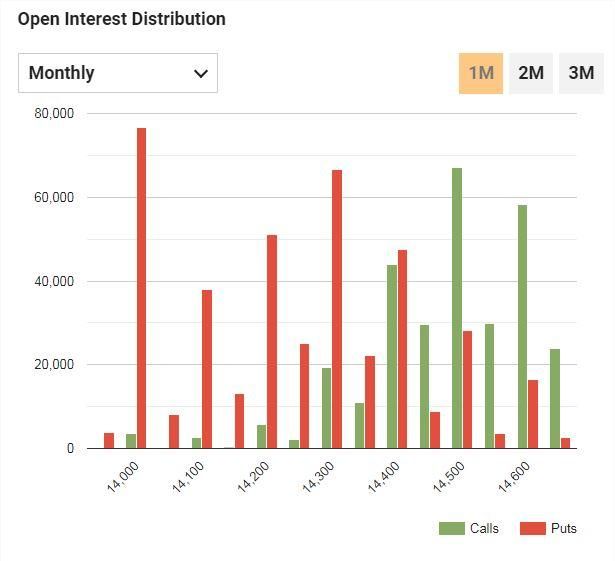
Global Markets

 Index          Last            High           Low              Change       Change%         ➢   The U.S. securities regulator is introducing measures that would kick
                                                                                                 foreign companies off U.S. stock exchanges if they do not comply with
Dow 30          32,420.06       32,787.99      32,418.15            -3.09           -0.01%
                                                                                                 U.S. auditing standards, and require them to disclose any government
Nasdaq              12,961.89   13,292.92      12,961.35           -265.81          -2.01%       affiliations - measures widely expected to hit Chinese companies.

 DAX              14,597.40     14,612.45     14,530.45             -12.99          -0.09%
                                                                                             ➢   European stocks inched lower in early trading on Thursday as investors
FTSE 100            6,719.85     6,730.38       6,676.15            +6.96           +0.10%       grew wary about the economic outlook following a new round of
                                                                                                 coronavirus restrictions in the euro zone and regulatory concerns hit
                                                                                                 Chinese stocks.
            Index               S1           Pivot Points            R1
                                                                                             ➢   Asian equities bounced between gains and losses on Thursday as a
           Dow 30                 32361.14       32486.79             32549.61
                                                                                                 selloff in Chinese technology shares due to concerns they will be de-
                                                                                                 listed from U.S. bourses and worries about a semiconductor shortage
           Nasdaq                12925.22         12998.02               13034.41
                                                                                                 rattled some investors.

            DAX                  14543.85            14578.15         14625.85

           FTSE 100              6684.08             6707.23              6738.3
Currency Outlook
➢ The currency pair rose to a high of 72.6850 at the day's opening
session, up from a low of 72.27 on Tuesday this week, backed by a
drop in global stocks, an increase in the dollar index, and concerns of
Covid spreading through many countries. The currency pair broke
out on the upside after a long period of sustained weakness in the
tight range of 72.30 to 72.60.
➢ On the assumption that the Central Bank will continue to boost
domestic bond market yields, the 10-year benchmark G-sec yield hit
a high of 6.23 percent on 12-3-21 and has since dipped to its current
level of 6.15 percent per annum. Following the completion of the RBI's
open market operations today, further bond buying is expected.
➢ USD/INR once again traded on a flat note where $72.50-$2.30 levels is
holding a support where breakout above $72.80 is waited for further
upside movement. Dollar Index is on the edge to give breakout above
200-Daily Moving Average which is placed $92.60 levels which can
Chart : Zerodha.com further take prices to $92.25-$91.75 levels. USD/INR could trade in the
range of $72.50-$72.95 in the upcoming sessions.Derivative Outlook
⮚ Market indices remained weak amid monthly F&O expiry and witnessed selling throughout the session as on
Thursday, 25th March. Nifty has breached the major support of 14,350 level and remained highly volatile ending
with a loss of around 1.54 percent. Among sectors, except metal, all other indices ended in red with auto and
FMCG being the top losers.
⮚ In the coming trading session on Friday, 26th March market is expected to be volatile amid weak global cues.
14,100 to 14,050 is expected to be support zone for Nifty whereas on the higher side 14,500 level must be
sustained by the index to witness a bounce-back and regain momentum.
⮚ Highest Daily Nifty Call OI-14,000
⮚ Highest Daily Nifty Put OI-14,500
Long built-up:
Scrip Name Closing price Change in price Change in OI
ICICIBANK 570.80 0.57% 16.04%
HDFC 2467.85 0.06% 34.80%
FEDERALBNK 76.35 1.06% 11.10%Short built-up:
Scrip Name Closing price Change in price Change in OI
MOTHERSUMI 195.20 -3.08% 35.87%
SBIN 357.35 -0.82% 11.36%
ONGC 101.75 -2.91% 19.69%
Short covering:
Scrip Name Closing price Change in price Change in OI
SAIL 72.70 3.27% -9.07%
JINDALSTEL 312.20 1.45% -7.89%
JSWSTEEL 439.00 0.26% -14.19%
Long Unwinding:
Scrip Name Closing price Change in price Change in OI
IDEA 8.90 -8.72% -12.63%
PNB 35.60 -4.04% -30.49%
NATIONALUM 52.25 -2.06% -30.81%Nifty Option Chain
Analysis :
⮚ Nifty ends the day on a negative note with a loss of around 1.54
percent as on Thursday, 25th March. The options data indicates
immediate trading range of the Nifty is likely to be 14,000 – 14,800.
Maximum Put open interest was at 14,000 followed by 14,300 strike,
while maximum Call open interest was at 14,500 followed by 14,600
strike. Call writing was seen at 14,500 and 14,600 strikes while Put
writing was seen at 14,300 and 14,400 strikes. IndiaVIX gained 1.07
percent and close at 22.70.
Source: www.bloombergquint.comNifty Option Chain
Analysis :
➢ As per monthly option data , Nifty should trade in the range of
9000-10000 . Maximum Put writing can be seen at 9000 and
Maximum call writing can be seen at 10000
➢ Nifty closed with gains on Wednesday,6th May. We expect Nifty to
be range bound , Volatility is most likely to increase in the coming
trading session. Indecisiveness can be seen in the market as
trading range of Nifty is getting smaller. As per weekly option data,
nearest support can be seen at 9200 and on the higher side,
resistance can be seen at 9400.
Source: www.bloombergquint.comGlobal Markets
Index Last High Low Change Change%
Dow 30 23783.44 24054.59 23782.28 -99.65 -0.42% ➢ U.S. stocks opened higher on hopes of a pickup in business activity
with states easing Coronavirus-induced curbs, while investors
Nasdaq 8825.55 8913.85 8819.37 17.76 0.20%
looked past a stunning 20 million plunge in U.S. private payrolls last
DAX 10615.73 10771.68 10604.90 -111.74 -1.08% month.
FTSE 100 5850.80 5898.33 5838.70 0.88 0.02%
➢ European stock markets traded slightly lower on Wednesday amid
weak economic data, while better than expected earnings helped
the U.K. to outperform.
Index S1 Pivot Points R1
➢ German factory orders slumped 15.6% in March to their lowest level
Dow 30 23760.10 23906.82 23996.82
since records began in 1991, while IHS Markit's final Composite
Nasdaq 8840.29 8876.96 8901.71 Purchasing Managers' Index for the euro zone, seen as a good
indicator of economic health, plummeted to 13.6 in April from
DAX 10624.80 10676.20 10704.30
March's already dire 29.7, easily its lowest reading since the survey
FTSE 100 5850.41 5874.37 5889.24 began in 1998.Disclosure
➢ CapitalVia Global Research Limited (hereinafter referred as “CapitalVia”) shall not be liable for any misrepresentation, falsification, and deception or for any lack of availability of
services through the website, even if the same are advertised for, on the website.
➢ Customers to take a note: We touch base with our customers and prospects using the phone no.series
+91 7313 816 000 to +91 7313 816 299, +91 7316 736 100 to +91 7316 736 499 & +91 731 677 4001 (Kindly note that CapitalVia serves all it customers only from the above mentioned
numbers. Thus any call from number other than mentioned above, claiming to be from CapitalVia, shall be completely ignored.) Please beware of spoof calls and report such case on
our hotline number +91 8085 999 333
➢ CapitalVia confirms that no employee of ours can engage in (directly or indirectly) any trade or business in capital market.We do not allow any of our employees to participate in
trading business.W also restrict our people from getting into any related business or otherwise for ensuring unbiased services to the clients of CapitalVia.
➢ In compliance to SEBI (Investment Advisers) Regulation 2013, all our Research Analysts are certified by the National Institute of Securities Market (NISM) with an experience of more
than 5000 Hours and its still adding.
➢ The track record of the services offered by CapitalVia is published on a day+1 basis to its websites, i.e. www.capitalvia.com/dashboard.
➢ CapitalVia categorically states that different types of investments involve varying degrees of risk, and there can be no assurance that the future performance of any specific
investment or investment strategy (including those undertaken or recommended by the CapitalVia), will be profitable or equal any historical performance level(s).
➢ Your KYC and RPM formalities need to be complete before you can use any service from CapitalVia. Even if the subscription fee is paid, no service would be rendered to any customer
before completion of KYC and RPM formalities. For completing the KYC formalities, we proceed with the information mentioned on the PAN Card Number only.
➢ The service offered to any customer depends on his/her Risk Profile Management. CapitalVia offers only those service to the customers which are either of the same risk category or
less. In all the other cases, CapitalVia offers no services and the subscription fee is returned.
➢ The website contains features of the services that are currently being offered by CapitalVia and those intended to be offered in the future. CapitalVia intends to launch the services,
confirming with the features listed on the website in total, however, due to business need and regulatory requirement the final launch may contain variables. Notwithstanding
anything contained in the website regarding the services, CapitalVia may decide to postpone the offering of the services or may even decide to withdraw the offering or even a
currently offered service altogether.
➢ Any alliances, partnership co-branding that we have doesn't guaranty or assure free gifts, profit etc. This partnerships are meant for providing additional benefits to our subscribers
during festive season or special occasions while they are subscribing our services. These offers by no means designed or presented to lure our prospects towards subscribing our
services.
➢ CapitalVia is not engaged in any kind of execution services - directly or indirectly. Its alliances with TradeSmart which is engaged in execution services, are restricted to mutually
beneficial marketing activities wherein both CapitalVia and the TradeSmart shall display each other’s products at discounted price, to their own customers, permission based leads
and opportunities. As a business, we DO NOT offer or are involved in any direct or indirect execution services. Our services are limited to providing research based trading
recommendations.
➢ CapitalVia reserve the right to modify/ alter/ change the content of its website. Clients are advised to update themselves from time to time.
➢ Clarification on the news published on 28th June 17 on the13th Page of Indore Times of India. Click Here
➢ Investments in securities are subject to market risks, which includes price fluctuation risk. There is no assurance or guarantee that the objectives of any of the products mentioned in
this document or on this site will be achieved.
➢ As a business, we offer stock recommendations based on technical research ONLY to our subscribers. We have not authorised any organisation or firm to represent us and offer stock
recommendations on our behalf.
➢ As a business, we DO NOT offer or involved in any direct or indirect execution services. Our services are limited to providing research based trading signals.
➢ Methodology of maintaining track record of recommendations Click Here
➢ Police advisory for investors who taking services of financial advisors. Click HereYou can also read