MASTER TECHNOLOGY ROADMAP - NREL
←
→
Page content transcription
If your browser does not render page correctly, please read the page content below

MASTER TECHNOLOGY ROADMAP

David Sedlak                                      Dion D. Dionysiou
      University of California–Berkeley                 University of Cincinnati

      Meagan Mauter                                     Daniel Giammar
      Stanford University                               Washington University in St. Louis

      Jordan Macknick                                   Eric Hoek
      National Renewable Energy Laboratory              University of California–Los Angeles

      Jennifer Stokes-Draut                             Sunny Jiang
      Lawrence Berkeley National Laboratory             University of California–Irvine

      Peter Fiske                                       Lynn Katz
      Lawrence Berkeley National Laboratory             The University of Texas–Austin

      Deborah Agarwal                                   Jaehong Kim
      Lawrence Berkeley National Laboratory             Yale University

      Thomas Borch                                      Robert Kostecki
      Colorado State University                         Lawrence Berkeley National Laboratory

      Richard Breckenridge                              Jeffery McCutcheon
      Electric Power Research Institute                 University of Connecticut

      Tzahi Cath                                        Yarom Polsky
      Colorado School of Mines                          Oak Ridge National Laboratory

      Shankar Chellam                                   Zachary Stoll
      Texas A&M University                              Georgia Institute of Technology

      Amy Childress                                     Pei Xu
      University of Southern California                 New Mexico State University

      Acknowledgments
      This material is based upon work supported by the National Alliance for Water
      Innovation (NAWI), funded by the U.S. Department of Energy, Office of Energy
      Efficiency and Renewable Energy (EERE), Advanced Manufacturing Office, under
      Funding Opportunity Announcement Number DE-FOA-0001905. NAWI would
      like to thank the Department of Energy Technical Monitor Melissa Klembara for
      guidance and support throughout the roadmapping process. This roadmap was
      developed under the guidance of the National Alliance for Water Innovation (NAWI)
      Desalination Hub executive team, cartographers, and technical staff as well as the
      NAWI’s Research Advisory Council (RAC).

      Suggested citation
      David Sedlak, Meagan Mauter, Jordan Macknick, Jennifer Stokes-Draut, Peter Fiske,
      Deb Agarwal, Thomas Borch, Richard Breckenridge, Tzahi Cath, Shankar Chellam,
      Amy Childress, Dion D. Dionysiou, Daniel Giammar, Eric Hoek, Sunny Jiang, Lynn
      Katz, Jaehong Kim, Robert Kostecki, Jeffrey McCutcheon, Yarom Polsky, Zachary
      Stoll, Pei Xu. 2021. National Alliance for Water Innovation (NAWI) Master Roadmap.
      DOE/GO-102021-5617. https://www.nrel.gov/docs/fy21osti/80705.pdf.

ii   N AW I M A S T E R T E C H N O L O G Y R O A D M A P 2021
CONTENTS
 1. INTRODUCTION............................................................. 5
  1.1.      Establishing an Energy-Water Desalination Hub...........................................................................................6
  1.2.      Pipe-Parity and Baseline Definitions..................................................................................................................7
  1.3.      Nontraditional Waters and End-Use Sectors of Interest.............................................................................9
  1.4.      A-PRIME.........................................................................................................................................................................12
  1.5.      Desalination Hub Topic Areas...............................................................................................................................13

  2. MASTER ROADMAP OVERVIEW............................... 14
  2.1.      Current Status of U.S. Water Users......................................................................................................................16
  2.2. Approach to the Master Roadmap......................................................................................................................24

  3. TECHNICAL CHALLENGES.......................................28
  3.1.      Technical Challenges...............................................................................................................................................29
  3.2. Non-Technical Challenges.....................................................................................................................................31

  4. AREAS OF INTEREST..................................................34
  4.1.      Autonomous.................................................................................................................................................................35
  4.2. Precise............................................................................................................................................................................42
  4.3. Resilient..........................................................................................................................................................................46
  4.4.      Intensified......................................................................................................................................................................50
  4.5. Modular..........................................................................................................................................................................56
  4.6. Electrified......................................................................................................................................................................61
  4.7.      Circular Water Economy..........................................................................................................................................67
  4.8       Cumulative Impacts of NAWI Master Roadmap Priorities...........................................................................70

  5. NEXT STEPS..................................................................75
            Appendix A: Acronyms............................................................................................................................................76
            Appendix B: References..........................................................................................................................................78

                                                                                                     N AW I M A S T E R T E C H N O L O G Y R O A D M A P 2021                                    iii
TABLE OF FIGURES
         Figure 1..................................................................................................................................................................................... 11
         Industries covered in each PRIMA roadmap secto

         Figure 2.................................................................................................................................................................................... 15
         Overview of NAWI Master Roadmap investment priorities

         Figure 3..................................................................................................................................................................................... 16
         Overview of water withdrawals in the United States

         Figure 4..................................................................................................................................................................................... 18
         U.S. Megaregions

         Figure 5.................................................................................................................................................................................... 19
         Irrigation water use by source and state, 2015

         Figure 6.................................................................................................................................................................................... 21
         Annual state-level energy and water flows in 2010 for California, Texas, and Florida

         Figure 7..................................................................................................................................................................................... 22
         Resource extraction withdrawals by state in 2015

         Figure 8.................................................................................................................................................................................... 23
         Fraction of water used within each industrial subsector for cooling water, boiler feedwater, process
                water uses, and other uses

         Figure 9..................................................................................................................................................................................... 24
         NAWI Master Roadmap in the context of other opportunities

         Figure 10.................................................................................................................................................................................. 25
         Map highlighting location and end-use type of NAWI baseline studies

         Figure 11................................................................................................................................................................................... 26
         Prioritizing PRIMA roadmap AOIs for inclusion in Master Roadmap

         Figure 12.................................................................................................................................................................................. 27
         NAWI Master Roadmap AOIs mapped to PRIMA Roadmap AOIs

         Figure 13................................................................................................................................................................................... 70
         Cumulative Impacts of NAWI Challenge Area Investments on Pipe Parity

         Figure 14................................................................................................................................................................................... 71
         Continuum of NAWI challenge areas and investment type

                                                                           TABLE OF TABLES

         Table 1........................................................................................................................................................................................ 30
         Summary of References to Technical Challenges by PRIMA Roadmap Section Number

         Table 2....................................................................................................................................................................................... 33
         Summary of References to Non-Technical Challenges by PRIMA Roadmap Section Number

iv   N AW I M A S T E R T E C H N O L O G Y R O A D M A P 2021
Introduction

1. INTRODUCTION

Clean water is critical to ensure good health, strong communities, vibrant ecosystems, and a functional
economy for manufacturing, farming, tourism, recreation, energy production, and other sectors’ needs.

Research to improve desalination technologies can make nontraditional sources of water (i.e.,
brackish water; seawater; produced and extracted water; and power sector, industrial, municipal,
and agricultural wastewaters) a cost-effective alternative. These nontraditional sources can then be
applied to a variety of beneficial end uses, such as drinking water, industrial process water, and irri-
gation, expanding the circular water economy by reusing water supplies and valorizing constituents
we currently consider to be waste. As an added benefit, these water supplies could contain valuable
constituents that could be reclaimed to further a circular economy.

                                                         N AW I M A S T E R T E C H N O L O G Y R O A D M A P 2021   5
Introduction

     1.1. Establishing an Energy-Water Desalination Hub
     In 2019, the U.S. Department of Energy (DOE) established an Energy-Water
     Desalination Hub (part of a family of Energy Innovation Hubs to address
     water security issues in the United States. NAWI was funded to address
     this critical component of the DOE’s broader Energy-Water Nexus portfolio to
     help address the nation’s water security needs. NAWI’s goal is to enable the
     manufacturing of energy-efficient desalination technologies in the United States
     at a lower cost with the same (or higher) quality and reduced environmental
     impact for 90 percent of nontraditional water sources within the next 10 years.

     NAWI is led by Lawrence Berkeley National Laboratory in Berkeley,
     California and includes Oak Ridge National Laboratory, the National
     Renewable Energy Laboratory, the National Energy Technology Laboratory,
     19 founding university partners, and 10 founding industry partners.
     This partnership is focused on conducting early-stage research (technology
     readiness levels [TRLs] 2–4) on desalination and associated water-treatment
     technologies to secure affordable and energy-efficient water supplies for the
     United States from nontraditional water sources. NAWI’s five-year research
     program will consist of collaborative early-stage applied research projects
     involving DOE laboratories, universities, federal agencies, and industry partners.
     DOE is expected to support NAWI with $110 million in funding over five years,
     with an additional $34 million in cost-share contributions from public and private
     stakeholders.

     As a part of the NAWI research program, this Master Roadmap was
     developed to identify research and development (R&D) opportunities that
     help address their particular challenges that the five water sectors (Power,
     Resource Extraction, Industry, Municipal, and Agriculture, or PRIMA) face
     in treating nontraditional water sources. Recognizing the important sector-
     specific variations in water availability and water technology needs, NAWI has
     also published five end-use water roadmaps with tailored R&D and modeling
     opportunities for each sector. These roadmaps have each been published
     as standalone documents that can inform future NAWI investments as well as
     provide insight into priorities for other research funding partners.

6   N AW I M A S T E R T E C H N O L O G Y R O A D M A P 2021
Introduction

1.2. Pipe-Parity and Baseline Definitions
A core part of NAWI’s vision of a circular water economy is reducing the cost of treating
nontraditional source waters to the same range as the portfolio of accessing new traditional
water sources, essentially achieving pipe-parity. The costs considered are not just economic but
include consideration of energy consumption, system reliability, water recovery, and other qualitative
factors that affect the selection of a new water source. To effectively assess R&D opportunities, pipe-
parity metrics are utilized; they encompass a variety of information that is useful to decision makers
regarding investments related to different source water types.

Pipe-parity is defined as technological and non-technological solutions and capabilities that make
marginal water sources viable for end-use applications. Like the concept of grid parity (where an
alternative energy source generates power at a levelized cost of electricity [LCOE] that is less than or
equal to the price of power from the electricity grid), a nontraditional water source achieves pipe-par-
ity when a decision maker chooses it as their best option for extending its water supply.

Specific pipe-parity metrics of relevance can include:

                         Cost metrics can include levelized costs of water treatment as well as
                         individual cost components, such as capital or operational and maintenance
       Cost              (O&M) costs.

                         Energy performance metrics can include the total energy requirements of
                         the water treatment process, the type of energy required (e.g., thermal vs.
    Energy               electricity), embedded energy in chemicals and materials, and the degree to
  Performance            which alternative energy resources are utilized.

                         Water treatment performance metrics can include the percent removal of
                         various constituents of concern and the percent recovery of water from the
Water Treatment
                         treatment train.
 Performance

                         Externality metrics can include air emissions, greenhouse gas emissions,
 Human Health
                         waste streams, societal and health impacts, and land-use impacts.
and Environment
  Externalities

                         Process adaptability metrics can include the ability to incorporate variable
                         input water qualities, incorporate variable input water quantity flows, produce
    Process              variable output water quality, and operate flexibly in response to variable
  Adaptability           energy inputs.

                                                        N AW I M A S T E R T E C H N O L O G Y R O A D M A P 2021   7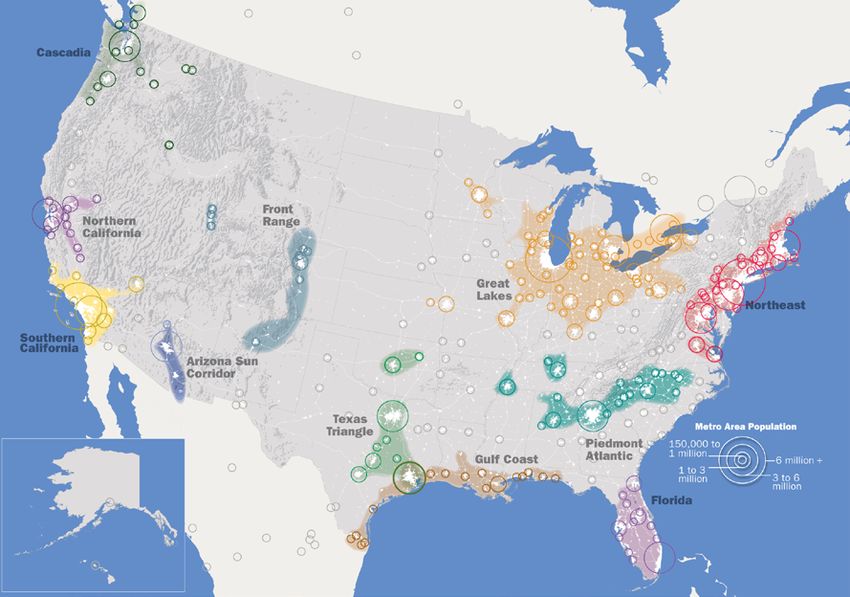
Introduction

                                  System reliability and availability metrics can include factors related to the
                                  likelihood of a water treatment system not being able to treat water to a
                                  specified standard at a given moment, how quickly the system can restart
                                  operations after being shut down for a given reason, confidence in source
       Reliability and
                                  water availability, the degree to which the process is vulnerable to supply
        Availability
                                  chain disruptions, and the ability to withstand environmental, climate, or
                                  hydrological disruptions.

                                  Compatibility metrics can include ease of operation and level of oversight
                                  needed, how well the technology integrates with existing infrastructure,
                                  how consistent the technology is with existing regulations and water rights
       Compatibility
                                  regimes, and the level of social acceptance.

                                  Sustainability metrics can include the degree to which freshwater inputs are
                                  required for industrial applications, the percentage of water utilized that is
       Sustainability             reused or recycled within a facility, and watershed-scale impacts.

     To establish references on which pipe-parity metrics are most applicable in each sector, baseline
     studies for each of NAWI’s eight nontraditional water sources have been conducted. These studies
     collect data about the use of each source water and evaluate several representative treatment trains
     for the targeted source water to better understand current technology selections and implementation
     methods. The baselines provide range estimates of the current state of water treatment pathways
     across pipe-parity metrics, which enable the calculation of potential ranges of improvement.

8   N AW I M A S T E R T E C H N O L O G Y R O A D M A P 2021
Introduction

1.3. Nontraditional Waters and End-Use Sectors of Interest
NAWI has identified eight nontraditional water supplies of interest for further study:

                           Water from the ocean or from bodies strongly influenced by ocean water,
    Seawater and
                           including bays and estuaries, with a typical total dissolved solids (TDS)
    Ocean Water
                           between 30,000 and 35,000 milligrams per liter (mg/L).

                           Water pumped from brackish aquifers, with particular focus on inland
      Brackish
                           areas where brine disposal is limiting. Brackish water generally is defined
    Groundwater
                           as water with 1–10 grams per liter (g/L) of total dissolved solids (TDS).

      Industrial
                           Water from various industrial processes that can be treated for reused
     Wastewater

                           Wastewater treated for reuse through municipal resource recovery
      Municipal
                           treatment plants utilizing advanced treatment processes or decentralized
     Wastewater
                           treatment systems

                           Wastewater from tile drainage, tailwater, and other water produced on
     Agricultural
                           irrigated croplands, as well as wastewater generated during livestock
     Wastewater
                           management, that can be treated for reuse or disposal

      Mining               Wastewater from mining operations that can be reused or prepared
     Wastewater            for disposal

      Produced             Water used for or produced by oil and gas exploration activities
        Water              (including fracking) that can be reused or prepared for disposal

 Power and Cooling         Water used for cooling or as a byproduct of treatment (e.g., flue gas
    Wastewater             desulfurization) that can be reused or prepared for disposal

These nontraditional water sources range widely in TDS (100 milligrams per liter [mg/L] – 800,000 mg/L
total) as well as the type and concentrations of contaminants (e.g., nutrients, hydrocarbons, organic
compounds, metals). These different water supplies require varying degrees of treatment to reach
reusable quality.

                                                        N AW I M A S T E R T E C H N O L O G Y R O A D M A P 2021   9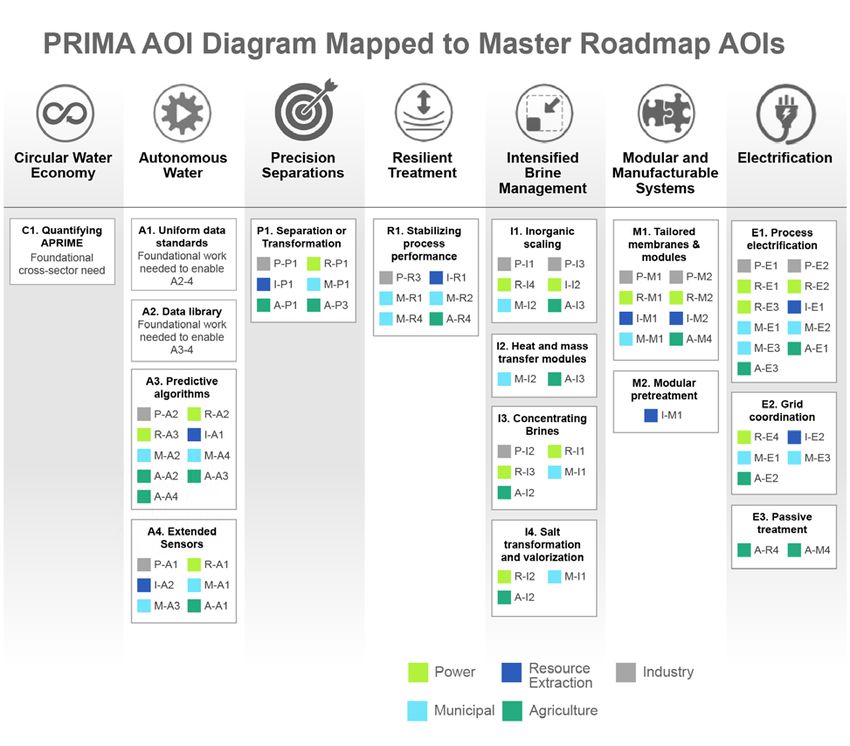
Introduction

      When these nontraditional water supplies are treated with novel technologies created through the
      NAWI desalination hub, these remediated wastewaters could be repurposed back to one or more of
      the following five end-use sectors:

                           Water used in the electricity sector, especially for thermoelectric cooling
         Power

                           Water used to extract resources, including mining and oil and gas
                           exploration and production
      Resource
      Extraction

                           Water used in industrial and manufacturing activities not included elsewhere,
                           including but not limited to petrochemical refining, food and beverage
       Industrial          processing, metallurgy, and commercial and institutional building cooling

                           Water used by public water systems (which include entities that are both publicly
                           and privately owned) to supply customers in their service area
       Municipal

                           Water used in the agricultural sector, especially for irrigation and food production
      Agriculture

10   N AW I M A S T E R T E C H N O L O G Y R O A D M A P 2021
Introduction
NAWI identified these broad “PRIMA” sectors because they are major users of water with
opportunities for reuse. Figure 1 expands on the industries included in NAWI’s PRIMA broad
end-use sectors. These areas are not meant to be exhaustive, as nearly all industries and sectors rely
on water in one way or another.
END-USE SECTOR INDUSTRIES INCLUDED
Thermoelectric
Power
Renewable energy
Upstream oil and gas
Resource Extraction* Hydraulic fracturing operations
Mining
Refineries
Petrochemicals
Primary metals
Industrial†
Food and beverage
Pulp and paper
Data centers and large campuses
Public supply for use by residential, commercial,
Municipal industrial, institutional, public service, and some
agricultural customers within the utility service area
Irrigation
Agriculture Livestock
Upstream food processing
Figure 1. Industries covered in each PRIMA roadmap sector
* An important distinction for oil and gas and mining operations: upstream drilling operations fall under the Resource Extraction
Sector and downstream refining operations fall under the Industrial Sector.
† This list of industries for the Industrial Sector is for baselining and initial roadmapping. This list will be reviewed in future roadmap
iterations.
N AW I M A S T E R T E C H N O L O G Y R O A D M A P 2021 11Introduction
1.4. A-PRIME
Securing water supplies for multiple end-uses requires technology revolutions that will
transition the United States from a linear to a circular water economy.
These desalination and reuse advances will be realized by developing a suite of Autonomous,
Precise, Resilient, Intensified, Modular, and Electrified (A-PRIME) technologies that support distributed
and centralized treatment at a cost comparable to other inland and industrial sources. Each aspect of
this hypothesis has been vetted with water treatment professionals from each PRIMA industry sector
as well as NAWI’s Research Advisory Council (RAC) to ensure that it is a relevant means of advancing
desalination and water treatment capabilities for nontraditional source waters. These areas may be
modified as new priorities and opportunities are identified.
The NAWI A-PRIME hypothesis outlines the following six major challenge areas needing
improvement for water treatment to reach pipe-parity for nontraditional waters.
The Autonomous area entails developing robust sensor networks coupled with
sophisticated analytics and secure controls systems.
The Precise area focuses on a targeted treatment approach with
precise removal or transformation of treatment-limiting constituents
and trace contaminants.
The Resilient area looks to enable adaptable treatment
processes and strengthen water supply networks.
The Intensified area focuses on innovative technologies and
process intensification for brine concentration and crystallization
and the management and valorization of residuals.
The Modular area looks to improve materials and manufacturing processes
and scalability to expand the range of cost-competitive treatment
components and eliminate intensive pre/post-treatment.
The Electrified area aims to replace chemically intensive processes with electrified
processes that are more amenable to variable or fluctuating operating conditions.
12 N AW I M A S T E R T E C H N O L O G Y R O A D M A P 2021Introduction
1.5. Desalination Hub Topic Areas
There are key technology areas of R&D, modeling, and analysis that cut across the water sources and
sectors in the NAWI Hub.
They can be categorized under three interdependent topic areas, as summarized below:
Novel technology processes and system design concepts are needed
to improve energy efficiency and lower costs for water treatment.
New technologies related to water pre-treatment systems (e.g., upstream
from the desalination unit operation) and other novel approaches can
Process Innovation address associated challenges such as water reuse, water efficiency, and
and Intensification high-value co-products.
R&D
Materials R&D has the potential to improve energy efficiency and
lower costs through improved materials used in specific components
and in water treatment systems. Desalination and related water
treatment technologies can benefit from materials improvements for
Materials and a range of products (e.g., membranes, pipes, tanks, and pumps) that
Manufacturing R&D dramatically increase their performance, efficiency, longevity, durability,
and corrosion resistance.
In order to consistently define, track, and achieve pipe-parity in the
highest impact areas, strategic, non-biased, and integrated data and
analysis is needed. This data, in addition to studies and analysis tools,
is necessary to guide the Hub’s strategic R&D portfolio. A centralized
data system will also fill the void in industry for shared information and
provide decision-making tools related to water treatment implementation.
Data, Modeling, and Multi-scale models and simulation tools can inform R&D via performance
Analysis forecasting, design optimization, and operation of desalination
technologies and related water-treatment systems, leading into improved
energy efficiency and lowered costs.
N AW I M A S T E R T E C H N O L O G Y R O A D M A P 2021 13Master Roadmap Overview
2. MASTER ROADMAP OVERVIEW
Prior to developing a master roadmap, a team of researchers and water professionals engaged
in a detailed process of evaluating water uses, state-of-the-art technologies, emerging
technologies and existing uses of desalination and advanced water technologies within five
major water user categories in the United States. The resulting Water User Sector Roadmaps were
complemented by a Baseline Analysis of a suite of representative treatment systems conducted by
NAWI researchers working in collaboration with the Hub’s Industrial Partners. Over 400 experts and
practitioners contributed to the NAWI roadmapping and baselining initiatives. This Master Roadmap,
which synthesizes the findings from these different efforts as well as feedback from members of
NAWI’s RAC, serves as the basis for identifying NAWI’s research Areas of Interest (AOIs).
During the roadmapping process, a total of 89 sector-specific AOIs were identified from which
R&D have the potential to reduce the costs and energy intensity of desalination and fit-for-
purpose water reuse and increase the availability and adoptability of nontraditional water
sources. We prioritized these AOIs based on their impact across multiple water use sectors and their
potential to expand the use of nontraditional waters. This evaluation involved quantitative analysis
of current water reuse and desalination practices and a combination of quantitative and qualitative
assessments of R&D priorities for enabling nontraditional water reuse. Underlying the decision-
making process was a strategy of identifying a limited number of AOIs in which research conducted by
NAWI could create synergies that combine to achieve the greatest progress in achieving pipe-parity in
multiple areas. We also prioritized AOIs that leverage the unique data, analysis, modeling, simulation,
characterization, manufacturing, optimization, and testing capabilities of DOE’s National Laboratories.
14 N AW I M A S T E R T E C H N O L O G Y R O A D M A P 2021Master Roadmap Overview
The guiding principle behind NAWI is that research at TRLs ranging from 2 to 4 (i.e., concept identifica-
tion through laboratory validation) can provide a basis for dramatic improvements in the performance
of small-scale autonomous desalination and water treatment systems. Much of this research should
also be applicable to existing, centralized desalination and advanced water treatment facilities, where
they could combine to produce substantial reductions in capital costs, operating budgets, and energy
consumption. Research at a very fundamental level (i.e., TRL 1; basic research) lies outside of NAWI’s
scope. In some cases, however, we identified basic research programs within DOE, the U.S. National
Science Foundation, and other federal and state agencies’ research portfolios that were well aligned
with A-PRIME (e.g., in areas such as Intensified Brine Management and Precision Separation) and
created links with them to assure that the knowledge that they were generating could be built upon
in NAWI’s research. Similarly, demonstration and optimization of system performance in pilot- and
full-scale systems—an essential step to realizing NAWI’s low-TRL research advances in operational
systems—will require further R&D investment by federal, state, and industrial entities.
To assure that NAWI’s research has the greatest possible impact, we prioritized research needs
that were likely to have substantive pipe-parity impacts in several different water sectors.
Research needs identified in the Water User Sector Roadmaps that were of primary relevance to
only one or two sectors were given a lower priority in the master roadmapping process than those
that were likely to affect multiple sectors. Similarly, research that offered incremental or moderate
improvements over the state-of-the-art were lower priority than those offering the potential for
paradigm-shifting approaches to water desalination challenges (Figure 2).
Figure 2. Overview of NAWI Master Roadmap investment priorities
N AW I M A S T E R T E C H N O L O G Y R O A D M A P 2021 15Master Roadmap Overview
2.1. Current Status of U.S. Water Users
2.1.1. Water User Sector Background
To gain insight into the Master Roadmap, it is
helpful to consider current and future water
recycling and desalination needs identified
within the five water user sector roadmaps.
The following section summarizes some of the
key findings that informed development of the
Master Roadmap. Readers who are interested
in additional details should consult the relevant
Water User Sector Roadmaps, available on
NAWI’s website (https://www.nawihub.org/
roadmaps). This section provides a brief
overview of water user sectors, their water Figure 3. Overview of water withdrawals in the
withdrawals (Figure 3), the ways in which they United States1
use water, and other relevant information.
POWER
Thermoelectric power generation (e.g., natural gas, coal, petroleum, nuclear) in the United
States accounts for 41 percent of the country’s water withdrawals, or 500 million cubic meters
(m3) per day (130 billion gallons per day).1 Most of these water withdrawals are associated with
older, thermoelectric power plants that use once-through cooling—a process in which water passes
through the main condensers in a single pass to remove waste heat. Evaporative cooling schemes,
which account for less than seven percent of U.S. water withdrawals, consume almost all of the water
withdrawn from the environment 2. Due to regulations and the increasing popularity of renewable
energy (e.g., wind, solar), many once-through cooling schemes are now being retired. The primary
source of water for cooling thermoelectric power plants is fresh surface water. Seawater is employed
for once-through cooling in many coastal areas, but its importance at the national scale is decreasing
as California phases out its use.
AGRICULTURE
The Agriculture Sector is a significant water user in the United States; almost 280 million m3 per
day per day (75 billion gallons per day) of water are used to irrigate over 200,000 farms.1 The
demand for irrigation water in the United States is heterogeneous, varying with climate, time of year,
crop type, and other factors. Western states, which typically have drier climates, accounted for 46
percent of the harvested cropland but used 84 percent of the irrigation water.
MUNICIPAL
Total water withdrawals for public supply, referred to as municipal water uses in our roadmap-
ping process, accounted for about 148 million m3 per day (39 billion gallons per day) in 2015.
Municipal water systems delivered potable water to about 87 percent of the U. S. population.1 The
primary sources of water for municipal use are surface and groundwater supplies, with the majority of
water drawn from fresh surface-water sources.
16 N AW I M A S T E R T E C H N O L O G Y R O A D M A P 2021Master Roadmap Overview
INDUSTRIAL
The Industrial Sector withdraws about 68.5 million m3 per day (18.1 billion gallons per day).1
Because this sector is so heterogenous, NAWI focused on key industrial subsectors in our road-
mapping process, including oil refineries, pulp and paper mills, primary metals factories, chemical
manufacturing, and the food and beverage industries, as well as data centers and large campuses.
These subsectors represent about 35 percent of the overall water withdrawals by industry. Most of
the water for the Industrial Sector is self-supplied from surface and ground water. Municipal water is
the first alternative source when self-supply of freshwater is impractical, because it is available in most
industrial locations, is of consistent quality, and is relatively inexpensive.
RESOURCE EXTRACTION
The Resource Extraction Sector withdraws about 15.5 million m3 of water per day (4.1 billion
gallons per day) for mining and extraction of petroleum products in the United States.1 Resource
extraction often employs proximal groundwater and surface water supplies. In particular, ample quan-
tities of water are often obtained when mines are dewatered or when oil and gas are recovered from
the subsurface. Internal reuse (i.e., recycled water) is also an important source of supply for resource
extraction.
Considering water use from the perspective of the volume of water withdrawn provides insight
into the relative demand of the different water user sectors. However, there are other helpful
ways to conceptualize water use, especially when evaluating opportunities for impactful research on
water recycling and desalination.
For example, the Power Sector, which withdraws the largest quantity of water in the United
States, returns the majority of water that it uses to its original source through the discharge of
once-through cooling systems. As a result of the low-intensity nature of this practice, there are not
many opportunities for NAWI’s research to affect these types of power plants. However, the gradual
conversion of once-through cooling systems to recirculating cooling systems, which is driven by
water scarcity and concerns about environmental impacts of thermal discharges, is accompanied
by opportunities for application of desalination and advanced water treatment. For instance, the
management of blowdown water (i.e., the waste from the recirculating cooling process) can be
energy-intensive and may result in a brine that is challenging to manage. Therefore, R&D targeted at a
small fraction of the water withdrawn by the Power Sector could enable more rapid reductions in the
water withdrawals and ecological stress associated with once-through cooling by advancing pipe-
parity for recirculating cooling.
In contrast to water use for thermoelectric power plants, the Municipal Sector, which currently
withdraws only about a third as much water as the Power Sector, has numerous opportunities for
advancing pipe-parity because a larger fraction of the water that it takes out of the environment
is used in a consumptive manner (i.e., about half in arid regions where outdoor irrigation is common),
and demand is stable or slowly growing in many water-stressed parts of the country. The Municipal
Sector also includes users that are already paying some of the highest marginal costs for water world-
wide due to their desire to avoid the economic damage associated with water scarcity. In other words,
water-stressed cities are often the earliest adopters of desalination and advanced water treatment
technologies because they need reliable, high-quality sources of water and are able to pay for it.
N AW I M A S T E R T E C H N O L O G Y R O A D M A P 2021 17Master Roadmap Overview
2.1.2. Water User Sector Regional Variations
Beyond the details of how a water user sector operates, it is also constructive to consider water
use patterns on a regional basis, because water demand depends upon climate, population
density, and locations of water consuming activities like irrigated agriculture and industry. As
part of NAWI’s roadmapping process, we considered regional variability in water use patterns and the
likelihood that desalination and advanced water technologies would be employed in different water
user sectors, as exemplified by the following brief summaries.
MUNICIPAL
Figure 4. U.S. Megaregions3
In the Municipal Sector, water use is concentrated within major metropolitan areas (i.e.,
megaregions). The existing infrastructure, availability of local and imported water sources, and
geography determine the types of water recycling and desalination technologies that are likely to be
adopted and the timing with which investments are likely to be made.
For example, the Southern California Megaregion, encompassing the triangular area running
from Santa Barbara in the north to San Diego in the south and east to Las Vegas, includes
many of the country’s early adopters of seawater desalination and potable water reuse. These
municipal water sources have already achieved pipe-parity with traditional sources due to the high
population density and the paucity of additional local or imported water. In particular, seawater
desalination and potable water reuse are attractive in these regions because many users have
access to deep ocean outfalls for disposal of brine.
The Arizona Sun Corridor, which includes Phoenix and Tucson, also faces considerable water
stress, but it does not have access to the ocean for brine discharge. As a result, desalination
of brackish groundwater has been hampered by limited options for brine management. Potable
18 N AW I M A S T E R T E C H N O L O G Y R O A D M A P 2021Master Roadmap Overview
water reuse in the Arizona Sun Corridor tends to be limited to locations where reverse osmosis (RO)
concentrate can be discharged to rivers that already have elevated salt concentrations. Cities in
the Front Range and Piedmont Atlantic Megaregions also face water stress. However, the lack of
suitable locations for brine discharge, coupled with relatively low salt levels in source waters, have
incentivized potable water reuse projects that do not employ desalination. Potable water reuse
projects in these megaregions tend to employ advanced water treatment technologies, like ozonation
and activated carbon sorption, to eliminate the need for desalination and concentrate management.
AGRICULTURE
Total withdrawals
Washin
gton ire
ampsh
New H ont
Maine
Superior
Montana e
North Dakota Minnesota
Lak
Verm
Orego
n La
ke
an
Wisconsin Massachusetts
H
Lake Michig
Idaho
uro
rio
South Dakota Lake
Onta
rk
New Yo
n
Wyoming
Michigan Rhode Island
r ie
Lak
eE Connecticut
Iowa
Penn sylvania New Jersey
Nevad Nebraska
a District of Columbia
Utah Ohio
Illinois Indiana Delaware
Colorado West Maryland
Califo Virginia
rnia Kansas Missouri Virginia
Kentucky
North
Carolina
Arizona Tennessee
Oklahoma Arkansas EXPLANATION
New Mexico South
Carolina Water withdrawals,
Mississippi
in million gallons
Georgia
Alabama per day
Texas 0 to 200
Hawaii Louisiana
201 to 1,000
Fl
or 1,001 to 5,000
5,001 to 15,000
ida
Alaska West–East
division for Puerto
U.S. 15,001 to 19,000
Virgin
this report Rico
Islands
Figure 5. Irrigation water use by source and state, 20151
Similar regional differences are also evident in the Agriculture Sector, with irrigation practiced
to a much greater degree in the western part of the country. Among the Western states, California
struggles to control salinity and toxic geogenic species (e.g., selenium, boron, uranium) released
when irrigation is used during the cultivation of high-value crops (e.g., fruits, nuts), while the states in
the Great Plains tend to grow grain and forage (e.g., wheat, corn, alfalfa) under conditions in which salt
management is less of a concern. As a result, there are more opportunities to apply desalination and
water recycling technologies to treat drainage water from irrigated fields in California, where removal
of salts and geogenic contaminants are critical to the long-term sustainability of high-value agriculture.
Similar issues are of considerable interest to agriculture throughout much of the Southwest. Further
east, where water resources are more plentiful, control of nutrients and pesticides in nonpoint source
runoff originating in agricultural fields is a greater concern than salts and geogenic species.
From the standpoint of NAWI’s research program, inexpensive treatment processes that are capable
of removing nutrients and pesticides from tile drains or small streams would have considerable inter-
est in this part of the country, even if those areas are not engaged in a substantial amount of irrigation.
N AW I M A S T E R T E C H N O L O G Y R O A D M A P 2021 19Master Roadmap Overview
POWER
Regional differences also affect water use patterns in the Power Sector. Among the three
highest-populated states, considerable differences are evident in water sources and uses. California
mainly relies on seawater for cooling its thermoelectric power plants; this has been decreasing in
recent years as the state’s electricity producers decarbonize, regulations on once-through cooling
with seawater come into effect, and the state’s nuclear power plants are decommissioned.
20 N AW I M A S T E R T E C H N O L O G Y R O A D M A P 2021Master Roadmap Overview
Figure 6. Annual state-level energy and water flows in 2010 for California, Texas, and Florida4
Adapted from Greenberg et al., 2017
In contrast, Florida uses a combination of surface water and seawater for once-through cooling
of its thermoelectric facilities, and Texas, which lacks seawater access for many of its cities,
relies almost entirely on freshwater for thermoelectric cooling. Although all three states face
considerable water stress, their desalination and advanced water treatment needs are quite different.
California is unlikely to increase its water use in the Power Sector, but it might have need for high-
purity water if electrolysis for hydrogen production becomes popular, whereas Texas may convert
some of its once-through power plants to recirculating cooling plans and Florida may increase its
reliance on seawater cooling.
N AW I M A S T E R T E C H N O L O G Y R O A D M A P 2021 21Master Roadmap Overview
RESOURCE EXTRACTION
Total withdrawals
Washin
gton ire
ampsh
New H ont
Montana North Dakota Lak
e Superior
V e r m Maine
Minnesota
Orego
n La
ke
Massachusetts
an
Wisconsin
Hu
rio
Idaho South Dakota Onta
Lake Michig
Lake
ron
rk
Wyoming New Yo
Michigan Rhode Island
r ie
eE Connecticut
Lak
Iowa lvania
Nebraska Pennsy New Jersey
Nevad
a District of Columbia
Utah Ohio
Illinois Indiana Delaware
Colorado West Maryland
Califo Virginia
rnia Kansas Missouri Virginia
Kentucky
North
Carolina
Arizona Tennessee
Oklahoma Arkansas EXPLANATION
New Mexico South
Carolina Water withdrawals,
Mississippi
in million gallons
Georgia
Alabama per day
Texas 0 to 10
Hawaii 11 to 50
Louisiana
51 to 100
Fl
or
101 to 200
ida
Alaska U.S. 201 to 1,140
Puerto
Rico Virgin
Islands
Figure 7. Resource extraction withdrawals by state in 20151
Resource extraction also exhibits regional variation, with the greatest withdrawals for oil
and gas and mining occurring in Texas, Oklahoma, and the Southwestern United States. An
important feature of resource extraction is the fact that operations often take place in sparsely
populated areas, far from existing infrastructure, for electricity, supplies and waste disposal. These
characteristics increase interest within the industry in autonomous operations and treatment
processes that do not require frequent supply of reagents. In addition, the Resource Extraction
Sector must often source and treat its own water. In many cases, the activities involved in resource
extraction itself make water available (e.g., large volumes of water are extracted from oil and gas wells
and water is often generated when mine shafts are dewatered). This water often requires treatment
prior to use and/or release to the environment. In some cases, the main concerns are associated with
toxic constituents (e.g., metals, hydrocarbons) that are amenable to selective separation, whereas in
other situations, the water contains high concentrations of ions and must be desalinated prior to use
and/or disposal.
Given regional and temporal variations in water quality and water quantity, desalination of water from
resource recovery operations will only be of interest in a limited number of locations, whereas selec-
tive removal of toxic ions or ions that cause scaling or clogging when discharged to the subsurface
will be of broader interest.
22 N AW I M A S T E R T E C H N O L O G Y R O A D M A P 2021Master Roadmap Overview
INDUSTRIAL
COOLING BOILER PROCESS OTHER
55% 30% 10% 5%
Oil Refineries
60% 10% 25% 5%
Chemicals
Primary 85% 2% 4% 9%
Metals
35% 5% 55% 5%
Food and
Beverage
5% 10% 80% 5%
Pulp and
Paper
>95% - -Master Roadmap Overview
2.2. Approach to the Master Roadmap
The first step involved in identifying AOIs for the Master Roadmap was to screen the 89 AOIs
in the Water User Sector Roadmaps to eliminate topics that pertained to only a single water
sector. Although many of these topics are relevant to achieving our pipe-parity goals, they are more
appropriately funded by industry groups (e.g., the Electric Power Research Institute [EPRI], Water
Research Foundation [WRF]) and mission-driven government agencies (e.g., the U.S. Bureau of
Reclamation [USBR], U.S. Department of Agriculture [USDA], Environmental Protection agency [EPA]),
as noted in Figure 9.
Figure 9. NAWI Master Roadmap in the context of other opportunities
Next, we screened to remove AOIs falling outside of NAWI’s TRL 2–4 research mission. Finally,
we consulted NAWI’s RAC and Technical Team to identify cross-cutting AOIs omitted from the sector-
specific roadmapping process. The final set of AOIs were then grouped according to themes within
each of the A-PRIME Challenge Areas.
In the second screening step, we prioritized research that would benefit most from NAWI’s
research. AOIs where critical barriers to progress could be overcome by bringing established
approaches into the water sector were of particular interest. AOIs that were well aligned with unique
modeling, simulation, characterization, manufacturing, and testing capabilities of NAWI research
consortium members were also prioritized. In contrast, AOIs that were unlikely to result in substantial
advances within a five-year period (e.g., de novo development of water quality sensors) or exhibiting
substantial overlap with research underway in support of other sectors (e.g., development of
corrosion-resistant materials) were de-emphasized.
24 N AW I M A S T E R T E C H N O L O G Y R O A D M A P 2021Master Roadmap Overview
Finally, we analyzed the expected size of the opportunity and the potential for NAWI’s research
to make substantial contributions to pipe-parity. With respect to the size of the opportunity, we
considered factors such as the volume of water that would likely be treated with the technology
when it reaches maturity, the potential savings to users that could be realized by adoption of the
technology, and the number of water user sectors that are struggling with the problem that would be
addressed by the technology. Whenever possible, we attempted to use information from the Water
User Sector Roadmaps, Baseline Analyses, or other well-respected sources to quantify these values.
When this was not possible, we relied upon expert elicitation.
To analyze the opportunity for research to make substantial contributions to pipe-parity, we
employed findings from the baseline analysis. The NAWI baseline case studies provided facility-
level unit process details on cost and performance characteristics. NAWI evaluated 24 baseline case
studies, addressing water issues across sectors and scales (Figure 10). In some cases, we employed
scenario analyses to estimate the relative impact of research associated with some of the AOIs
(e.g., how much would the levelized cost of water decrease if a new technology increased water
recovery during desalination from 70 to 95 percent?). This approach was helpful in situations in which
research had the potential to improve the performance of an existing unit process. For those topics in
which research was more closely aligned with NAWI’s mission of enabling small-scale, autonomous
treatment systems, the analysis was focused on the potential for research to increase deployment of
systems (i.e., we relied upon our previous analysis of the merits of distributed, autonomous systems
described by Mauter and Fiske in their 2020 paper in "Energy & Environmental Science").6
Figure 10. Map highlighting location and end-use type of NAWI baseline studies
N AW I M A S T E R T E C H N O L O G Y R O A D M A P 2021 25Master Roadmap Overview
A summary of NAWI’s Priority R&D Investment priorities is depicted below (Figure 11). NAWI
researchers assisted in quantifying and ranking the AOIs and the A-PRIME and Circular Water
Economy Challenge Area priorities identified in the roadmapping effort. This analysis included
estimates of the potential impact advancements on individual facilities combined with estimates of
the extent to which issues and challenges are prevalent throughout end-use sectors. The potential
for application for nontraditional water treatment was calculated by averaging the number of water-
use sectors affected and the relative volume of nontraditional source waters affected if pipe-parity
were to be achieved. The potential for pipe-parity improvement was based on quantitative analysis
of NAWI baseline studies combined with experts’ qualitative assessment of the ability for these
technologies to improve pipe-parity across all metrics (e.g., lowering costs and energy use, increasing
resilience and reliability). Assessment was informed by baseline analysis of existing system costs
and energy performance as well as scenario analysis of future performance, whenever available. A
mid-range ranking indicates NAWI research would have an estimated net improvement to pipe-parity
metrics of about 25 percent for the targeted unit process and/or about 10 percent improvement to the
overall system for a representative affected facility or facilities.
Figure 11. Prioritizing PRIMA roadmap AOIs for inclusion in Master Roadmap. PRIMA AOIs with similar
scope are grouped for clarity. Marker color indicates the challenge area. Marker shape indicates
whether it was determined to be in NAWI’s scope. Marker size indicates the number of PRIMA AOIs
that were relevant to this topic. Some PRIMA AOIs are included in multiple topics.
26 N AW I M A S T E R T E C H N O L O G Y R O A D M A P 2021Master Roadmap Overview
NAWI’s Master Roadmap prioritization process produced 16 distinct AOIs that will guide
NAWI’s initial investments in high-priority research. Each Master Roadmap AOI draws from one or
more Power7, Resource Extraction8, Industrial9, Municipal10, or Agriculture11 roadmap AOI and can be
mapped to an A-PRIME or Circular Water Economy Challenge Area (Figure 12). Each Master Roadmap
AOI is described in detail in Section 4, and the NAWI PRIMA roadmaps are available on the NAWI
website (https://www.nawihub.org/roadmaps).
Figure 12. NAWI Master Roadmap AOIs mapped to PRIMA Roadmap AOIs
N AW I M A S T E R T E C H N O L O G Y R O A D M A P 2021 27Technical Challenges
3. TECHNICAL CHALLENGES
Discussion of challenges and knowledge gaps
associated with desalination and advanced water
treatment can be divided into two categories: technical
issues and non-technical issues. The technical issues
are the focus of NAWI’s research to promote the use of
nontraditional water. Although they are not the primary
focus of NAWI, non-technical issues are also important
considerations in efforts to create desalination and water
treatment technologies that are likely to be adopted. The
individual roadmaps contain thorough discussion of these
issues, which are summarized in the following section.
28 N AW I M A S T E R T E C H N O L O G Y R O A D M A P 2021Technical Challenges
3.1. Technical Challenges
Infrastructure Integration
In some cases, an entity operating in a remote location may recycle water or install a
desalination system that operates independently of existing infrastructure. More commonly,
water recycling and use of nontraditional water sources are integrated into established water
systems. As a result, their operation is enabled or constrained by the existing water system. In
general, nontraditional water sources will be more easily and readily adopted if they are physically
and technically compatible with existing plant and system designs, including piping, power supplies,
and storage limitations.
Historically, water systems were often designed to capture economies of scale associated
with treatment, water storage, and management. This resulted in conditions in which desalination
and water recycling systems need to be compatible with centralized systems to ensure continued
benefits from past investments and to integrate into existing management and regulatory institutions.
This is particularly relevant in situations in which new water sources will be transported in existing
water distribution systems. For example, the composition of drinking water produced by desalination
must be adjusted (i.e., re-mineralized) in a manner that minimizes the leaching of lead and copper from
distribution pipes and premise plumbing. To avoid added costs of replacing irrigation infrastructure,
recycled water also needs to be treated to reduce the amount of labile organic carbon followed by
addition of a disinfectant residual to minimize fouling of small-diameter pipes and irrigation nozzles.
The long service life of water treatment infrastructure magnifies the constraints that the need
for integration puts on new technologies. New approaches face greater barriers to adoption if
they disrupt the status quo and create stranded assets. This effect, often referred to as infrastructure
lock-in, affects the timing, design, space constraints, water quality parameters, and other criteria
for new water sources. Further, it can limit the timing for adoption of certain technologies. Water
innovations that advance nontraditional water must consider both the effects of infrastructure lock-in
that constrain their design and the ways in which these innovations exacerbate lock-in in the future.
In addition to these factors, water infrastructure in the United States has not been well
maintained and needs significant investment, particularly in the municipal sector. As
investments in infrastructure rehabilitation are made in the coming decades, an opportunity may arise
to create hybrid municipal systems that allow distributed treatment systems to work in harmony with
centralized systems. Such hybrid systems also may be adopted in the other water use sectors (e.g.,
industrial and agricultural water use).
For sectors located in remote areas (e.g., resource extraction, industry, water systems serving
small clusters of homes), infrastructure to access, transport, and store water; dispose of waste;
and provide related services (e.g., electric grid connection; internet) may not exist. It can be expen-
sive to develop this support network, especially when it is needed to meet fluctuating water needs.
Infrastructure is typically sized for peak water needs, which may only occur for periods of months to years
in the Resource Extraction Sector or seasonally in the Agriculture Sector. These demands have limited
flexibility, creating planning, storage, and/or treatment challenges that may be more significant for certain
nontraditional waters. When distributed treatment technologies are adopted in any sector, their flexibility
and modular nature may be an attraction: lowering costs, driving additional innovation, and promoting
pipe-parity for desalination and advanced water treatment for nontraditional water sources.
N AW I M A S T E R T E C H N O L O G Y R O A D M A P 2021 29You can also read