Maximising the use - and hence the value - of the 2011 and 2021 Censuses - Census Applications Conference University of Manchester - Keith Dugmore ...
←
→
Page content transcription
If your browser does not render page correctly, please read the page content below
Census Applications Conference
     University of Manchester

Maximising the use – and hence
 the value – of the 2011 and 2021
            Censuses

            16 July 2015

        Keith Dugmore
    Demographic Decisions Ltd.
“Maximising the use – and hence the value”
• Costs and Benefits?
     – Business cases for Censuses: costs can be measured – but estimating use,
       benefits, and value is much more complex
     – ONS’s recent path-breaking work – see Ian Cope’s presentation

•   Easier access to existing information, using the Web?
     – Great advances in visualisation and mapping of Census data products – see work
       by the Census Offices, and others, e.g. Oliver O’Brien’s DataShine presentation

• Derived classifications?
     – Neighbourhood classification (see Chris Gale’s presentation), and Workplace
       classification (see the work by the University of Southampton team)

Rather……….

• What more new information can we create from Census databases?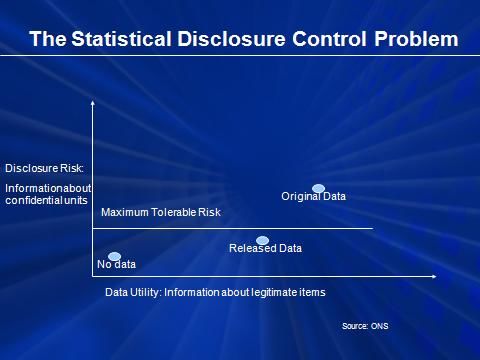
A question from ONS in 2011 – and the start of a journey

“Consider how we can best deliver census microdata to maximise
 its use while maintaining confidentiality”

This caused me to think about:

•     The context – the UK Censuses, & other datasets

•Some issues that arise

•Opportunities to create more information from 2011 (& 2021)

This story starts a long way back, analysing
Small Area Statistics……..
Context

The Census and its users
The Census as a warehouse of information

• The Census
   – Records for c. 25m households containing c. 60m people
• Aggregate statistics
   – Published tables – from simple univariate Key Statistics to complex Standard
     Tables
   – Specialist origin / destination tables
   – Commissioned tables – ad hoc requests
• Microdata files
   – Samples of Anonymised Records (SARs)
   – Longitudinal Study, linking a sample of records with births, deaths, etc.

   …………which set me thinking about the Census database as a warehouse of 100%
    microdata……
Census – the user sectors • Central government • Local government • Health Service • Academic • Commercial companies (end users) • Charities • The public • + Commercial Census Distributors (Value Added Resellers)
Census – user segments (within sectors)

  Numbers of
  users, and
their expertise                                 A. Census Specialists (Anoraks)

                                                    B. Mainstream Analysts

                                                             C. Occasional
                                                             (from students
                                                             to CEOs), & New

                  1980’s   1990’s          2000’s
Census users – major dimensions / clusters
• Expertise
– A. Census Specialists
– B. Mainstream Analysts
– C. Occasional & New
• How much / little time (in a month)?
– A. Census Specialists – several days, & can research complex products
– B. Mainstream Analysts – half a day to explore new/complex options
– C. Occasional & New – minutes, needing very simple products to get started
• Social research or geographical analysis?Social Research or Geographical Analysis?
Understanding
Multivariate social groups
analysis
[Smaller middle
ground, e.g.
describing /
comparing LAs]
Subject Comparing
detail small areas
1 or 2
variables
National Output Area
Geographical detailContext - the need for Confidentiality
Confidentiality & Statistical Disclosure Control:
Limits to access

• ONS’s SDC policies for all datasets: tables, & microdata

• Census Microdata – Methods
   – Anonymisation of individual records, plus mixtures of:

   – Limited datasets? “Safe data” (Small samples, perturbed or swapped records,
     reduced subject detail, reduced geographical detail)
   – Limited people? “Safe people” (e.g. Approved Researchers)
   – Limited locations? “Safe settings” (e.g. Virtual Microdata Laboratory)
   – Limitations by licenses? “Safe terms & conditions”
ONS: seeking the best balances between risk and utility
Context – 1991 & 2001 SARs

[These are the headlines; for more detail see the report for the University
     of Manchester “A business case for microdata files from the 2011
                     Census”, which can be Googled]
SARs’ attractions • Large sample sizes in comparison to surveys (>600,000) • Rich & flexible data • No / low cost (c.f. commissioned tables) • Convenience – if on own PC • Speed / Quick queries / Exploration • Testing before ordering tables • Scope for multivariate modelling • Time series 1991 / 2001 / 2011
2001 Census SARs files

                                         CAMS –
                                         Individual 3%
                                                           Secure laboratory
                                         Household 1%

          Household 1%
Subject
detail

                         Individual 3%
                                                           Special License
                                           SAMS
                                           5%
                                                            End User License

           National      Regional        Local Authority

                                 Geographical detail
SARs’ Accessibility & Use
Many
Numbers of
users and uses
Few
Accessibility
Maximise Limit Minimise
Detail Limited Moderate Considerable
Person Anyone Approved person Approved person & project
Place Own PC Own office National Laboratory
License End User Special CAMs LicenseSARs 1991 & 2001 – Uses & Value • Uses – Sources of ad hoc crosstabs – Multivariate analysis of individual records – Exploration, e.g. sizing populations before ordering commissioned tables • Value – some powerful examples, including: – Joseph Rowntree & DWP – labour market – GfK NOP – market research – University of Leeds – microsimulation – Scottish Executive – health comparisons – Carers UK – characteristics of carers – Office of the First Minister & DFM, Northern Ireland – investment from USA
But use of SARs 1991 and 2001? ……..small numbers

Use of SARs, 1991 and 2001
                                     1991               2001         2001
                                (Ind & HH files)   (Ind & SAMS)   (Other files)
Registered users
UK Academics (individuals)                   308            492
UK Non-academic organisations                 63             14
Overseas organisations                        18             17

Special License HH file
Projects                                                                     14

CAMS (Ind & HH files)
Projects                                                                     29

          Publications: 1991 c.400; 2001 only c.60 by 2008
Context – what else is going on in the
world?Computing, the Web, access, and data integration
• Computing
– Continuing increase in processing power
– Files of 10’s of millions of records are no longer a problem
• The Web
– Revolution in access
– Searching for data
– Online data analysis, or download
• Access to microdata
– ESRC’s UK Data Service
• Integration of datasets
– Scope for matching individual recordsCensus microdata files in other countries?
• IPUMS – standardised microdata files across many countries, but only
for academic researchers (not public domain)
• How do other countries’ SARs compare with the UK?
– Inevitably, many are not as advanced
– Australia, Canada, New Zealand – broadly similar issues & approaches to UK
– France (rolling Census) – “Eight public use microdata files will be released every
year: one household level, two individual level, and five focussed on movements”
– USA Public Use Microdata Samples – 1% & 5% files for 2000. “Free, no need for a
license, fantastic detail, used by schoolchildren aged 12”
– Finland – 100% longitudinal file 1970-2010
– Denmark – claim to be (even) better than Finland: “World champion.....we have a
Census every day”, but charge for special analyses of microdataBig databases, and access to them – other organisations?
Market Research Company – GfK /NOP
• GfK / NOP’s Financial Research Survey
– 60,000 records X 20 years – >1 million in all
– Anonymised records
• “It’s easy to control access via a portal”
– No hands on the individual records
– Control access to different parts of the survey
– Control type of access, e.g. Pre-canned crosstabs, or DIY special tables
– Can build in checks, e.g. Cells of 1 or 0
– Track usage
– Version control
– GfK / NOP uses www.dotnetnuke.com
• Multivariate analysis too?
– “Yes, we set up tools”Retail – Marks & Spencer
• 10m+ shopping baskets every week
– 5m M&S credit cards in circulation
– Others use other credit cards (& can be analysed, but not identified)
– Others pay cash & cannot be identified
– Volume: circa 14 billion rows of data spanning 120 weeks
• Customers are anonymised: unique number; also hold gender, age,
postcode
• Data held on virtual servers; analysed at HQ in Paddington
• Analysed by creating 3 data marts (quicker for analysis)
– 100% of shops with M&S payment card
– Medium % sample of transactions with other cards (for speed; less accurate))
– Low % sample of cash transactions (again, for speed)Department for Work and Pensions
• Data & databases
– Huge benefits, employment and National Insurance files for c.60m people in GB, +
some Northern Ireland
– C. 6,000 databases on strictly controlled servers in a few locations – but users (in
various locations) have a shared network with access to approved data only
• Users, access & analyses
– DWP staff often use 100% files (for an approved subset of variables) c.f. samples
– DWP offers many tables as an online service – BUT it actually draws on (lots of)
pre-canned tables (more efficient, & less SDC risk)
– DWP also has an ad hoc tables service
– DataLab concepts ( i.e. strict procedures, limited access, management controls,
auditing), some differences when compared with ONS VML, due to legislation – NB
only for contracted researchers. Infrequent use – mainly a fallback. No bespoke
location (uses normal offices).
• Practical issues
– SDC measures: Standard/guidance exists. Risk based decision can vary from
standard i.e. impact is taken into account – less rounding of low risk analysis
– Software / Data sharing / Operations – strictly implemented to meet HMG IA
standards, broadly similar to HMRC5 Issues
1. Maximising use: simple data + easy access + speed

• Published Census tables as products – meeting needs (& potentially
  creating further awareness/demand)
• Current supply/push
   – Users choose between datasets that are on offer (alternative census products, and
     / or government sample surveys, new longitudinal surveys, admin stats, etc.)
• Only the top of the user pyramid might think to ask “Can I have XYZ
  too........?”
• Microdata as the source of flexibility
• Few users of 2001 SARs – why?
• Few orders for 2001 commissioned tables – why?
• Future scope for encouraging demand/pull
• Need to improve access to increase use/utility
2. What is “Utility” • Data Utility: “The utility of microdata that has undergone Statistical Disclosure Limitation methods is based on whether statistical inference can be carried out and the same analysis and conclusions drawn on the perturbed data to the original data.” • This approach was developed when ONS was seeking to establish the extent to which data could be damaged without rendering it useless • But Utility has another meaning too..........
Utility
"That property in any
object, whereby it tends to
produce benefit,
advantage, pleasure, good,
or happiness…….It is the
greatest good to the
greatest number of people
which is the measure of
right and wrong.”

Jeremy Bentham.
Introduction to the
Principles of Morals and
Legislation (1789)
Utility – SRSA 2007

• Statistics and Registration Services Act 2007
    – “Statistics that serve the public good”

• The Code of Practice
    – Principle 1. Meeting user needs
    – Principle 5. Confidentiality, including:
    – “Ensure that arrangements for confidentiality are sufficient to protect the
      privacy of individual information, but not so restrictive as to limit unduly the
      practical utility of official statistics.”

• Risk, & Utility/Benefits
    – Data utility PLUS Practical utility
    – Need to review the balance
3. Risk, and protecting confidentiality
• Census Microdata – Methods
– Anonymisation of records, plus mixtures of:
– Limited datasets? [= Reducing potential use]
– Limited people? [= Reducing potential use]
– Limited locations? [= Reducing potential use]
– Limitations by licenses / terms & conditions? …Need not reduce potential use
• Reconsider the mix? Simplify but strengthen licences (e.g. illegal to
claim identification, severe penalties, etc.), & relax other limits?
• Also, more automated methods of SDC – vetting queries, vetting
outputs?4. “Microdata” – perception..........and fear
• Individual records
• Anxiety / fear that users might pore over them
• A common refrain from analysts: “I’m not interested in individual
records or odd outliers”
• Might the need be reduced by remotely running jobs on samples or
the full database?
• Focus on framing the query & getting the analysis, with no opportunity
to look under the bonnet?
• Microdata as the fundamental resource
– A source of some microdata products – sample files of records
– Plus…..access to microdata the other side of a firewall5. Samples, and / or 100%?
• Samples
– Value for complex crosstabs & mutivariate analysis (NOT detailed geographical
analysis) – relationships, patterns
– Advantage: not the universe, so can’t allege a unique record (?)
– Quick exploration on small(ish) files
– Sizing, before running on 100% file
– 2011 round of SARs for the established market
– + larger SARs samples, e.g. 50% sampling fraction? (But any proven value
elsewhere? A sledgehammer to crack a nut? Neither fish nor fowl?)
• 100%
– Huge value for statistics down at Output Area level
– Commissioned tables: no worries about external access to microdata recordsWays of extending use (& increasing value) – 4 opportunities
NOT
yet more published
     tables…
1. Extending the concept of SARs products
• 2011 Products
– Individual & Household files again
– Public Use Sample – YES!
But also, further scope for:
• Bespoke SARs
– Individual – with geodemographic classification(s)
– Individual – Special Local Authority. Target number of persons (e.g. 10,000)
• Ad hoc small samples on demand
– For particular projects. Very few variables (reducing risk) but in considerable detail,
e.g. age, ethnic origin2. Synthetic microdata as a testbed (?)
• Proposed by several people familiar with SARs
• A test bed with no risk; explore, then:
– access detailed SARs
– or request a commissioned table
• New Zealand experience:
– Small population; no SARs; synthetic file of 20,000; test queries (tabulations c.f.
multivariate analysis), then get them run on the 100% database. Very valuable.
• Trust for real results too? But only reliable for known relationships?3. Much easier remote commissioning of tables –
and a related thought about localised populations…..
• A slick Commissioned Outputs Engine, with automated SDC
• Multivariate counts
– Users’ needs, e.g. “I’m interested the numbers of males aged 18-30 of Social
Grade ABC1 who work within 1KM of Manchester Piccadilly Station”)
– Can be seen as a subset of a larger table
– Analogy to Spotify – selecting specific recordings
• The limitations of published tables
– SDC concerns about sparse populations (e.g. Bengalis in Bognor)
– But users often seek local concentrations (e.g. Poles in Peterborough)
• Benefits
– For specialists seeking quick variants on published tables
– New users asking queries rather than searching published tables.
– It could also expand the use of Origin / Destination data too3. Much easier remote commissioning of tables –
“Quick Table” and “Quick Count”? + Estimated variables?
• Have the Amazon or Trainline websites in mind.....
• Menus for selections, using SASPAC-like concepts
– Geog level (OA / ward, etc.); Geographical area (Ward, LA, 1 km radius, draw map
on screen, etc); Topic 1 & its Variables; Topic 2 & its Variables; Topic 3 & its
Variables; Output Excel / CSV / map, etc. Go to checkout. OK? Submit. Then wait
to see if it is permitted. If not, which of the following alternatives would be OK?
• “Quick Table”
– 2,3 (or more)-way
– The complete table / population
– But automated checking may flinch at some sparse cells
– There may be a way to resolve this paradox of tables.....
• “Quick Count”
– Just counts / cells of interest – not the entire table
– There’s strong interest in local concentrations of particular populations
• & add extra estimated (non-Census) variables as further options?
– Estimated Income would be of great interest4. Data sharing – linking / matching records
• Need to retain a link to Census name & address
• Longitudinal Study as a pioneering example
• Administrative records
– Pupil performance, Health, Benefits, Criminal records, etc
– Relate to household & personal characteristics from the Census
– Matching helped by the improved address register
– Perhaps pseudonymised records, as with existing Health studies
• ONS’s existing surveys too
• + Attribution of market research survey information (records /
modelled estimates / classifications) to census files
• This will require time and effort by specialists, but is of potentially
huge benefit to government policymakingIn conclusion…… • Censuses are uniquely rich & valuable resources • Budget for 2011 of £568m for the UK as a whole • Maximise the returns on the investment, given that the marginal costs of disseminating outputs / enabling access are so small (3% in 2001, 4% in 2011) • The last 100 yards…. • Microdata as the core • Maximise the range of data products, and also services
Demographic Decisions Ltd.

    Tel: (0044) 020 7834 0966
Email: dugmore@demographic.co.uk
  Web: www.demographic.co.uk
You can also read