May 2021 - Sports Backers
←
→
Page content transcription
If your browser does not render page correctly, please read the page content below
May 2021
                     Bike Ped Count Project Report
[Grab your reader’s attention with a great quote from the document or use this space to emphasize a key point.
To place this text box anywhere on the page, just drag it.]

Mid-year count of Bike and Pedestrian Activity
in Richmond, Virginia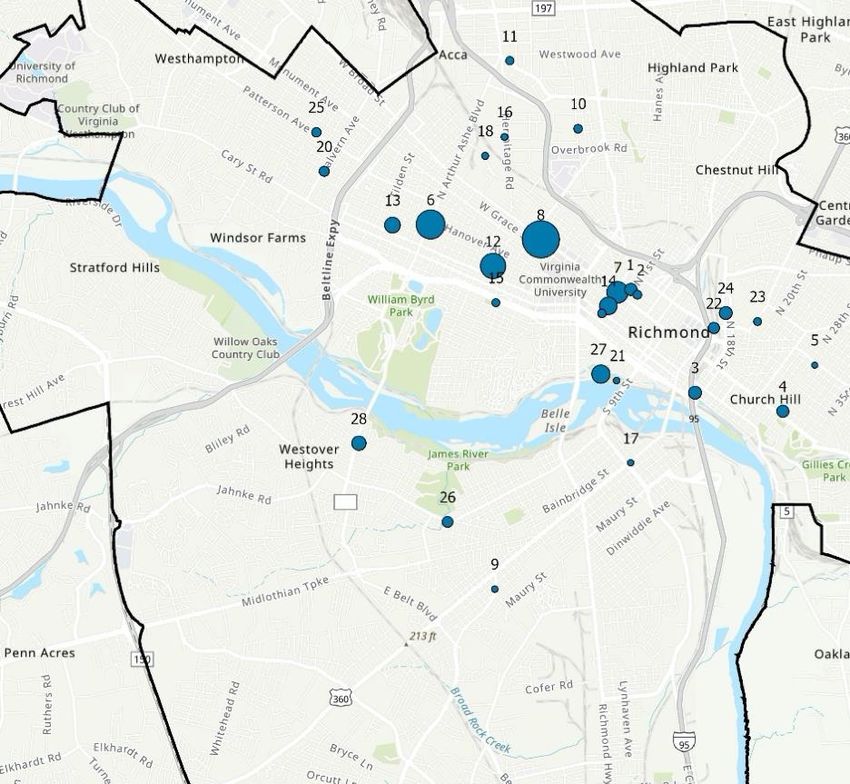
About Bike Ped Counts
Bike Ped Counts (BPC) is an annual count of bicycling and pedestrian activity across Richmond City streets and
major trails. The counts are conducted in May and September of each year. This volunteer-supported effort
gathers valuable information about biking and walking activity to improve and inform planning and design.
BPC is a joint effort between the Richmond City Health Department and Bike Walk RVA, a program of Sports
Backers, implemented since 2014 following The National Bicycle and Walk Documentation Project methodology
detailed below.
Key Takeaways
There has been an increase in overall bike and pedestrian activity in Richmond over the past few years, with a 59
percent increase in activity this spring compared to May 2019.
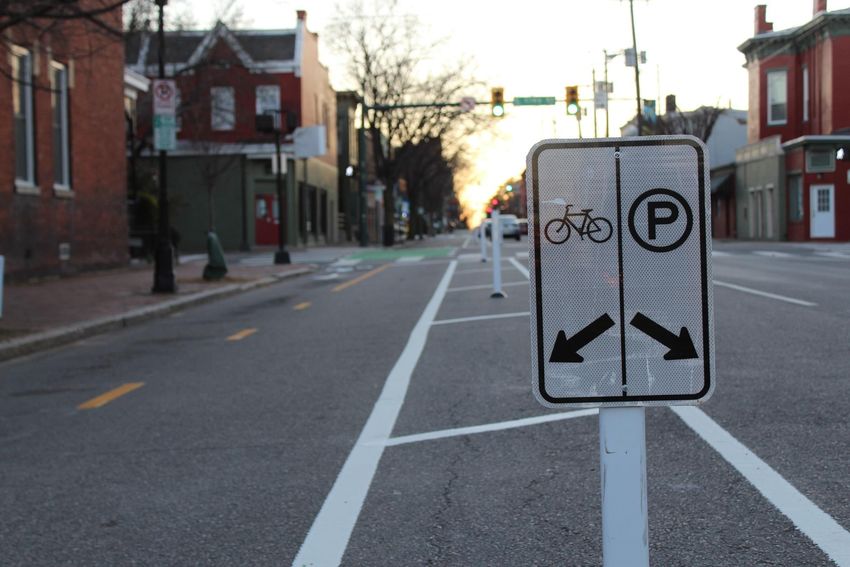
Bicycle activity remained high along corridors with bicycle infrastructure, such as Floyd Ave, and Brook
Rd.
In September 2020, Broad St (VCU) saw the highest pedestrian activity, this remained consistent during
May 2021 counts.
Broad St (VCU) had the highest combined 3-day counts for this spring’s BPC. This location also saw the
highest combined counts for the September 2020 Bike Ped Counts.
Malvern Ave saw the greatest percent increase in bicycle activity and the second greatest in pedestrian
activity compared to the last May BPC, which took place in 2019. This is notable due to the recent
Malvern Ave bike lane project completed in 2020 which spans from Cary Street to Cutshaw Ave.
Brook Rd saw the second highest change in bicycle activity with a 128% increase compared to May 2019.
Highest Bicycle Activity Highest Pedestrian Activity
(estimated cyclists per day) (estimated pedestrians per day)
Floyd Ave 698 Broad St (VCU) 3270
Franklin Ave 578 Arthur Ashe Blvd 2393
Broad St
MLK Bridge 428 1653
(Downtown)
Greatest Change in Activity Greatest Change in Activity
2019-2021 2019-2021
Malvern Ave ↑ 652% Arthur Ashe Blvd ↑ 1040%
Brook Rd ↑ 128% Malvern Ave ↑ 337%
Westover Hills Blvd ↑ 73% Brookland Pkwy ↑ 226%
Note: Due to the COVID-19 pandemic and state and local policies put in place to limit the spread of COVID-19,
there were no bike and pedestrian counts held in May of 2020. Therefore, percent change in activity was
calculated using May 2019 count data.
Data Collection and Analysis
Bike Walk RVA and the Richmond City Health District enlisted and trained volunteers to count the number of
pedestrians and bicyclists traveling along specified corridors in Richmond, VA. Following the National Bicycle and
1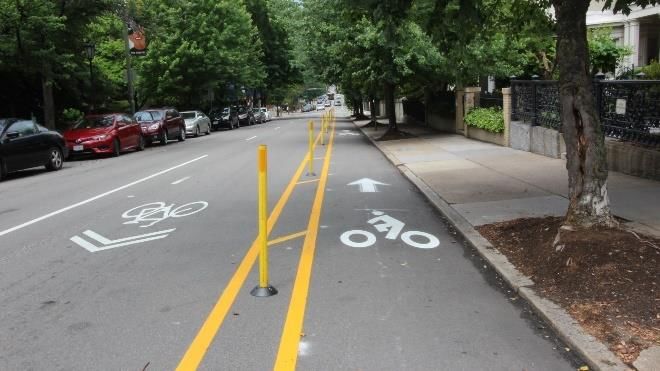
Pedestrian Documentation Project (NBPD) methodology, volunteers manually counted bicyclists and pedestrians
from 5:00pm – 7:00pm on three consecutive days in May.
Bike Ped Count volunteers were provided with the following tools:
Standard Screenline Count Form developed by NBPD. The Count Form allows volunteers to count
bicyclists and pedestrians at 15-minute increments. The sheet provided space to count pedestrians,
bicyclists, as well as people using other modes of transportation (e.g. skateboards, rollerblades, etc.).
Instructions for preparing and submitting the Count Form.
Support provided by the count coordinator to answer any questions volunteers may have had.
At each designated location, volunteers counted the number of bicyclists, on the street and on the sidewalk, as
well as the number of bikes attached to buses passing by. Pedestrian traffic was counted in addition to other
modes of transportation such as skateboards, scooters, and rollerblades. For each location where counts were
conducted, an average bike-ped count was calculated.
Bicycle and Pedestrian Activity Estimates
Volunteers collected spring counts at 28 locations across the city on May 11-13, 2021 (figure 1). Table 1 provides
the average number of pedestrians and bicyclists observed at each location during the 2-hour count period.
Figure 1. Map of May 2021 Count Locations. Icon size is proportional to combined bike/ped activity.
2
TABLE 1. 2-HOUR COUNT AVERAGE AND ESTIMATED DAILY USAGE
                                                             Bicyclists
Location           Biking 2- Walking    Biking     Walking   Floyd Avenue saw the highest bicycle
                     Hour    2-Hour   Estimated Estimated    activity this Spring with a reported
                   Average   Average    Daily       Daily
                                                             estimate of 698 cyclists daily. Floyd
                                        Usage      Usage
1st St              21         92       158        690       Avenue locations have been included in
2nd St               8         53        60        398       BPC since 2014 and have typically had a
17th St             23         97       173        728       high number of bicyclists - Floyd
29th St (south)      9        104        68        780       Avenue is a designated Bike Boulevard
29th St (north)      4         18        30        135       with generally slower moving traffic
Arthur Ashe         34        319       255        2393      than other east-west corridors in the
Blvd
                                                             City as Richmond’s first 20mph street.
Broad St            24        218       180        1635
(downtown)                                                   Franklin Street (578) and Martin Luther
Broad St (VCU)      34        436       255        3270      King Jr. Bridge (428) had high levels of
Broad Rock Blvd     11         20        83        150       bicycle activity as well. Franklin Street is
Brook Rd            25         33       188        248       the first and only two-way protected
Brookland           15         39       113        293       bikeway in the region. MLK Bridge is
Parkway
                                                             one of the main ways people travel
Floyd Ave (Fan)     93        210       698        1575
Floyd Ave           48        112       360        840
                                                             between the East End and
(Museum                                                      Downtown/MCV and beyond. This is
District)                                                    the 3rd highest location for bicycle
Franklin St         77        111       578         833      travel.
Grayland Ave        19         31       143         233
Hermitage Rd        17         16       128         120
Hull St              3         26        23         195
Leigh St            16         27       120         203
Main St             17         43       128         795
Malvern Ave         23         57       173         428
Manchester          14         14       105         105
Bridge
MLK Bridge          57         37       428         278
Mosby St            15         37       113         278
Oliver Hill Way     17        106       128         795
Patterson Ave       21         51       158         383      Figure 2 Franklin St. Contra-flow Bike Lane
Semmes/Forest       26         64       195         480
Hill                                                         Pedestrians
Tredegar St         43        153       323        1148      Broad St near Virginia Commonwealth
Westover Hills      52         90       390        675       University’s campus saw the highest
Blvd                                                         pedestrian activity this spring, with an
                                                             estimated 3270 pedestrians daily.
                                                             Arthur Ashe Blvd (2393) and Broad St
                                                             in downtown Richmond (1635) also saw
                                                             high pedestrian activity.

                                                                                                           3
*One day of counts for the Broad St (VCU) location was taken a block away from the designated count location. To collect as much data as possible, and to not discredit the efforts of our
volunteers, we included the information in this spring’s counts.
**Due to COVID-19 there was no count held in May, 2020
4WEATHER
The weather during the time of the count on Tuesday, May 11, was 72 degrees with clear to partly
cloudy skies. Wednesday, May 12 was 62 degrees at the time of the counts and overcast. Thursday, May
13 was 74 degrees with clear to partly cloudy skies. Wednesday saw the lowest total pedestrian counts
of the three days, while Thursday saw the lowest bicycle activity.
NEW COUNT LOCATIONS
This spring, a location along the Hull Street corridor (7th/Hull) was added to the Richmond Bike and
Pedestrian Counts to enhance our understanding of bike and pedestrian travel along this corridor. The
location was selected based on pedestrian-involved crash data from recent years and community
feedback.
A NOTE ON DATA COLLECTION & ANALYSIS
One day of counts for the Broad St (VCU) location was taken one block away from the designated count
location. Count data for the day and location were included, but this shift should be noted when
comparing previous/future counts for this location.
Out of the 28 locations where counts were held this spring, 6 had one day of counts (29th St north,
Arthur Ashe Blvd, Main St, MLK Bridge, Mosby St, and Oliver Hill Way), as opposed to three due to
volunteer capacity. This resulted in fewer observations, reducing the statistical reliability of estimate
calculations for these locations. However, single counts at these 6 locations remain useful for
understanding bicycle and pedestrian activity in these areas.
Statewide Bicycle and Pedestrian Tracking
In 2019, the Virginia Department of Transportation established a Statewide Bicycle and Pedestrian
Count Network, with count data from locations across the state. Gathered from multiple localities,
by various manual and automated counters, this data can be viewed in conjunction with this report.
Locations to Watch
At the time of the Spring 2021 counts, there were a few recently completed infrastructural projects
including 1st Street and Broad Rock Boulevard. Count data in the coming years will demonstrate any
effects of the infrastructure improvements.
Acknowledgements
This report would not be possible without the help of our incredible volunteers. Thank you!
For any questions or concerns please feel free to email jada.jolley@vdh.virginia.gov
5Appendix A
APPENDIX A. ESTIMATED ACTIVITY AND PERCENT CHANGE BY LOCATION, 2019-2021
Estimated Percent Change Estimated Daily Percent Change in
Location Daily Bicycle in Bicycle Usage Pedestrian Pedestrian Usage
Usage from 2019 Usage from 2019
1st St 158 -16% 690 -12%
2nd St 60 -55.56% 398 -65.33%
3rd St 0 -100% 0 -100%
17th St 173 53% 728 9%
29th St (south) 68 N/A 780 N/A
29th St (north) 30 N/A 135 N/A
Arthur Ashe Blvd 255 -43.33% 2393 1039.52%
Broad St
(downtown) 180 -4% 1635 -15%
Broad St (VCU) 255 N/A 3270 N/A
Brook Rd 188 128% 248 38%
Brookland
Parkway 113 -35% 293 226%
Floyd Ave (Fan) 698 9% 1575 67%
Floyd Ave
(Museum District) 360 -4% 840 35%
Franklin St 578 -8% 833 -62%
Grayland Ave 143 -20.56% 233 -55.62%
Hermitage Rd 128 -51.33% 120 -69.23%
Hull St 23 N/A 195 N/A
Leigh St 120 N/A 203 N/A
Main St 128 N/A 323 N/A
Malvern Ave 173 652% 428 337%
Manchester Bridge 105 N/A 105 N/A
Martin Luther King
Bridge 428 7.54% 278 -19.42%
Mosby St 113 N/A 278 N/A
Oliver Hill Way 128 N/A 795 N/A
Patterson Ave 158 17% 383 11%
Semmes/Forest
Hill 195 -26% 480 49%
Tredegar St 323 N/A 1148 N/A
Westover Hills
Blvd 390 73% 675 20%
6Appendix B
APPENDIX B. COUNT LOCATIONS 2014-2021
YEAR AND MONTH OF DATA COLLECTION
2014 2015 2016 2017 2018 2019 2020 2021
LOCATION May Sep May Sep May Sep May Sep May Sep May Sep Sep May
1st St New 2017 location
(between
Clay St and
Marshall St)
2nd St New 2017 location
(between
Clay St and
Marshall St)
3rd St New 2017 location
(between
Clay St and
Marshall St)
8th St
(between
Main St and
Cary St)
9th St
(between
Main St and
Cary St)
17th St New 2017 location
(between
Cary St and
Dock St)
29th St ( New 2017 location
between
P St and Q
St)
29th St New 2017 location
(between
Marshall St
and Broad
St)
Boulevard
(between
Grove and
Hanover
Ave)
Boulevard
Bridge (at
toll plaza)
Broad St
(between
Lombardy St
and Ryland
St)
7Broad St
(between
Adams St
and Foushee
St)
Brook Rd
(between
Hammond
Rd and
Edgehill Rd)
Brookland
Parkway
(between
Hermitage
Rd and
Chatham Rd)
Cannon
Creek
Greenway
(south of
Brookland
Parkway)
Floyd Ave
(between
Allen St &
Granby St)
Floyd Ave
(between
Belmont Ave
and Auburn
St)
Franklin St
(between
Adams St
and Foushee
St)
Grayland St
(between
Allen St and
Randolph St)
Hermitage St
(between
Cumming Dr
and Road
Miller)
Hull St New 2021 location
(Between 7th
St and
Commerce
Rd)
W Leigh St
(between
Myers St and
DMV Dr)
Main St
(between
8Adams St
and Foushee
St)
Malvern Ave New 2017 location
(between
Grove Ave
and Hanover
Ave)
Manchester
Bridge (at
mid-span)
Martin
Luther King
Bridge (at
mid-span)
Mosby St New 2020 Location
(between P
St and Q St)
Oliver Hill New 2020 Location
Way
(between
MLK Bridge
and Coalter
St)
Patterson New 2017 location
Ave
(between
Woodlawn
Ave and
Sauer Ave)
Semmes
Ave/Forest
Hill Ave (at
Carson St)
Tredegar St New 2020 Location
(between
Brown’s
Island and
5th St)
VA Capitol
Trail (at
Almond
Creek)
Westover New 2017 location
Hills
(between
New Kent Rd
and Evelyn
Byrd Rd)
Williamsburg New 2017 location
Ave (at
Gillies Creek)
9You can also read