MD, USA segmentation and deep neural network
←
→
Page content transcription
If your browser does not render page correctly, please read the page content below
Automated brainstem parcellation using multi-atlas
                                                        segmentation and deep neural network
                                                             Magnus Magnussona , Askell Loveb,c , and Lotta M. Ellingsen*a,d
                                             a
                                              Dept. of Electrical and Computer Engineering, University of Iceland, Reykjavik, Iceland
                                                            b
                                                              Dept. of Medicine, University of Iceland, Reykjavik, Iceland
                                                     c
                                                       Dept. of Radiology, Landspitali – University Hospital, Reykjavik, Iceland
                                            d
                                              Dept. of Electrical and Computer Engineering, The Johns Hopkins University, Baltimore,
                                                                                      MD, USA
arXiv:2102.03281v1 [eess.IV] 5 Feb 2021

                                                                                          ABSTRACT
                                          About 5-8% of individuals over the age of 60 have dementia. With our ever-aging population this number is
                                          likely to increase, making dementia one of the most important threats to public health in the 21st century. Given
                                          the phenotypic overlap of individual dementias the diagnosis of dementia is a major clinical challenge, even with
                                          current gold standard diagnostic approaches. However, it has been shown that certain dementias show specific
                                          structural characteristics in the brain. Progressive supranuclear palsy (PSP) and multiple system atrophy (MSA)
                                          are prototypical examples of this phenomenon, as they often present with characteristic brainstem atrophy. More
                                          detailed characterization of brain atrophy due to individual diseases is urgently required to select biomarkers
                                          and therapeutic targets that are meaningful to each disease. Here we present a joint multi-atlas-segmentation
                                          and deep-learning-based segmentation method for fast and robust parcellation of the brainstem into its four sub-
                                          structures, i.e., the midbrain, pons, medulla, and superior cerebellar peduncles (SCP), that in turn can provide
                                          detailed volumetric information on the brainstem sub-structures affected in PSP and MSA. The method may
                                          also benefit other neurodegenerative diseases, such as Parkinson’s disease; a condition which is often considered
                                          in the differential diagnosis of PSP and MSA. Comparison with state-of-the-art labeling techniques evaluated on
                                          ground truth manual segmentations demonstrate that our method is significantly faster than prior methods as
                                          well as showing improvement in labeling the brainstem indicating that this strategy may be a viable option to
                                          provide a better characterization of the brainstem atrophy seen in PSP and MSA.
                                          Keywords: MRI, brainstem, segmentation, labeling, dementia, Parkinson-plus syndromes, convolutional neural
                                          network

                                                                                     1. INTRODUCTION
                                          The brainstem has four main sub-structures, i.e., the midbrain, pons, medulla oblongata, and superior cerebellar
                                          peduncle (SCP). Recent research enabled by developments in MR imaging and image processing have begun
                                          to elucidate systematic relationships between area ratios and diameters of different brainstem sub-structures
                                          and the diagnoses of PSP and MSA.1 These include methods to manually trace the midbrain and pons areas
                                          from the midsagittal slice followed by automated calculation of the midbrain to pons (M/P) area ratio.2 Other
                                          methods measure the diameters of the middle cerebellar peduncle (MCP) and SCP to calculate the Magnetic
                                          Resonance Parkinsonism Index (MRPI),3 MRPI=(P/M)x(MCP/SCP). Both the M/P ratio and the MRPI have
                                          shown to differ significantly in PSP compared with controls and the MRPI has been shown to correlate with the
                                          clinical evolution from Parkinson’s disease (PD) toward PSP.2, 4 Current neuroimaging correlates of MSA lack
                                          sufficient sensitivity and specificity to be used as reliable markers of MSA, however, current diagnostic criteria
                                          regard atrophy of pons as a supportive feature for possible MSA. These and other similar studies have two key
                                          limitations: First, most (although not all5 ) require manual delineations, limiting their use in large systematic
                                          research studies and clinical settings; and second, they only consider the area of the structures traced from a
                                             *E-mail: lotta@hi.is
single midsagittal slice giving a limited and potentially inconsistent view of the three-dimensional (3D) brain
structures.
    Recent advances in 3D image processing of MRIs have enabled the investigation of volumetric changes in
the brainstem. One publication is available5 on an algorithm performing automated segmentation and labeling
of the brainstem into its four main sub-structures, which is now publicly available as a separate module in
FreeSurfer.6 To get the brainstem sub-structures, one first needs to segment the whole brain using FreeSurfer’s
recon-all algorithm. This first step provides a segmentation of the whole brain, including the brainstem as one
unit. Then the brainstem module is run to get the separate brainstem parcellation. Although highly successful in
3D segmentation, FreeSurfer’s key limitation is that it can take multiple hours to process a single scan, limiting
its use in larger studies as well as in the clinical setting. Other brainstem parcellation approaches reported in
the literature segment two or three sub-structures instead of the four main brainstem structures.7, 8
    Characteristic patterns of atrophy have been described in both PSP and MSA, however, for many of these
patients, the current gold standard (i.e., radiologist’s evaluation) is rather nonspecific. Many overlapping clinical
features are seen in PSP and MSA and this commonly leads to misdiagnosis with PD or Alzheimer’s disease.
A major diagnostic challenge remains to identify and optimize the specific characteristics that can separate
individual diseases at early stages, as only with robust early detection can investigators start testing possible
therapeutic strategies and identify the underlying causes of these disorders.
    Here we propose a fast, accurate and robust 3D brainstem parcellation algorithm that addresses the key
diagnostic imaging challenges by providing a detailed segmentation and labeling of the four brainstem sub-
structures, i.e. the midbrain, pons, medulla oblongata, and SCP. The method uses a multi-atlas segmentation
algorithm to automatically generate training data for a deep convolutional neural network (CNN), without the
need for time consuming manual delineations of large training sets. The method provides significantly faster
results than currently available state-of-the-art methods (less than one second rather than hours) for each new
subject. This tool will enable faster and more accurate quantifications of brain atrophy in 3D that we hope will
enable more robust differentiation of patients with PSP, MSA, and other neurodegenerative diseases at earlier
stages than is currently possible.

                                                 2. METHOD
2.1 Manual delineations
Detailed ground truth data is the key prior information for automated multi-atlas segmentation methods as
well as being critical for the evaluation of automated labeling methods. For developmental purposes we used
imaging data from Neuromorphometrics (www.neuromorphometrics.com), comprising T1-weighted MRIs and
corresponding atlas images, each with 134 manually labeled anatomical structures [see Figure 1(a)-(b)]. In these
images the brainstem was labeled as a single unit. We developed a new brainstem delineation protocol for detailed
and robust parcellation of the brainstem into midbrain, pons, medulla, and SCP, for the two main purposes of 1)
having a strict guideline to ensure that each scan would be labeled in the same fashion to maximize robustness
of the automated segmentation method; and 2) to have detailed and easy to follow guidelines for future manual
delineations of new brain scans. The delineation protocol was based on the protocol in5 and expert guidance from
an experienced neuroradiologist. A total of 15 MRIs were manually labeled according to our new delineation
protocol [see Figure 1(c)] to be used as atlases in our multi-atlas segmentation approach. We used the Medical
Image Processing, Analysis, and Visualization tool (MIPAV, see mipav.cit.nih.gov) for manual labeling.

2.2 Multi-atlas segmentation and generation of training data
One of the main requirements for the development of a robust and accurate deep learning-based segmentation
method is having a rich set of labeled training data. Manual segmentation is still the current gold standard for
brain images; however, they are laborious and time consuming to generate. Here we utilized the multi-atlas-
segmentation framework of the robust dictionary learning and label propagation hybrid (RUDOLPH) method9
to automatically segment the four brainstem sub-structures. We incorporated the 15 subjects from Neuromor-
phometrics that were manually labeled according to our delineation protocol into the RUDOLPH framework and
adjusted the algorithm to account for the new brainstem labels. This provided us with automated labeling of
the sub-structures of the brainstem to be used as training data for our CNN.
Figure 1. The figure shows sagittal (top) and coronal (bottom) views of (a) T1-weighted MRI and (b) corresponding
manual delineations from Neuromorphometrics; and (c) manual labeling of the midbrain, pons, and medulla according to
our protocol.

   We applied the augmented RUDOLPH method to 35 MRIs from Neuromorphometrics to automatically
generate training data for our deep neural network. The MRIs were cropped to the size of 96 × 96 × 96 voxels,
from the original size of 240 × 285 × 240 voxels, to ensure that each image would only contain the brainstem
and nearby structures and to speed up the execution of the neural network. Finally, the brainstem labels were
extracted from these results to produce the final training set comprising five labels, i.e. the midbrain, pons,
medulla, SCP, and background. Using this approach enabled us to automatically generate our training set and
avoid the time-consuming work of manually labeling multiple training images.

2.3 Network architecture and training procedure
Our model was based on the 3D U-Net architecture.10, 11 A schematic of the network is shown in Figure 2. We
used five resolution steps, where each step in the contracting path consisted of two 3 × 3 × 3 convolutional layers,
with rectified linear unit (ReLu) activation,12 and a batch normalization13 layer after the latter convolutional
layer. The output of each batch normalization layer was fed to the corresponding resolution step in the expanding
path, and to a 2 × 2 × 2 max pooling layer in the contracting path. The last layer in the contracting path only
consisted of two convolutional layers, without batch normalization or max pooling; its output was then upsampled
and fed to the expanding path. The expanding paths steps mirrored the contracting path. Its inputs came from
the shortcut connection, after each batch normalization layer, which were concatenated with 2 × 2 × 2 upsampled
inputs from the previous step. This was followed by two 3 × 3 × 3 convolutional layers with ReLu activation.
The final output was a 1 × 1 × 1 convolutional layer, with a 5 class softmax activation.

                    Figure 2. A schematic of the 3D U-net architecture of the proposed method.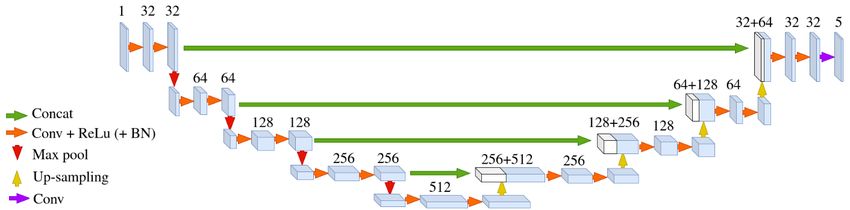
Figure 3. Brainstem segmentation results of a single subject using our model with different loss functions: (a) Dice loss
only; (b) weighted cross-entropy loss only; (c) Dice Loss using pre-trained weights from (b). (d) The manually labeled
mask shown for comparison. Only using the Dice loss resulted in dead ReLUs so no training occurred, while the weighted
cross-entropy loss oversegmented the MRIs.

    The intensity values of the MRIs were normalized to [0, 1]. The set of 35 RUDOLPH processed MRIs were
split into 27 training and 8 validation images. The original 15 manually delineated MRIs were used as test
images. Each voxel was one-hot-encoded, corresponding to one of five categories: 1. Background ' 91.6%;
2. Pons ' 5%; 3. Midbrain ' 2.25%; 4. Medulla ' 1.1% ; and 5. SCP ' 0.08% of the data set. The
brainstem labeled voxels covered less than 10% of the entire data set. Class imbalance is a common problem in
biomedical image segmentation, where small structures need to be segmented from a much larger background.
This problem was addressed by training our model using two loss functions. First, we pre-trained the model using
a softmax weighted cross-entropy loss.10 Second, we initialized our final model using the pre-trained weights and
trained using the Dice loss function,14 since neither loss function gave adequate results when used by itself [see
Figure 3(a)-(b)]. The model achieved high accuracy scores and low loss when combining pre-trained weights and
the Dice loss [see Figure 3(c)].
    The model was pre-trained for 20 epochs and trained for 200 epochs using the final model. A batch size
of 1 was used both in pre-training and training. Stochastic gradient descent with a learning rate of 0.01 and
momentum of 0.9 was used for optimization. No data augmentation was used.

                                                   3. RESULTS
We evaluated the proposed method on 15 manually segmented images (the current gold standard) using the
Dice similarity coefficient (DSC)15 and compared our method with the state-of-the-art segmentation method
FreeSurfer in addition to our augmented RUDOLPH method. A visual comparison is shown in Figure 4, in-
dicating improved segmentation of our proposed CNN over FreeSurfer and RUDOLPH. Visually, our proposed
CNN segments the sub-structures of the brainstem accurately, when compared to our manually delineated mask.
However, we note that there were inconsistencies between the segmentation of the whole brain module and the
brainstem module of FreeSurfer. Large parts of the midbrain and the pons were not labelled as part of the
brainstem in the whole brain module [see Figure 4 (b) superior axial, sagittal, and coronal slices]. The brainstem
module also produced pixelated and disconnected segmentations shown with yellow arrows in the lateral sagittal
and coronal slices [see Figure 4 (c)].
   The accuracy of the segmentation was evaluated quantitatively by calculating the DSC, between the predicted
segmentation from the CNN and the original manually delineated masks. The DSC measures the overlap between
two binary mask, X and Y, and is calculated using Eq. 1.

                                                           2|X ∩ Y |
                                                   DSC =                                                             (1)
                                                           |X| + |Y |
Figure 4. Brainstem segmentation results of five subjects from (b) FreeSurfer (FS) (whole brain); (c) FreeSurfer -
brainstem module (see yellow arrows for errors); (d) RUDOLPH using a 14-to-1 crossvalidation scheme (see red arrow
for error); (e) our proposed CNN; compared with (f) manual rater for (a) the subject’s T1-weighted MRI. The white
boxes show the zoomed in brainstem regions. Color code for the brainstem sub-structures in (c-f): Midbrain (yellow),
pons (red), medulla (green), SCP (cyan).
The range of DSC is [0,1], where 1 means perfect overlap and 0 means no overlap between the two masks, X and
Y. The average DSC for the brainstem CNN evaluated on 15 manually labeled subjects was: Pons: 0.96±0.0059;
midbrain: 0.93±0.015; medulla: 0.93±0.009; and SCP: 0.79±0.039. The DSC is high for the pons, midbrain,
and medulla oblongata. This indicates that the model accurately segments these structures. The DSC is lower
for the SCP, compared to the other structures, which can be explained by the size of the structure, as smaller
structures tend to have a lower DSC. We did not compute the DSC for FreeSurfer based on our manual masks,
since the two methods are based on slightly different delineation protocols. However, we note that our DSC
is substantially higher than previously reported numbers for FreeSurfer.5 Our method also yields a significant
speedup, segmenting each new subject in 0.5s compared to 8-12h using RUDOLPH or FreeSurfer.
4. DISCUSSION AND CONCLUSION
We present a new method for automated parcellation of the brainstem into its four sub-structures, i.e. mid-
brain, pons, medulla oblongata, and SCP, using a 3D U-net model. The method was trained on 35 labeledtraining images automatically generated by a multi-atlas segmentation method, thereby eliminating the need for
manually delineated training data. The method was compared with state-of-the-art segmentation methods and
evaluated on ground truth manual labels. The average DSC over 15 subjects was: Pons: 0.96±0.0059; midbrain:
0.93±0.015; medulla: 0.93±0.009; and SCP: 0.79±0.039. The method also provides significant speedup compared
with current methods, segmenting each new scan in only 0.5s. Future work includes further evaluation of the
method on a larger cohort of healthy subjects and patients with PSP and MSA. It is our hope that the proposed
method will provide researchers with the means to quantify the brainstem atrophy seen in PSP and MSA with
higher specificity than current approaches can provide.
ACKNOWLEDGMENTS
This work was supported by the RANNIS Icelandic Student Innovation Fund.
REFERENCES
[1] Constantinides, V. C., Paraskevas, G. P., Stamboulis, E., et al., “Simple linear brainstem MRI measurements
in the differential diagnosis of progressive supranuclear palsy from the parkinsonian variant of multiple
system atrophy,” Neurol Sci 39(2), 359–364 (2018).
[2] Silsby, M., Tweedie-Cullen, R. Y., Murray, C. R., et al., “The midbrain-to-pons ratio distinguishes progressive
supranuclear palsy from non-fluent primary progressive aphasias,” Eur J Neurol 24(7), 956–965 (2017).
[3] Quattrone, A., Nicoletti, G., Messina, D., et al., “MR imaging index for differentiation of progressive
supranuclear palsy from Parkinson disease and the Parkinson variant of multiple system atrophy,” Radiol-
ogy 246(1), 214–21 (2008).
[4] Quattrone, A., Morelli, M., Nigro, S., et al., “A new MR imaging index for differentiation of progressive
supranuclear palsy-parkinsonism from Parkinson’s disease,” Parkinsonism Relat Disord 53, 3–8 (2018).
[5] Iglesias, J. E., Leemput, K. V., Bhatt, P., et al., “Bayesian segmentation of brainstem structures in MRI,”
Neuroimage 113, 184–95 (2015).
[6] Fischl, B., “FreeSurfer,” NeuroImage 62(2), 774–781 (2012).
[7] Nigro, S., Cerasa, A., Zito, G., et al., “Fully Automated Segmentation of the Pons and Midbrain Using
Human T1 MR Brain Images,” PLOS ONE 9(1), e85618 (2014).
[8] Sander, L., Pezold, S., Andermatt, S., et al., “Accurate, rapid and reliable, fully automated MRI brainstem
segmentation for application in multiple sclerosis and neurodegenerative diseases,” Hum Brain Mapp 40(14),
4091–4104 (2019).
[9] Ellingsen, L. M., Roy, S., Carass, A., et al., “Segmentation and labeling of the ventricular system in nor-
mal pressure hydrocephalus using patch-based tissue classification and multi-atlas labeling,” SPIE Medical
Imaging 9784, 97840G. Epub 2016 Feb 27 (2016).
[10] Ronneberger, O., Fischer, P., and Brox, T., “U-net: Convolutional networks for biomedical image segmen-
tation,” in [Medical Image Computing and Computer-Assisted Intervention – MICCAI 2015 ], Navab, N.,
Hornegger, J., Wells, W. M., and Frangi, A. F., eds., 234–241, Springer International Publishing, Cham
(2015).
[11] Çiçek, Ö., Abdulkadir, A., Lienkamp, S. S., et al., “3D U-Net: Learning Dense Volumetric Segmentation
from Sparse Annotation,” CoRR abs/1606.06650 (2016).
[12] Nair, V. and Hinton, G. E., “Rectified Linear Units Improve Restricted Boltzmann Machines,” in [ICML],
807–814 (2010).
[13] Ioffe, S. and Szegedy, C., “Batch normalization: Accelerating deep network training by reducing internal
covariate shift,” in [Proceedings of the 32nd International Conference on Machine Learning ], Bach, F. and
Blei, D., eds., Proceedings of Machine Learning Research 37, 448–456, PMLR, Lille, France (07–09 Jul
2015).
[14] Milletari, F., Navab, N., and Ahmadi, S.-A., “V-net: Fully convolutional neural networks for volumetric
medical image segmentation,” in [2016 fourth international conference on 3D vision (3DV) ], 565–571, IEEE
(2016).
[15] Dice, L. R., “Measures of the Amount of Ecologic Association Between Species,” Ecology 26(3), 297–302
(1945).You can also read