Measurement of the Exterior of Bees: Comparison of Methods
←
→
Page content transcription
If your browser does not render page correctly, please read the page content below
Proceeding Paper

Measurement of the Exterior of Bees: Comparison of Methods †
Andrey S. Berezin * and Dmitriy V. Mitrofanov

                                          Federal State Budgetary Scientific Institution “Federal Beekeeping Research Centre” (FSBSI “FBRC”),
                                          Pochtovaya Street, 22, Ryazan Region, 391110 Rybnoe, Russia; dima-mitrofanoff2012@yandex.ru
                                          * Correspondence: mellifera@yandex.ru
                                          † Presented at the 2nd International Electronic Conference on Diversity (IECD 2022)—New Insights into the
                                            Biodiversity of Plants, Animals and Microbes, 1–15 March 2022; Available online:
                                            https://iecd2022.sciforum.net/.

                                          Abstract: A comparison of the two measurement methods using nonparametric criteria has made it
                                          possible to establish that the measurement results of some exterior features obtained through one
                                          method are significantly different from the results obtained using another measurement method.
                                          Measurement using Altami Studio 3.4.0 allows getting results with less trait variability between
                                          repeated measurements of one operator and between operators compared to MBS-9. With the help
                                          of the analysis of variance, it was established that two factors influence the measurement results:
                                          the measurement method and the operator performing the measurement, as well as the interaction
                                          of these two factors. Repeated measurements using the software will allow identifying operators
                                          prone to less variability of results, as well as controlling the accuracy of measurements.

                                          Keywords: exterior; honey bee; measurement method; repeatability; reproducibility

                                          1. Introduction
                                               The founder of the scientific approach to the study of body parts of bees is Kozhevni-
                                          kov [1]. He used a microscope, an ocular micrometer, and a drawing machine. Kozhevni-
                                          kov’s student and his follower Alpatov used an eyepiece micrometer for measurements,
                                          which was calibrated employing a micrometer lens [2]. A 6x or 10x magnifier with divi-
                                          sions [3], a projector, and a ruler were used abroad to measure exterior features [3,4]. Not
                                          so long ago various systems in which measurements are taken on a computer have come
Academic Editor: Matthieu Chauvat
                                          into use [5–7]. When choosing optics for measurements, one must take into account its
Published: 14 March 2022                  application and quality. It is known, for example, that microscope objectives are divided
                                          into groups according to the degree of perfection of aberration correction [8]. Alpatov,
Publisher’s Note: MDPI stays neu-
                                          Tjunin [9] pointed out the importance of spherical aberration of the microscope objective.
tral with regard to jurisdictional
claims in published maps and institu-
                                          The optical system of a flatbed scanner is also capable of distortion. Therefore, in the case
tional affiliations.
                                          of using it as a source for obtaining a digital image, it is necessary to determine in advance
                                          the location of the object. For example, one can select its central part [10] and/or test an
                                          existing device to select areas for the optimal placing of micro specimens [11].
                                                After obtaining a digital image of an object, it is measured in software designed for
Copyright: © 2022 by the authors.
                                          working with images with sufficient accuracy [12] and the required functions. Before
Submitted for possible open access
publication under the terms and con-
                                          starting work, the program is calibrated according to the image of the object obtained
ditions of the Creative Commons At-
                                          under the same conditions as the images of body parts of bees. Calibration of the software
tribution (CC BY) license (https://cre-   or device is the basis for obtaining reliable results in studies related to dimensions, and its
ativecommons.org/licenses/by/4.0/).       procedure depends on the measurement method used, and the choice of the method is
                                          not of great importance [12].
                                               There are some scientific publications in which the authors compare methods for
                                          measuring the length of segments of the “media” vein: “A” (YZ) and “B” (XY) on the basis

2nd International Electronic Conference on Diversity (IECD 2022)                                                https://iecd2022.sciforum.net/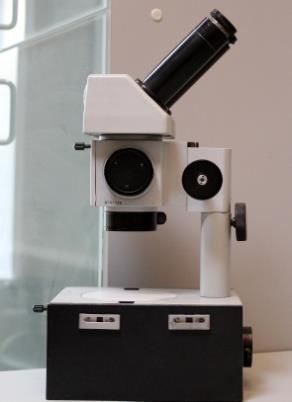
IECD 2022 2 of 7
of which the “cubital index” is calculated. So, Lomaev and colleagues compared the meas-
urement of these signs with the MBS-9 stereo microscope with automatic measurement in
the program they developed after receiving the image from the scanner [13,14].
We faced the following tasks:
• to determine which of the two methods will give the smallest coefficient of variation
between measurements made by one operator and between operators;
• to determine the repeatability and reproducibility of the methods used [15];
• to determine the reliability of the influence of two factors: the measurement method
and the operators who performed measurements, as well as their interaction on the
measurement results;
• to determine the advantages of one method over another.
2. Materials and Methods
The following hardware and software were used: MBS-9 stereoscopic microscope
(Figure 1a) supplied with an eyepiece with dioptre adjustment with a snap-in scale (the
scale division value is 0.1 mm); flatbed scanner Epson Perfection V600 Photo (with a res-
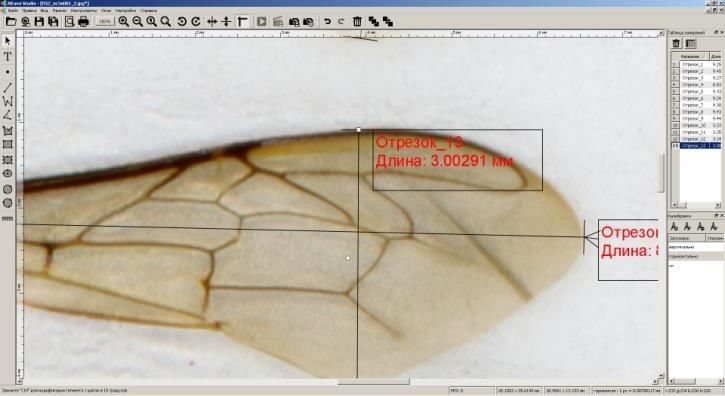
olution of 3200 dpi in 24-bit colour mode); Altami Studio 3.4.0® software (has a certificate
of conformity) were used to measure images of objects (Figure 1b); the Altami Studio
3.4.0® was calibrated before the measurement.
(a) (b)
Figure 1. (a) The microscope MBS-9; (b) Working window of the Altami Studio® program.
Biometric processing was performed: in MS Office Excel® software using the “Data
Analysis” package—“Descriptive Statistics”; the coefficients of variation were addition-
ally calculated [16]; analysis of repeatability and reproducibility, calculation of U (Mann-
Whitney) and T (Wilcoxon) criteria were performed using Statistica 13.0® software. All
measurements were performed according to the modified and supplemented method
which had been worked out by Alpatov [17].
Four slides were prepared with body parts of 30 bees from one colony placed on
them. Then four operators measured the sample, every three times using MBS-9. Further,
the specimens were placed in turn on the scanner glass in a certain place [11] and their
digital image was obtained. Then the same four operators measured them three times us-
ing Altami Studio 3.4.0® . The linear measurements made in the scale divisions were then
converted to millimetres dividing the wing length by 10, and the rest of the measured data
of the exterior features by 20.
3. Results
For each of the three dimensions of every operator taken separately, averages (M)
were obtained. Further, these averages were compared using non-parametric criteria, the
results are presented in Table 1.IECD 2022 3 of 7
Table 1. Indication of differences between two measurement methods using non-parametric criteria
Mann-Whitney (U) and Wilcoxon (T) (nMBS-9 = nAltami Studio = 12).
The Measured Characteristic Measurement Method M ±m U T
MBS-9 6.79 ± 0.031
Lx 1, mm 24.0 2 0.0 4
Altami Studio 6.71 ± 0.020
MBS-9 9.25 ± 0.067
Lkr, mm 64.0 25.0
Altami Studio 9.30 ± 0.006
MBS-9 3.22 ± 0.017
Wkr, mm 52.5 32.5
Altami Studio 3.21 ± 0.013
MBS-9 0.52 ± 0.005
LXY, mm 66.0 38.5
Altami Studio 0.53 ± 0.006
MBS-9 0.26 ± 0.001
LYZ, mm 19.0 2 4.5 4
Altami Studio 0.28 ± 0.009
MBS-9 2.27 ± 0.011
Lt, mm 28.0 1 12.0 2
Altami Studio 2.25 ± 0.009
MBS-9 4.85 ± 0.010
Wt, mm 1.0 2 0.0 4
Altami Studio 4.80 ± 0.006
MBS-9 2.19 ± 0.009
Lchl, mm 4.5 2 1.0 4
Altami Studio 2.15 ± 0.004
MBS-9 1.20 ± 0.011
Wchl, mm 38.5 19.5
Altami Studio 1.18 ± 0.007
1—MBS-9—microscope biological stereoscopic; Lx—the length of the proboscis, mm; Lkr—length of
the right forewing, mm; Wkr—width of the right forewing, mm; LXY—the length of the segment
“XY” of the “media” vein on the right forewing, mm; LYZ—the length of the segment “YZ” of the
“media” vein on the right forewing, mm; Lt—length of the third tergite (longitudinal distance),
mm; Wt—the conventional (transverse) width of the third tergite, mm; Lchl—length of the first
segment of the right hind tarsus, mm; Wchl—width of the first segment of the right hind tarsus,
mm.
Two opposite non-directional hypotheses were tested: H0 (or zero) M1 does not differ
from M2 and H1 (alternative or experimental) M1 differs from M2. The obtained empirical
values of the criteria were compared with the critical values found in the tables (according
to Gravetter, Wallnau [18]), and denoted by numbers from 1 to 4 (superscript). As our
hypothesis is non-directional, critical values were taken for two-sided distribution [19].
At the same time, one adhered to the following rule [20]: if the empirical value of U or T
is equal to or less than the critical value of the same criterion indicated in the table for p <
0.05, then H0 is rejected, but H1 cannot yet be accepted with confidence; if the empirical
value of U or T is equal to or less than the critical value of the same criterion indicated in
the table for p < 0.01, then H0 is rejected and H1 is accepted. For the Mann-Whitney crite-
rion (U), two levels of significance were determined (1—p < 0.05, 2—p < 0.01), and for the
Wilcoxon criterion (T) four levels of significance were determined (1—p < 0.1, 2—p < 0.05,
3—p < 0.02, 4—p < 0.01). The coefficients of variation were calculated: between the aver-
ages of three measurements of each of the four operators and between the operators by
each method.
A variance analysis of the repeatability and reproducibility of the process of measur-
ing the exterior characteristics of honey bees was carried out. Its results are presented in
Table 2, as well as the final graphs of the repeatability and reproducibility of the measure-
ment process for each measured exterior sign (Figure 2A,B).IECD 2022 4 of 7
Table 2. Components of the measurement process variance (S2) (as a percentage of the total varia-
bility) and the confidence index of the influence * (F) of factors.
Statistical Indicator Lx Lkr Wkr LXY LYZ Lt Wt Lchl Wchl
S2repeatability 9.4 16.3 16.2 34.7 4.7 57.8 17.0 14.3 8.3
S2reproducibility 43.1 8.7 0.0 0.0 8.0 30.6 0.0 12.0 0.0
Freproducibility 29.0 3 18.0 3 11.4 3 2.9 39.9 3 3.4 1 0.3 7.4 2 11.5 3
S2the interaction operator-method 1.3 75.0 83.8 65.3 43.3 0.0 18.3 6.5 88.6
Fthe interaction operator-method 1.4 14.83 16.5 3 6.7 2 29.4 3 0.3 4.2 1 2.4 32.8 3
S2between methods 46.2 0.0 0.0 0.0 43.9 11.6 64.7 67.2 3.1
F between methods 60.6 3 6.5 1 8.4 1 1.0 144.4 3 2.7 49.9 3 58.9 3 37.3 3
*—determined by the Table IX [20].
0,08 0,3
0,06
0,04 0,2
0,02
Deviation from Average, mm
Deviation from Average, mm
0,1
0,00
-0,02
0,0
-0,04
-0,06
-0,1
-0,08
-0,10
-0,2
-0,12
-0,14 -0,3
1 2 3 4 1 2 3 4
A Operators B Operators
Figure 2. Final graphs of measurement of repeatability and reproducibility: (A)—Lx, (B)—Lkr.
Explanations for Figure 2A,B. Three points connected by a vertical dashed line are
the deviations of measurements from the average value of the measurement for the cor-
responding method, the line on the left indicates the measurement performed on MBS-9,
and the right line indicates the measurement carried out on the computer using Altami
Studio 3.4.0® software. The length of these lines determines the measurement limit by the
same method, the longer they are, the greater the limit and the more inaccuracy is. Meas-
urements taken by one operator are enclosed in a dotted frame. The average deviation of
measurements for each operator is represented by a horizontal solid line in each frame.
Frame height is an indicator of measurement variability.
4. Discussion
The parallel use of the Mann-Whitney (U) test for independent samples and Wil-
coxon (T) test for dependent (Table 1) is justified by the fact that the measurement results
obtained by different methods can, on the one hand, be considered independent, and on
the other hand, they can be considered dependent on each other because they have been
received by the same operators. The use of the U criterion in dependent samples, while
considering them as independent, is justified in cases where the connections between
groups are weak and the differences between them are strong [21]. Since the critical values
for criterion U are given for two significance levels, in the given investigation its power
turned out to be equal to the power of criterion T. There is a slight difference in the average
values of the measured attributes obtained by the two measurement methods, which
amounts to a few hundredths of a millimetre.
Analysis of the coefficient of variation (CV) has shown that:
(1) comparing the measurements received by one operator, CVs were mainly less
when measuring on a computer using Altami Studio 3.4.0® than when measuring on MBS-
9;IECD 2022 5 of 7
(2) CVs between the average measurements of all operators using Altami Studio 3.4.0 ®
were also mostly less than when measuring on MBS-9;
In our opinion, the differences revealed between measurements using nonparametric
criteria may result from lower coefficients of variation of the measurement method using
Altami Studio 3.4.0 software compared to measurements using MBS-9.
According to Table 2, the measurement process is significantly influenced by the
measurement method, the operator, and operator-method interaction. The influence of
gradations of the “Operator” factor turned out to be statistically significant in seven out
of nine cases, with five cases being at the third significance level. The results obtained
indicate that the “human” factor has a significant effect when measuring exterior features.
The influence of the gradations of the factor “Method” turned out to be statistically sig-
nificant in seven cases as well, and there are five cases found at the third level of signifi-
cance, which can be explained by the utility of this or that method when measuring a
particular attribute. The interaction between the gradations of the factors “Operator” and
“Method” turned out to be statistically significant in six cases, with four cases being at the
third level of significance which is explained by a combination of the “human” factor and
the utility of a measurement method or the tendency of certain operators to carry out
measurements more accurately using one or another method. The variability of the meas-
urement result of the exterior sign “Proboscis Length” is significantly affected by the
measurement method and the operator using it. This, first of all, may happen because the
proboscis of bees is often bent, that is why its measurement on MBS-9 is approximated,
whereas the measurement using software allows observing it with maximum accuracy.
When measuring the length of an object using MBS-9, the measurement cut-off point often
falls between the graduations of the scale. So, when counting the sections, they are
rounded off to the nearest whole number of sections and, accordingly, the smaller the
measurement object, the more this rounding will influence the result. The measurement
carried out using software eliminates the necessity for rounding and the possibility of dis-
placement of a specimen during the measurement process.
Analyzing the obtained graphs (Figure 2A,B), we can conclude that the minimum
deviation from the average value by the measurement method in the majority of meas-
urement results was given by operators 1 and 4, which was indicated in smaller sizes of
their frames compared to operators 2 and 3. Accordingly, Operators 1 and 4 are more
preferable to participate in important measurements.
5. Conclusions
Measurement in software has a number of advantages over measurement on MBS-9:
• the ability to measure the curved proboscis correctly;
• scanned body parts of bees are conveniently stored in electronic form, exchanged by
e-mail with other researchers, as well as used for training employees within the or-
ganization to obtain identical results;
• less labor and time costs;
• while measuring in the program does not require any rounding;
• the operators who took part in the experiment agreed that it is more convenient to
measure on a computer than on MBS-9.
The disadvantage of Altami Studio 3.4.0 ® is the inability to determine the angle or
sign (+, −, 0) of discoidal displacement. The use of software and repeated measurements
carried out with it will allow identifying operators prone to less variability of results, as
well as control the accuracy of measurements. The use of digital images of objects will
allow more effective training in the measurement methodology and will make it possible
to exchange them via e-mail for cross-validations. Such validations are recommended not
only between laboratories involved in morphometry but also between experienced and
inexperienced operators [12].IECD 2022 6 of 7
Author Contributions: All authors have read and agreed to the published version of the manu-
script.
Funding: The work was performed as part of the state assignment: No. 0642-2019-0002.
Institutional Review Board Statement:
Informed Consent Statement:
Data Availability Statement:
Acknowledgments: The authors are sincerely grateful to the reviewers for comments on the text, as
well as to E. Larkina, A. Laskin, N. Markina, and I. Yazykov for participating in the tests as opera-
tors.
Conflicts of Interest: The authors declare no conflict of interest. The funders had no role in the
design of the study; in the collection, analyses, or interpretation of data; in the writing of the manu-
script, or in the decision to publish the results.
References
1. Kozhevnikov, G.A. Materialy po Estestvennoi Istorii Pchely (Apis mellifera L.), vyp. I [Materials to the Natural History of the Honey Bee
(Apis mellifera L.) Vol. I]; Izvestiya Imperatorskogo Obshchestva Lyubitelei Estestvoznaniya, Antropologii i Etnografii; Trudy
zool. otd., V. 14; Universitetskaja Tipografija: Moskva, Russia, 1900; Volume XCIX, 181p. (In Russian)
2. Alpatov, W.W. Porody Medonosnoi Pchely i ikh Ispol’zovanie v Sel’skom Khozyaistve [The Races of Honey Bees and Their Use in Agri-
culture]; Sredi Prirodi, Book 4; MOIP: Moskva, Russia, 1948; 183p. (In Russian)
3. Goetze, G.K.L. Die Honigbiene in Natürlicher und Künstlicher Zuchtauslese. Teil II: Beurteilung und Züchterische Auslese von
Bienenvölkern; Monographien zur Angewandten Entomologie, V. 20; Verlag Paul Parey: Berlin/Heidelberg, Germany, 1964.
https://doi.org/10.1002/mmnd.19650120110.
4. Ruttner, F. Biogeography and Taxonomy of Honey Bees; Springer: Berlin, Germany, 1988; 284p. https://doi.org/10.1007/978-3-642-
72649-1.
5. McMullan, J.B.; Brown, M.J.F. The influence of small-cell brood combs on the morphometry of honeybees (Apis mellifera). Apid-
ologie 2006, 37, 665–672. https://doi.org/10.1051/apido:2006041.
6. Quezada-Euán, J.J.G.; Paxton, R.J.; Palmer, K.A.; May Itzá, W.de J.; Tay, W.T.; Oldroyd, B.P. Morphological and molecular char-
acters reveal differentiation in a Neotropical social bee, Melipona beecheii (Apidae: Meliponini). Apidologie 2007, 38, 247–258.
https://doi.org/10.1051/apido:2007006.
7. Tan, K.; Radloff, S.E.; Hepburn, H.R.; Yang, M.; Zhang, L.; Fan, X. Environmentally-induced developmental effects on morpho-
metric characters of workers in Apis cerana colonies. Apidologie 2007, 38, 289–295. https://doi.org/10.1051/apido:2007011.
8. Skvortsov, G.E.; Panov, V.A.; Polyakov, N.I.; Fedin, L.A. Mikroskopy [Microscopes]; Machinostroenie: Leningrad, Russia, 1969;
503p. (In Russian)
9. Alpatov, W.W.; Tjunin, F.A. Beitrage zur Kenntniss der Variabilitat der Russellange bei der Honigbiene. Rev. Zool. Russe 1925,
5, 79. (In German)
10. Vasil’ev, A.G.; Vasil’eva, I.A.; Shkurikhin, A.O. Geometricheskaya Morfometriya: Ot Teorii k Praktike [Geometric Morphometrics: From
Theory to Practice]; KMK Scientific Press: Moskva, Russia, 2018; 471p. (In Russian)
11. Berezin, A.S. Testing digital acquisition devices images. In Sovremennye Problemy Pchelovodstva i Apiterapii [Modern Problems of
Beekeeping and Apitherapy]; Brandorf, A.Z., et al., Eds.; FSBCI “FBRC”: Rybnoe, Russia, 2019; pp. 27–37. (In Russian)
12. Meixner, M.D.; Pinto, M.A.; Bouga, M.; Kryger, P.; Ivanova, E.; Fuchs, S. Standard methods for characterising subspecies and
ecotypes of Apis mellifera. J. Apic. Res. 2013, 52, 1–27. https://doi.org/10.3896/IBRA.1.52.4.05.
13. Lomaev, G.V.; Kolbina, L.M.; Khan, N.V.; Nepeivoda, S.N.; Bondareva, N.V. Analysis of morphological characteristics of bees
in Udmurtia, Kirov and Perm regions. In Proceedings of the Peredovye Tekhnologii v Pchelovodstve: Materialy Nauchno-
Prakticheskoi Konferentsii [In Proceedings of the Advanced Technologies in Beekeeping: Materials of the Scientific and Practical
Conference], Rybnoe, Russia, 19 November 2002; GNU NIIP: 2003; pp. 10–13. (In Russian)
14. Lomaev, G.V.; Khan, N.V. Automation as a way to improve the method of measuring exterior characteristics of bees. In Pro-
ceedings of the Sovremennye Tekhnologii v Pchelovodstve: Materialy Nauchno-Prakticheskoi Konferentsii [In Proceedings of
the Modern Technologies in Beekeeping: Materials of the Scientific and Practical Conference], Rybnoe, Russia, 13–15 October
2003; GNU NIIP: 2004; pp. 38–42. (In Russian)
15. RIS 29-2013. Metrology. Basic Terms and Definitions; Standartinform: Moskva, Russia, 2014; 60p. (In Russian)
16. Plokhinskii, N.A. Biometriya [Biometrics]; MGU: Moskva, Russia, 1970; 368p. (In Russian)
17. Berezin, A.S. Methods of morphometry in determining the breed of honey bees. Biomics 2019, 11, 167–189.
https://doi.org/10.31301/2221-6197.bmcs.2019-16. (In Russian)
18. Gravetter, F.J.; Wallnau, L.B. Statistics for the Behavioral Sciences, 9th ed.; Matray, T., Ed.; Wadsworth Cengage Learning: Belmont,
CA, USA, 2013; pp. 712–714.IECD 2022 7 of 7
19. Sidorenko, E.V. Metody Matematicheskoi Obrabotki v Psikhologii [Methods of Mathematical Processing in Psychology]; OOO “Rech”:
Sankt Peterburg, Russia, 2000; 350p. (In Russian)
20. Runion, R. Spravochnik po Neparametricheskoi Statistike [Handbook of Nonparametric Statistics]; Finansy i Statistika: Moskva, Russia,
1982; 198p. (In Russian)
21. Gubler, E.V.; Genkin, A.A. Primenenie Neparametricheskikh Kriteriev Statistiki v Mediko-Biologicheskikh Issledovaniyakh [Application
of Nonparametric Statistical Criteria in Biomedical Research]; Meditsina: Leningrad, Russia, 1973; 142p. (In Russian)You can also read