Measuring gas vesicle dimensions by electron microscopy
←
→
Page content transcription
If your browser does not render page correctly, please read the page content below
bioRxiv preprint doi: https://doi.org/10.1101/2021.01.22.427725; this version posted January 22, 2021. The copyright holder for this preprint
(which was not certified by peer review) is the author/funder, who has granted bioRxiv a license to display the preprint in perpetuity. It is made
                                            available under aCC-BY-NC-ND 4.0 International license.

Measuring gas vesicle dimensions by electron
microscopy
Przemysław Dutka1 , Dina Malounda1 , Lauren Ann Metskas2 , Songye Chen2,3 , Robert C.
Hurt2 , George J. Lu2,5 , Grant J. Jensen2,4,* , and Mikhail G. Shapiro1,*
1 Divisionof Chemistry and Chemical Engineering, California Institute of Technology, Pasadena, CA 91125, USA
2 Divisionof Biology and Biological Engineering, California Institute of Technology, Pasadena, CA 91125
3 Beckman Institute, California Institute of Technology, Pasadena, CA 91125
4 Department of Chemistry and Biochemistry, Brigham Young University, Provo, UT 84602
5 Present address: Department of Bioengineering, Rice University, Houston, TX 77030
* Correspondence should be addressed to G.J.J. (jensen@caltech.edu) or M.G.S. (mikhail@caltech.edu)

ABSTRACT

 Gas vesicles (GVs) are cylindrical or spindle-shaped protein nanostructures filled with air and used for flotation by various
 cyanobacteria, heterotrophic bacteria, and Archaea. Recently, GVs have gained interest in biotechnology applications due to
 their ability to serve as imaging agents and actuators for ultrasound, magnetic resonance and several optical techniques. The
 diameter of GVs is a crucial parameter contributing to their mechanical stability, buoyancy function and evolution in host cells,
 as well as their properties in imaging applications. Despite its importance, reported diameters for the same types of GV differ
 depending on the method used for its assessment. Here, we provide an explanation for these discrepancies and utilize electron
 microscopy (EM) techniques to accurately estimate the diameter of the most commonly studied types of GVs. We show that
 during air drying on the EM grid, GVs flatten, leading to a ~1.5-fold increase in their apparent diameter. We demonstrate that
 GVs’ diameter can be accurately determined by direct measurements from cryo-EM samples or alternatively indirectly derived
 from widths of flat collapsed and negatively stained GVs. Our findings help explain the inconsistency in previously reported
 data and provide accurate methods to measure GV dimensions.

INTRODUCTION                                                               provide buoyancy at a lower energetic cost, they collapse at
                                                                           lower pressure. This is perhaps best reflected by analyzing the
Gas Vesicles (GVs) are hollow, gas-filled protein nanostruc-
                                                                           widths and collapse pressure of GVs isolated from Planctronix
tures natively expressed in certain types of cyanobacteria, het-
                                                                           spp. from nordic lakes of different depths (Beard et al. 1999,
erotrophic bacteria, and Archaea as a buoyancy aid (Walsby
                                                                           2000). Three types of GVs isolated from Planctronix spp. had
1994). Recently, it was discovered that the unique physical
                                                                           widths of approximately 51, 58, and 67 nm with respective
properties of GVs enable them to serve as genetically encod-
                                                                           collapse pressures of 1.1, 0.9, and 0.7 MPa, allowing them to
able contrast agents for ultrasound and other imaging methods,
                                                                           adapt to the hydrostatic pressure in different lakes (Beard et
allowing deep tissue imaging of cellular function (Shapiro,
                                                                           al. 2000; Dunton and Walsby 2005).
Goodwill, et al. 2014; Shapiro, Ramirez, et al. 2014; Bour-
deau et al. 2018; Lu et al. 2018; Farhadi et al. 2019, 2020;                   Despite the importance of GVs’ diameter for their biophys-
Lakshmanan et al. 2020). In addition, GVs are being applied                ical properties, there are significant discrepancies in values
to acoustic manipulation and therapeutic uses of engineered                reported in the literature. For example, the width of GVs
cells (Bar-Zion et al. 2019; Wu et al. 2019).                              from Anabaena flos-aquae (Ana) measured inside cells by
    Fully formed GVs adopt two predominant shapes - cylin-                 thin-section electron microscopy (EM) was approximately 70
ders with conical ends or spindle-like. The GVs may be 0.1-                nm (Walsby 1971), which is considerably smaller than the
2 µm in length, or even longer when heterologously expressed               value obtained by negative stain EM (ns-EM) for isolated
in more spacious mammalian cells (Farhadi et al. 2019). The                GVs - 136 nm (Lakshmanan et al. 2017). Similar discrepan-
mean diameter of GVs isolated from different species widely                cies can be observed for GVs from Halobacterium salinarum
varies, but is relatively constant for the same type of GV. There          (Halo), whose reported values range from 45 nm to 250 nm
is an inverse correlation between diameter and critical col-               (Simon 1981; Offner et al. 1998; Pfeifer 2012; Lakshmanan
lapse pressure (Hayes and Walsby 1986). This correlation has               et al. 2017). To some extent, these discrepancies could be
important evolutionary consequences. While wider GVs can                   explained by natural variability in diameter. However, anal-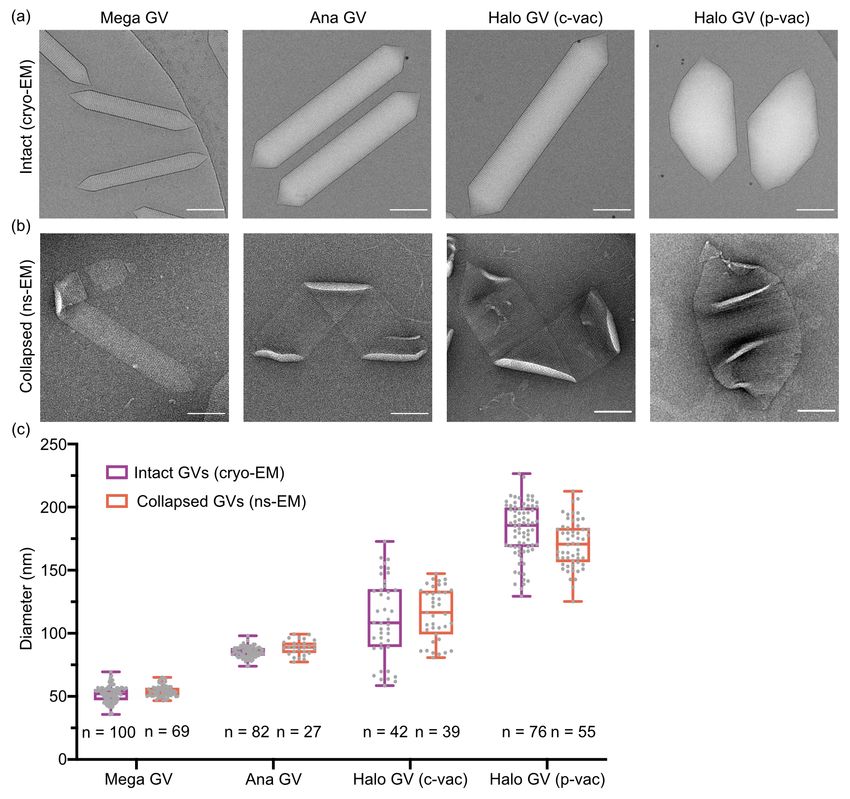
bioRxiv preprint doi: https://doi.org/10.1101/2021.01.22.427725; this version posted January 22, 2021. The copyright holder for this preprint
(which was not certified by peer review) is the author/funder, who has granted bioRxiv a license to display the preprint in perpetuity. It is made
                                            available under aCC-BY-NC-ND 4.0 International license.

ysis of width distributions for GVs from several species of
Cyanobacteria (Hayes and Walsby 1986) or Bacillus mega-
terium (Mega) (Farhadi et al. 2018) shows a narrow range.
This inconsistency in diameter measurement was investigated
almost 50 years ago by Walsby (Walsby 1971). He observed
that Ana GVs have a constant width of 70 nm when mea-
sured inside cells by thin-section EM, which was close to the
value measured for the purified sample imaged using a freeze-
etching technique (75 nm). In contrast, estimations by ns-EM
ranged from 70 to 114 nm (Walsby 1971). He suggested
that the stain used in EM leads to swelling of GVs, which
increases their diameter but has little effect on the length. As
an alternative approach for assessing GV diameter, Walsby
proposed indirect measurement based on the widths of flat
collapsed GVs. The diameter of Ana GVs measured using
this strategy was approximately 85 nm (Walsby and Bleything
1988). Archer and King gave another potential explanation
for discrepancies in GV measurements. They proposed that
the isolation process leads to deformations, increasing the
width of GVs (Archer and King 1984). Regardless of these
concerns, the diameter of GVs has been routinely assessed for
isolated specimens by ns-EM.
    As GVs have attracted more attention in biotechnology
applications, accurate estimates of their diameter have become
a critical input into GV engineering. For that reason, we
investigated the discrepancies in reported GV diameters using
modern microscopy tools. Using these updated techniques,
we provide measurements for the most commonly studied
GVs: Ana, Mega, and Halo. For Halo, we analyzed two
different GV types, which are products of the independent
gene clusters p-vac and c-vac.

RESULTS AND DISCUSSION
To more closely evaluate the behavior of stained and air-dried
GVs on the EM grid, we collected projection images for
different types of GVs at 0° and 50° tilt and analyzed their
morphology (Figure 1a and 1b). Although we predicted
some degree of distortions to the cylindrical shape of GVs,
the observed differences were unexpectedly large. For Ana
GVs, there was an average of 55 nm width difference between
measurements at these two angles. The pattern was similar for
both Mega and Halo GVs, although to a different degree. This
data indicates that all types of GVs flatten during the staining
procedure, adopting an elliptic cylinder shape.
    Certain limitations of the ns-EM technology, such as spec-
imen flattening or stain thickness irreproducibility, were pre-
viously described (Frank 2006). However, the observed de-
formation of the GV protein shell is not like the typical flat-
tening reported before, where sample was mainly affected
in z-direction with little to no effect on the x.y-dimensions              Figure 1. GVs flattening on the EM grid. (a) Schematic
(Frank 2006). Since GVs produce strong contrast on EM                      showing cross-section of the flattened GV at 0° and 50° tilt.
even without staining, we decided to take advantage of this                (a,b) Representative projection images at 0° and 50° tilt for
unique property and evaluate the effect of the stain. Analysis             (b) negatively stained and air-dried Ana, Mega, and Halo GV;
of unstained, air-dried Ana GVs samples at 0° and 50° tilts                and (c) unstained, air-dried Ana GV. Scale bar, 200 nm.
show on average 20 nm difference in diameter (Figure 1c),

                                                                                                                                              2/6
bioRxiv preprint doi: https://doi.org/10.1101/2021.01.22.427725; this version posted January 22, 2021. The copyright holder for this preprint
(which was not certified by peer review) is the author/funder, who has granted bioRxiv a license to display the preprint in perpetuity. It is made
available under aCC-BY-NC-ND 4.0 International license.
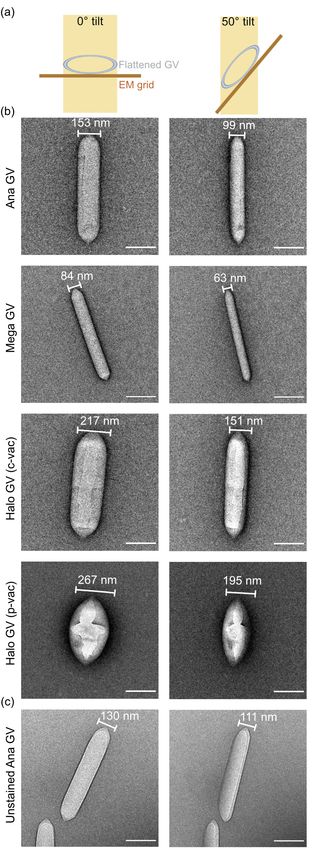
Figure 2. Diameter measurement for Mega, Ana, and Halo GVs. (a) Representative cryo-EM of intact GVs used for
direct diameter measurement. (b) Representative ns-EM images of collapsed GVs used for indirect diameter assessment based
on widths of flat collapsed regions. Scale bar, 100 nm. (c) Diameter distribution for Mega, Ana, and Halo GVs measured by
cryo-EM and collapsed ns-EM. Center line indicates median, the box limits denote the interquartile range and the whiskers
absolute range. Each dot represents an individual measurement.
which is significantly less than the stained sample, but not GVs with cryo-EM, which preserves GVs’ cylindrical shape.
negligible. Unfortunately, cryo-EM is a more demanding technique, re-
Distortions to the GV shape are the effect of the unique quiring time-consuming sample optimization, larger sample
mechanical properties of GVs’ protein shell. In ns-EM, the quantities, and access to a more sophisticated instrument. Al-
sample lies on a carbon support; thus, we suspect that GVs are ternatively, we inferred GV diameter from the widths of flat
compressed by the surface tension of evaporating water. No- collapsed GVs with negative staining, as measured by Walsby
tably, the degree of deformation appears to be correlated with and Bleything (Walsby and Bleything 1988). This method,
critical collapse pressure. Halo GVs, which experience the which equates the collapsed GV width with half of the intact
most flattening, are also the least robust among investigated cylindrical circumference, should allow for a faster and more
GVs, with collapse pressure of 0.1 MPa (Lakshmanan et al. accessible estimation of GV dimensions. We decided to ana-
2017). In contrast, Mega GVs, which have a much higher col- lyze diameter distribution for Mega, Ana, and Halo GVs using
lapse pressure of 0.7 MPa (Lakshmanan et al. 2017), flatten both strategies. Cryo-EM of intact GVs and collapsed ns-GV
the least. imaging resulted in similar values for each analyzed GV type
(Figure 2, Table 1), with differences within statistical error.
To obtain more accurate measurements of GV diameter,
Mega and Ana GVs appear to have a uniform diameter, vary-
we used two complementary methods. First, we imaged the
3/6bioRxiv preprint doi: https://doi.org/10.1101/2021.01.22.427725; this version posted January 22, 2021. The copyright holder for this preprint
(which was not certified by peer review) is the author/funder, who has granted bioRxiv a license to display the preprint in perpetuity. It is made
available under aCC-BY-NC-ND 4.0 International license.
Table 1. Measured diameters (mean ± s.d.) for Mega, Ana, When data for collapsed GVs were collected, diluted sam-
and Halo GVs by EM ples were squeezed in a sealed syringe until turned transpar-
ent. 3 µL of the target sample was applied to a freshly glow-
GV type Intact GVs Intact GVs Collapsed GVs
(ns-EM)* (nm) (cryo-EM) (ns-EM) (nm)
discharged (Pelco EasiGlow, 15mA, 1 min) Formvar/carbon-
(nm) coated, 200 mesh copper grid (Ted Pella) for 1 min before
Mega 73 ± 14 52 ± 6 54 ± 5 blotting. Afterward, the sample was incubated for 1 min with
Ana 136 ± 21 85 ± 4 89 ± 6 a 0.75% uranyl formate solution before blotting and air-dried.
Halo (c-vac) 111 ± 32 116 ± 21
Halo (p-vac)
251 ± 51
182 ± 22 171 ± 19
Image acquisition was performed using a Tecnai T12 (FEI,
now Thermo Fisher Scientific) electron microscope at 120 kV,
*Previously reported by Lakshmanan et al. (2017).
equipped with a Gatan Ultrascan 2k X 2k CCD.
ing within a narrow range (Figure 2c, Table 1). In contrast,
Halo GV diameters varied. Halo is capable of producing two Cryo-electron microscopy
types of GVs. Spindle-shaped GVs are encoded by the p-vac For cryo-EM, Quantifoil R2/2 200 Mesh, extra thick car-
gene cluster located on an endogenous plasmid, while the bon, copper grids (EMS) were glow discharged (Pelco Eas-
c-vac cluster located on a mini-chromosome generates cylin- iGlow, 10mA, 1 min). Freshly purified Mega (OD500 ~1), Ana
drical GVs (Pfeifer 2012). According to our measurements, (OD500 ~15), and Halo (OD500 ~8) GVs sample was frozen
the diameter of both types of Halo GVs varies (Figure 2c). using a Mark IV Vitrobot (FEI, now Thermo Fisher Scientific)
However, some of this variability may be due to imperfect (4°C, 100% humidity, blot force 3, blot time 4s). Micrographs
classification. All GV types begin their assembly as bicones, were collected on a 300kV Titan Krios microscope (FEI, now
which look like smaller spindle-shape p-vac Halo GVs (Pfeifer Thermo Fisher Scientific) with an energy filter (Gatan) and
2012). Thus, some c-vac GVs, in their bicone phase, could equipped with a K3 6k x 4k direct electron detector (Gatan).
have been classified as p-vac GVs. This misclassification Data were collected using SerialEM software with a pixel size
could have made a minor contribution to the overall diameter of either 1.4 Å (x64,000 magnification) or 2.15Å (x42,000
distribution. Overall, the range of diameter values for differ- magnification) and -2.5 µm defocus (Mastronarde 2005).
ent GV types suggest that Ana and Mega GVs have tighter
regulation over diameter compared to Halo GVs. However, Diameter measurement
it is not yet known what the physiological consequences of All measurements were made using IMOD software (Kremer,
this regulation are or how exactly the diameter is adjusted in Mastronarde, and McIntosh 1996). The cylinder/spindle di-
growing GVs. ameter direct measurements from cryo-EM micrographs were
Taken together, our findings provide an explanation for dis- performed only once for each GVs at its widest region. Indi-
crepancies in previous GV diameter measurements reported rectly diameter was calculated as 2w/π, where w is the width
in the literature. Although ns-EM is routinely used to evaluate of the flat collapsed gas vesicle measured from the ns-EM mi-
the morphology and dimensions of intact GVs (Li and Cannon crograph. Sample from at least two independent preparations
1998; Ramsay et al. 2011; Xu et al. 2014; Lakshmanan et al. were used for each measurement.
2017; Farhadi et al. 2018), our data show that this method
causes GV flattening and inaccurate apparent diameter. In-
stead, cryo-EM of intact GVs and ns-EM of flat collapsed ACKNOWLEDGEMENTS
GVs provide correct dimensions that are mutually consistent This work was supported by the National Institutes of Health
between the two methods, as shown here for three commonly (grant R35-GM122588 to G.J.J. and R01-EB018975 to M.G.S.)
studied GVs variants. and the Caltech Center for Environmental Microbial Interac-
tions (CEMI). Electron microscopy was performed in the
MATERIALS AND METHODS Beckman Institute Resource Center for Transmission Electron
Microscopy at Caltech. Related research in the Shapiro Lab-
GV expression and purification oratory is also supported by the Heritage Medical Research
GVs were either isolated from native sources (Ana and Halo) Institute, the Pew Scholarship in the Biomedical Sciences, and
or expressed heterologously in Rosetta 2(DE3) pLysS E.coli the Packard Fellowship for Science and Engineering.
cells (Mega) as previously described (Lakshmanan et al. 2017).
In the final two or three rounds of buoyancy purification, sam-
ple buffer was exchanged to 10 mM HEPES, pH 7.5. Con-
AUTHOR CONTRIBUTIONS
centrations were measured by optical density (OD) at 500 Przemysław Dutka: Conceptualization; methodology; in-
nm using a spectrophotometer (NanoDrop ND-1000, Thermo vestigation; formal analysis; visualization; writing – origi-
Scientific). nal draft preparation; writing – review editing. Dina Mal-
ounda: Investigation. Lauren Ann Metskas: Investigation.
Negative stain electron microscopy Songye Chen: Investigation. Robert C. Hurt: Investigation.
For imaging of intact GVs, the purified sample was diluted George J. Lu: Investigation. Grant J. Jensen: Concep-
to OD500 ~0.5 for Ana and Halo, and OD500 ~0.2 for Mega. tualization; writing – review editing; supervision; funding
4/6bioRxiv preprint doi: https://doi.org/10.1101/2021.01.22.427725; this version posted January 22, 2021. The copyright holder for this preprint
(which was not certified by peer review) is the author/funder, who has granted bioRxiv a license to display the preprint in perpetuity. It is made
available under aCC-BY-NC-ND 4.0 International license.
acquisition. Mikhail G. Shapiro: Conceptualization; writing Kremer, J. R., Mastronarde, D. N., McIntosh, J. R. (1996).
– review editing; supervision; funding acquisition. Computer visualization of three-dimensional image data using
IMOD. Journal of Structural Biology, 116(1), 71–76.
COMPETING INTERESTS Lakshmanan, A., Jin, Z., Nety, S. P., Sawyer, D. P., Lee-
The authors declare no competing interests. Gosselin, A., Malounda, D., Swift, M. B., Maresca, D., Shapiro,
M. G. (2020). Acoustic biosensors for ultrasound imaging of
enzyme activity. Nature Chemical Biology. 16, 988-996
REFERENCES
Lakshmanan, A., Lu, G. J., Farhadi, A., Nety, S. P., Kunth,
Archer, D. B., King, N. R. (1984). Isolation of gas vesi- M., Lee-Gosselin, A., Maresca, D., Bourdeau, R. W., Yin, M.,
cles from Methanosarcina barken. Microbiology, 130(1), Yan, J., Witte, C., Malounda, D., Foster, F. S., Schröder, L.,
167–172. Shapiro, M. G. (2017). Preparation of biogenic gas vesicle
Bar-Zion, A., Nourmahnad, A., Mittelstein, D. R., and Yoo, nanostructures for use as contrast agents for ultrasound and
S. (2019). Acoustically detonated biomolecules for geneti- MRI. Nature Protocols, 12(10), 2050–2080.
cally encodable inertial cavitation. bioRxiv. https://doi. Li, N., Cannon, M. C. (1998). Gas vesicle genes identified in
org/10.1101/620567 Bacillus megaterium and functional expression in Escherichia
Beard, S. J., Davis, P. A., Iglesias-Rodrıguez, D., Skulberg, O. coli. Journal of Bacteriology, 180(9), 2450–2458.
M.,d Walsby, A. E. (2000). Gas vesicle genes in Planktothrix Lu, G. J., Farhadi, A., Szablowski, J. O., Lee-Gosselin, A.,
spp. from Nordic lakes strains with weak gas vesicles possess Barnes, S. R., Lakshmanan, A., Bourdeau, R. W., Shapiro,
a longer variant of gvpC. Microbiology, 146(8), 2009–2018. M. G. (2018). Acoustically modulated magnetic resonance
Beard, S. J., Handley, B. A., Hayes, P. K., Walsby, A. E. imaging of gas-filled protein nanostructures. Nature Materials,
(1999). The diversity of gas vesicle genes in Planktothrix 17(5), 456–463.
rubescens from Lake Zürich. Microbiology, 145 ( Pt 10), Mastronarde, D. N. (2005). Automated electron microscope
2757–2768. tomography using robust prediction of specimen movements.
Bourdeau, R. W., Lee-Gosselin, A., Lakshmanan, A., Farhadi, Journal of Structural Biology, 152(1), 36–51.
A., Kumar, S. R., Nety, S. P., Shapiro, M. G. (2018). Acoustic Offner, S., Ziese, U., Wanner, G., Typke, D., Pfeifer, F.
reporter genes for noninvasive imaging of microorganisms in (1998). Structural characteristics of halobacterial gas vesicles.
mammalian hosts. Nature, 553(7686), 86–90. Microbiology, 144 ( Pt 5), 1331–1342.
Dunton, P. G., Walsby, A. E. (2005). The diameter and critical Pfeifer, F. (2012). Distribution, formation and regulation
collapse pressure of gas vesicles in Microcystis are correlated of gas vesicles. Nature Reviews. Microbiology, 10(10),
with GvpCs of different length. FEMS Microbiology Letters, 705–715.
247(1), 37–43.
Ramsay, J. P., Williamson, N. R., Spring, D. R., Salmond,
Farhadi, A., Bedrossian, M., Lee, J., Ho, G. H., Shapiro, M. G. P. C. (2011). A quorum-sensing molecule acts as a mor-
G., Nadeau, J. L. (2020). Genetically Encoded Phase Contrast phogen controlling gas vesicle organelle biogenesis and adap-
Agents for Digital Holographic Microscopy. Nano Letters, tive flotation in an enterobacterium. Proceedings of the Na-
20(11), 8127–8134. tional Academy of Sciences of the United States of America,
Farhadi, A., Ho, G. H., Sawyer, D. P., Bourdeau, R. W., 108(36), 14932–14937.
Shapiro, M. G. (2019). Ultrasound imaging of gene expres- Shapiro, M. G., Goodwill, P. W., Neogy, A., Yin, M., Fos-
sion in mammalian cells. Science, 365(6460), 1469–1475. ter, F. S., Schaffer, D. V., Conolly, S. M. (2014). Biogenic
gas nanostructures as ultrasonic molecular reporters. Nature
Farhadi, A., Ho, G., Kunth, M., Ling, B., Lakshmanan, A.,
Nanotechnology, 9(4), 311–316.
Lu, G., Bourdeau, R. W., Schröder, L., Shapiro, M. G. (2018).
Recombinantly Expressed Gas Vesicles as Nanoscale Con- Shapiro, M. G., Ramirez, R. M., Sperling, L. J., Sun, G., Sun,
trast Agents for Ultrasound and Hyperpolarized MRI. AIChE J., Pines, A., Schaffer, D. V., Bajaj, V. S. (2014). Geneti-
Journal. American Institute of Chemical Engineers, 64(8), cally encoded reporters for hyperpolarized xenon magnetic
2927–2933. resonance imaging. Nature Chemistry, 6(7), 629–634.
Frank, J. (2006). Three-Dimensional Electron Microscopy Simon, R. D. (1981). Morphology and protein composition of
of Macromolecular Assemblies: Visualization of Biological gas vesicles from wild type and gas vacuole defective strains
Molecules in Their Native State. Oxford University Press. of Halobacterium salinarium strain 5. Microbiology, 125(1),
103–111.
Hayes, P. K., Walsby, A. E. (1986). The inverse correlation
between width and strength of gas vesicles in cyanobacteria. Walsby, A. E. (1994). Gas vesicles. Microbiological Reviews,
British Phycological Journal, 21(2), 191–197. 58(1), 94–144.
5/6bioRxiv preprint doi: https://doi.org/10.1101/2021.01.22.427725; this version posted January 22, 2021. The copyright holder for this preprint
(which was not certified by peer review) is the author/funder, who has granted bioRxiv a license to display the preprint in perpetuity. It is made
available under aCC-BY-NC-ND 4.0 International license.
Walsby, A. E., Bleything, A. (1988). The Dimensions of
Cyanobacterial Gas Vesicles in Relation to Their Efficiency
in Providing Buoyancy and Withstanding Pressure. Microbi-
ology, 134(10), 2635–2645.
Walsby, A. E., (1971). The pressure relationships of gas
vacuoles. Proceedings of the Royal Society of London. Series
B. Biological Sciences, 178(1052), 301–326.
Wu, D., Baresch, D., Cook, C., Malounda, D., Maresca, D.,
Abundo, M. P., Mittelstein, D. R., Shapiro, M. G. (2019).
Genetically encoded nanostructures enable acoustic manipu-
lation of engineered cells. bioRxiv. https://doi.org/
10.1101/691105
Xu, B. Y., Dai, Y. N., Zhou, K., Liu, Y. T., Sun, Q., Ren,
Y. M., Chen, Y., Zhou, C. Z. (2014). Structure of the gas
vesicle protein GvpF from the cyanobacterium Microcystis
aeruginosa. Acta Crystallographica. Section D, Biological
Crystallography, 70(Pt 11), 3013–3022.
6/6You can also read