Memory Profiling using Visual VM - CaptainCasa
←
→
Page content transcription
If your browser does not render page correctly, please read the page content below
Memory Profiling using Visual VM

                                  What type of profiling is most important?
                                  Clear answer: memory profiling!

                                  The speed of your application typically is something that you “feel” throughout your
                                  whole development process. You get to know, when your application runs slow by daily
                                  testing it during development. So, the CPU performance of your application should not be
                                  something to get too much surprised, when changing from test environment to production
                                  environment.
                                  With memory, things are different: you do not “feel” the memory footprint of your
                                  application during development:
                                  • You do not get to know memory leaks because you typically restart your system too
                                    often.
                                  • You have so much memory locally available that you typically do not run into memory
                                    problems – while testing the system in a single-user-way.
                                  Consequence: memory profiling is a MUST during development. Switching on a productive
                                  system without having checked the memory behavior of the application before is not a
                                  too good idea.

                                Challenges

                                  What is the typical memory footprint per user?
                                  At a certain point of time your system administrator will ask you: how much memory
                                  should I reserve for your application? The response is quite simple:
                                  • You need to tell, what the fix memory size is that is used by your system
                                  • You need to tell, what the typical memory size per user is
                                  Typically, it does not make sense to do some in-depth-profiling (e.g. on object instance
CaptainCasa Enterprise Client

                                  basis) to gain these responses. It's better to start some simple heuristic approach by
                                  observing the Java heap space.
                                  Measuring is something very simple: you can access the information also through the
                                  “System”-class in Java or you can use a tool like Visual VM. The only thing you have to
                                  make sure is to start the garbage collector before measuring in order to get reproducible
                                  and reliable results.

                                  Are there memory leaks?
                                  This is something which is more challenging. Making sure that your application does not
                                  have memory leaks.
                                  There is no other way than in-depth-profiling to find this out. The memory heap space is
                                  not accurate enough to find out if your application leaks or not. Of course you may gain
                                  some feeling, but nothing more.
                                  So, here you need explicit tooling – luckily there is a free tool “Visual VM” that is made
                                  available by Oracle that helps you a lot.

                                                                              1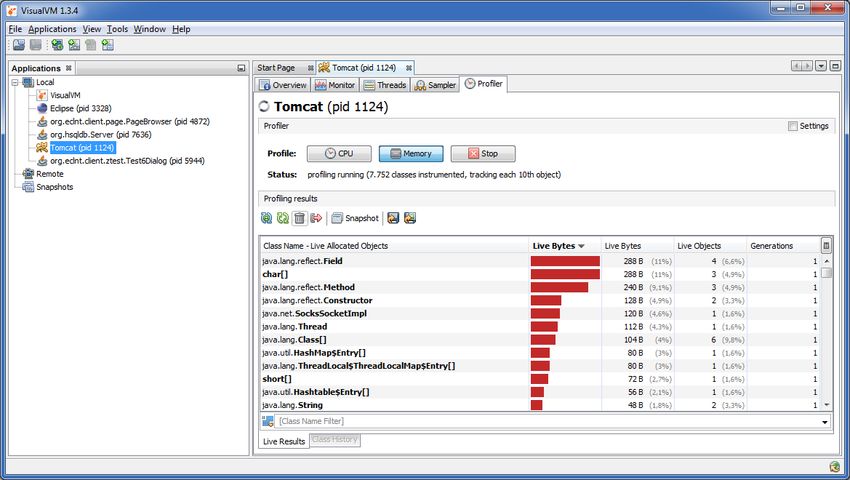
Once again: when your application's memory leaks, then the only way to find details is by
  measuring – not by thinking!!! The tool will tell you the truth about what happens inside
  your application.

Setting up the Visual VM environment
  You can download Visual VM from http://visualvm.java.net/.
  After starting Visual VM you see a tree on the left showing the avaiable Java processes on
  the right:

  When having started the server part of CaptainCasa Enterprise Client it should be visible
  as “Tomcat” in the left tree.
  We experienced sometimes problems, the result being that the list of Java processed did
  not show “our” Tomcat. If so, check the following:
  • Start the server from a “real” Java-JDK, not from a Java-JRE. By default CaptainCasa
    only comes with a Java-JRE...                                                              CaptainCasa Enterprise Client

  • Start the Visual VM as administrator (right mouse click on visualvm.exe, select “run as
    administrator”.

Observing the heap space
  Double click on the Tomcat instance withing the tree on the left, then on the right select
  the “Monitor”-tab.

                                            2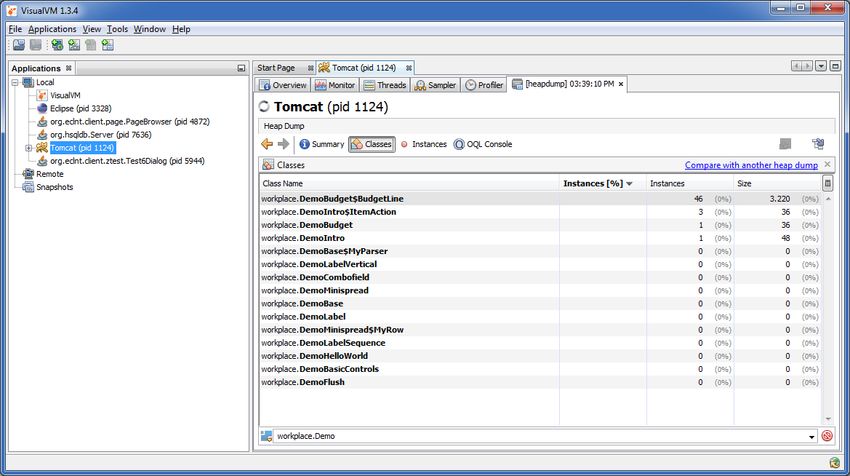
You can see the allocated memory of the Java VM – both the currently used one and the
                                  current maximum. Only the bottom blue line is the one to be interested in – the height of
                                  the orange one is defined by the “-Xmx...m -Xms...m” options that you pass to the Java
                                  process when starting “java.exe”.
                                  Now start a CaptainCasa client to work against your Tomcat and begin to user your
                                  application. ...and: do not panic...:
CaptainCasa Enterprise Client

                                  By just doing some simple things the memory will dramatically increase (e.g. the used
                                  heap space gains 25 MBytes). - This is just normal when working with Java...!
                                  You have to click “Perform GC” (garbace collector) within the tool in order to obtain
                                  comparable results.

                                Finding memory leaks

                                  Starting the profiler
                                  For finding memory leaks you have to do some in-depth-profiling. In Visual VM there is a
                                  corresponding “Profiler”-tab:
                                  The typical first thing to do – before starting the profiling session - is to open the settings

                                                                              3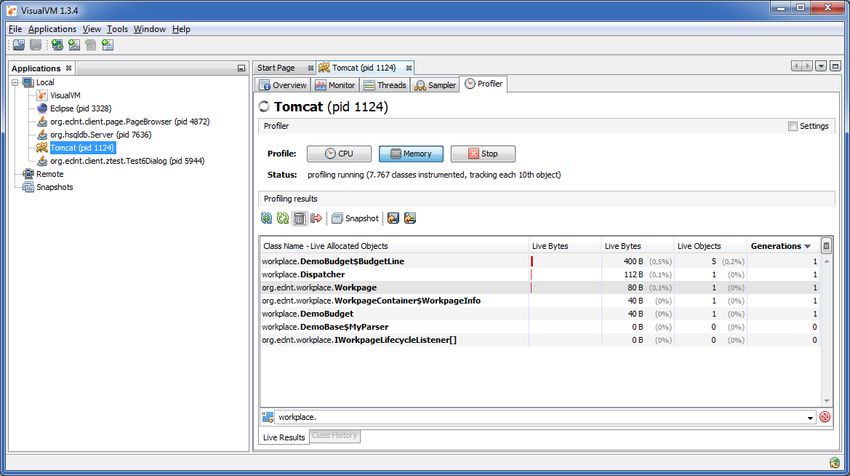
area and take a look at the “Memory Settings”:

By default the counting of object instance if done for every 10 th object allocation – in
order to save runtime performance. - But: we want to explicitly measure memory on
single instance level, so we recommend to count every instance. Set the corresponding
number to “1”:

Now click the “Memory” button and – wait! ...wait! ...wait!

                                                                                            CaptainCasa Enterprise Client

You may observe the Tomcat's DOS box to see that something is going on:

                                          4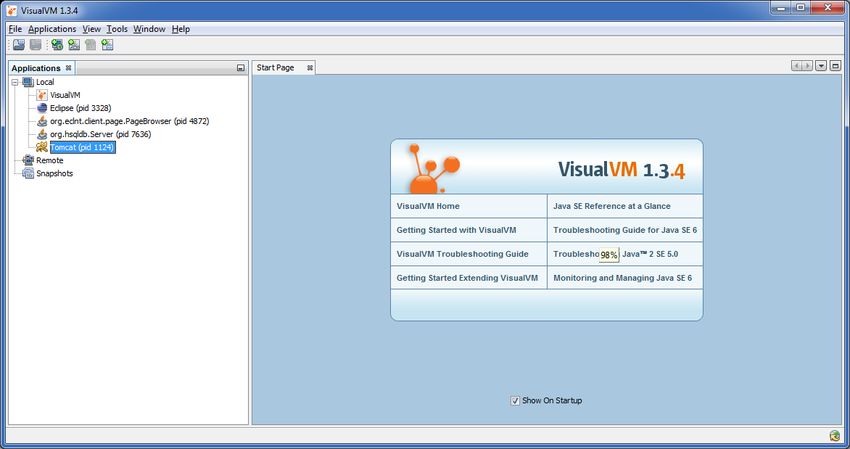
Visual VM is instrumenting the classes that are loaded within the Java process. This means
                                the byte code of the classes that is loaded is updated – and corresponding hooks are
                                inserted into the code that take over the counting of object instances.
                                We are not sure, if this is correct, ...but: we made the experience that you should not
                                touch Visual VM during the instrumentation phase. Otherwise we sometimes waited ages
                                for a feed back and sometimes had to shut down Visual VM.
                                After pressing the garbage collector icon you should see a list of the currently loaded
                                objects:
CaptainCasa Enterprise Client

                                                                          5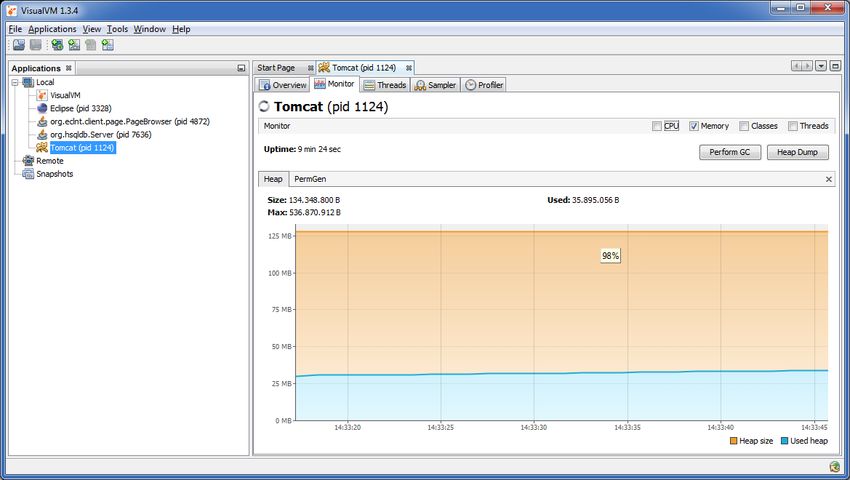
Tpyically we switch off the auto-refresh (icon on the very left), because observing the
instances regularly without collecting garbage does not make too much sense.

Typical procedure
The absolute number of object instances that is shown in the list is typically not too much
relevant. You want to find deltas (leaks!).
In order to find the deltas you first have to think about some application procedure which
you start, process and close – and where you expect that after running the procedure all
of your allocated objects are released.
This may be a whole session (e.g. start client, do something, close client) or may be some
activity within your running application (e.g. from workplace: start workpage, process
workpage, close workpage).
The way of measuring is:
• (Switch off the automatic refreshing.)
                                                                                                 CaptainCasa Enterprise Client
• In Visual VM start the garbage collector, by pressing the corresponding icon.
• In Visual VM reset the results by pressing the “Reset collected results” icon. Now all
  delta counters are reset.
• Perform your application procedure one or several times.
• In Visual VM press start the garbage collector again.
You now will see a list of objects that are currently loaded. You can filter the list by class
name:

                                            6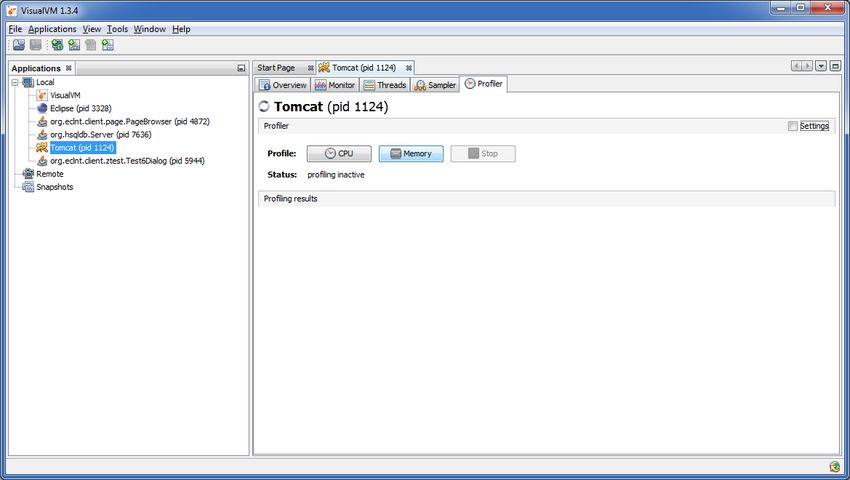
In the columns on the right you see the number of instances that do exist, and you see
                                the delta from the point of time on when you last time hit the “Reset results” icon.
                                Now you can see which objects are not cleaned up correctly. But: you only see the
                                number of objects – you do not see where the objects are referenced (and as
                                consequence are NOT garbage collected).

                                Using the heap dump for single instance analysis
                                This is the time now for starting the heap dump tool:
                                The heap dump is collected by pressing the right mouse button on the Tomcat Java
                                process:
CaptainCasa Enterprise Client

                                In the heap dump view switch to the “Classes”-view and filter the class that you are
                                interested in:

                                                                          7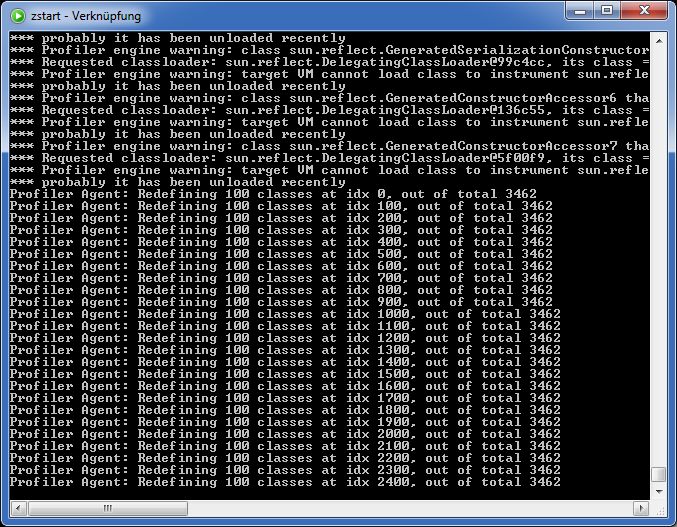
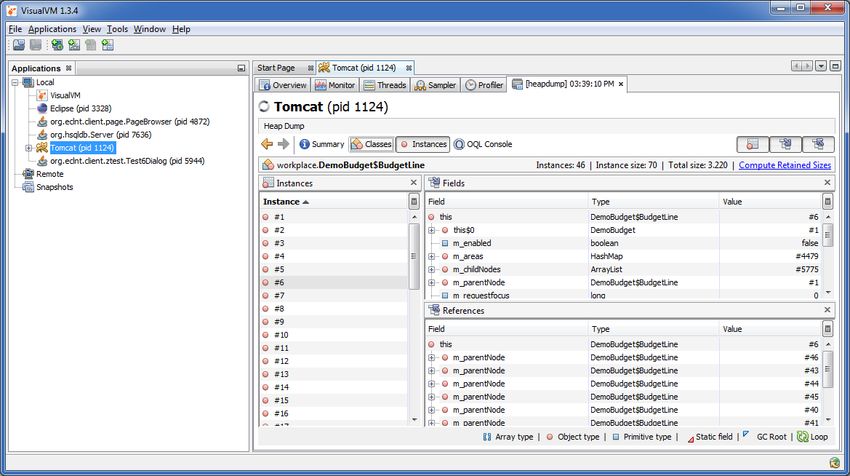
Select one class with the right mouse button and view the instances:

                                                                                            CaptainCasa Enterprise Client

You now can check each instance – and e.g. the objects that are referencing the instance.

Visual VM Summary
When it comes to memory profiling Visual VM provides functions:
• You can observe the heap size (=> Monitoring)
• You can count object instances and can simply observer changes (=> Profiling)
• You can drill down to the level of single instances (=> Dump)

                                          8
You can also read