Mesoscale convective systems as a source of electromagnetic signals registered by ground-based system and DEMETER Detection of Electro-Magnetic ...
←
→
Page content transcription
If your browser does not render page correctly, please read the page content below
Ann. Geophys., 39, 321–326, 2021
https://doi.org/10.5194/angeo-39-321-2021
© Author(s) 2021. This work is distributed under
the Creative Commons Attribution 4.0 License.

Mesoscale convective systems as a source of electromagnetic signals
registered by ground-based system and DEMETER (Detection
of Electro-Magnetic Emissions Transmitted from
Earthquake Regions) satellite
Karol Martynski1 , Jan Blecki2 , Roman Wronowski2 , Andrzej Kulak1 , Janusz Mlynarczyk1 , and Rafal Iwanski3
1 Department  of Electronics, AGH University of Science and Technology, Kraków, Poland
2 Space  Research Centre, Polish Academy of Sciences, Warsaw, Poland
3 Satellite Remote Sensing Department, Institute of Meteorology and Water Management –

National Research Institute, Kraków, Poland

Correspondence: Karol Martynski (karol.martynski@agh.edu.pl)

Received: 15 September 2020 – Discussion started: 21 November 2020
Accepted: 12 February 2021 – Published: 26 March 2021

Abstract. Mesoscale convective systems (MCSs) are espe-          1   Introduction
cially visible in the summertime when there is an advection
of warm maritime air from the west. Advection of air masses      Mesoscale convective systems (MCSs) are enormous cloud
is enriched by water vapour, the source of which can be found    structures known as one of the strongest discharge generators
over the Mediterranean Sea. In propitious atmospheric con-       in the world (Bonner, 1968; Banta et al., 2002; Houze, 2014).
ditions, and thus significant convection, atmospheric insta-     In the past, many have focused on the topic of MCSs activ-
bility or strong vertical thermal gradient leads to the devel-   ity (e.g. Price, 2002; Cummer, 2004). In our previous work
opment of strong thunderstorm systems. In this paper, we dis-    (Martynski et al., 2018), we analysed a supercell that oc-
cuss one case of MCSs, which generated a significant amount      curred over Poland. In this paper, our main goal is to combine
of +CG (cloud-to-ground), −CG and intracloud (IC) dis-           measurements from two autonomous systems, namely the
charges. We have focused on the ELF (extremely low fre-          ELF (extremely low frequency) Hylaty station and DEME-
quency; < 1 kHz) electromagnetic field measurements, since       TER (Detection of Electro-Magnetic Emissions Transmitted
they allow us to compute the charge moments of atmospheric       from Earthquake Regions) satellite that measures ELF and
discharges. Identification of the MCSs is a complex process,     VLF (very low frequency) fields. Additionally, we used PE-
due to many variables which have to be taken into account.       RUN (Polish system of the discharge localisation system) to
For our research, we took into consideration a few tools, such   track the storm cells and to scrutinise individual lightning
as cloud reflectivity, atmospheric soundings and data pro-       discharges.
vided by PERUN (Polish system of the discharge localisa-            To conduct the analysis, we have designated one event of
tion system), which operates in a very high frequency (VHF)      the MCS which occurred on 23 July 2009. The selection of
range (113.5–114.5 MHz). Combining the above-described           this specific MCS was not random; we have been looking
measurement systems and tools, we identified a MCS which         for the most favourable conditions to conduct the research
occurred in Poland on 23 July 2009. Furthermore, it fulfilled    and, hence, significant convection, atmospheric instability or
our requirements since the thunderstorm crossed the path of      strong vertical thermal gradient. Since we focused on Poland,
the DEMETER (Detection of Electro-Magnetic Emissions             we had access to data provided by the Polish meteorologi-
Transmitted from Earthquake Regions) overpass.                   cal service, IMGW–PIB (Institute of Meteorology and Water
                                                                 Management – National Research Institute). The most cru-
                                                                 cial part in the search for MCSs was to scrutinise DEME-

Published by Copernicus Publications on behalf of the European Geosciences Union.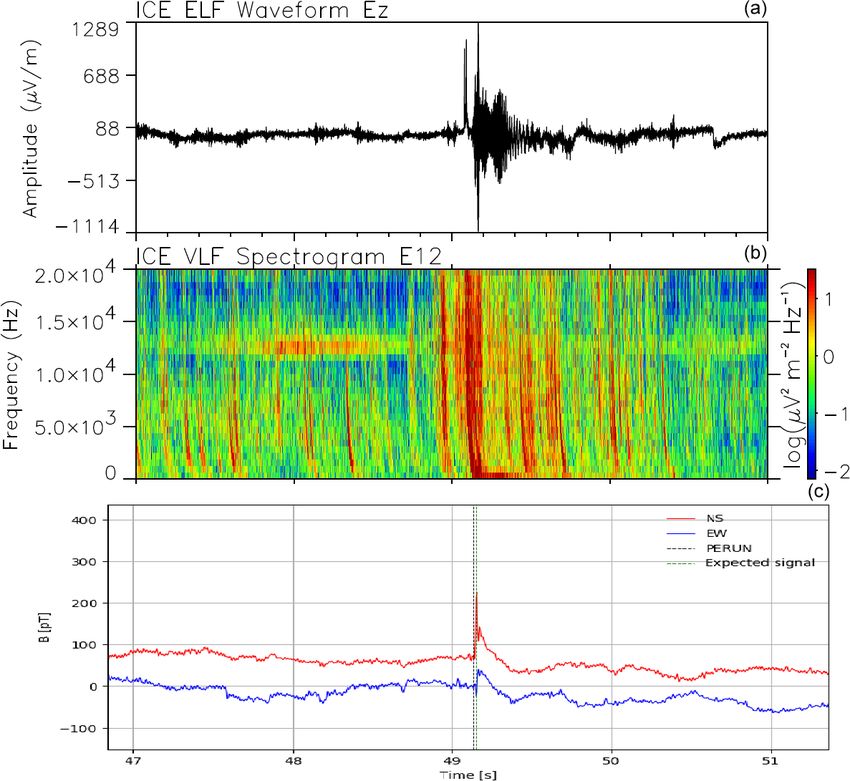
322 K. Martynski et al.: Mesoscale convective systems as a source of electromagnetic signals
TER overpasses in order to distinguish periods in which it
was over Poland.
2 Detection of electromagnetic signals generated by
atmospheric discharges
Ground-based measurements were conducted by the Hylaty
ELF (extremely low frequency) station (Kulak et al., 2014)
localised in the Bieszczady Mountains in Poland. The sta-
tion measures the electromagnetic field in the ELF range. We
used a receiver that operates in 0.03–55 Hz frequency range
and uses two orthogonal magnetic antennas, one aligned
north–south and the second aligned east–west. Based on
these measurements, inverted solutions developed within our
team were used, which support computation of the charge
moments of cloud-to-ground (CG) discharges (Kulak et al.,
2010). This method requires two parameters, where one is
the distance between the discharge and the receiver and the
second is the amplitude of the recorded impulse. The MCS
was located approximately 350 to 450 km from the station
and was facing northeast.
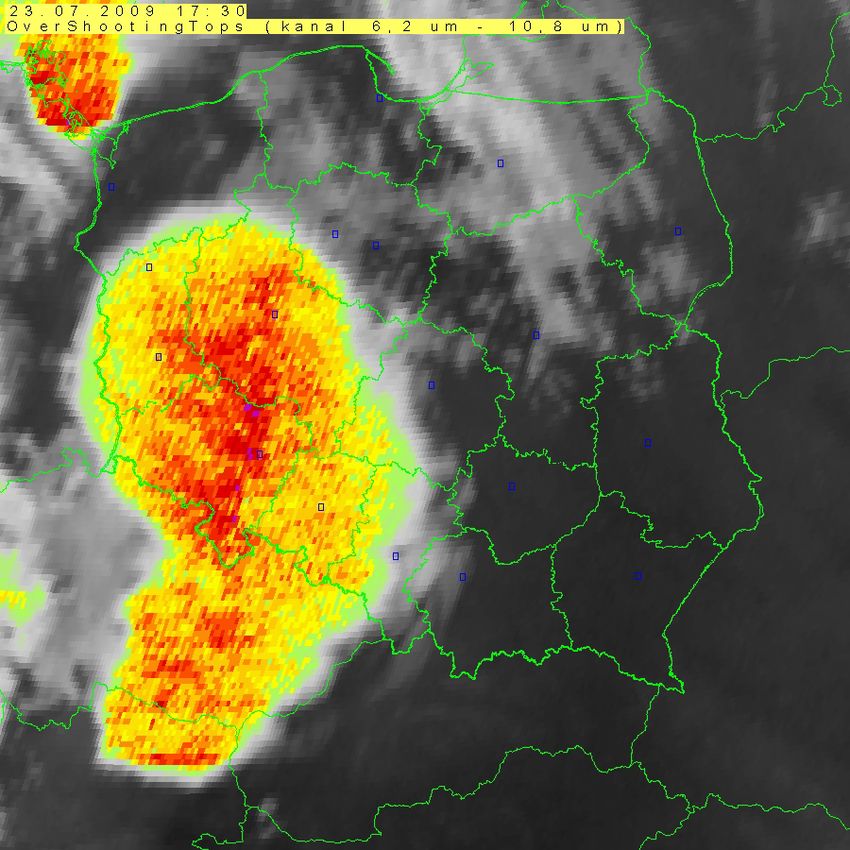
DEMETER operated until December 2010 and had a Sun- Figure 1. Satellite WV–IR (water vapour–infrared) OSTs (over-
shooting tops) product at 17:30 UTC on 23 July 2009.
synchronous orbit. The ELF/VLF range for the electric and
magnetic fields is from the Cartesian components of the static
(DC) up to 20 kHz. There are two scientific modes. The first
crepancies in tropospheric layers, a jet stream occurred in
is a survey mode, with the spectra of one electric and one
the middle troposphere (700 hPa), with the airflow around
magnetic component used in the on-board computing up to
15–25 m per second. Thus, conditions were favourable for
20 kHz. The time resolution for the spectra in this case is
wind shear to occur, which is vital for thunderstorm develop-
about 2 s and frequency resolution about 19 Hz. The second
ment. Over southern Sweden, a local low that caused flow of
one is a burst mode, where, in addition to the on-board com-
the cold front from the western Europe is noticeable. Around
puted spectra, waveforms of three electric and three magnetic
19:00 UTC (universal coordinated time) over Lower Silesia
field components are recorded with sampling up to 2.5 kHz.
(Polish voivodeship or administrative division), a derecho
During the burst mode, the waveforms of the six components
had occurred, which is well known for strong wind gusts
of electromagnetic field were registered with 2550 Hz sam-
often exceeding 40 m per second. The thunderstorm’s path
pling rate. It allows us to perform a spectral analysis in the
covered an area of 1000 km in length, and the width varied
range up to 1250 Hz with a much higher time and frequency
between 50 and 200 km. Lastly, high thermodynamic insta-
resolution (0.4 ms and 0.8 mHz; Parrot et al., 2006; Berthe-
bility lead to the updraughts. The discussed example of MCS
lier et al., 2006). Since the burst mode is used occasionally,
is qualified as derecho, due to the propitious synoptic con-
we had to distinguish periods where the measurements corre-
ditions and the destruction it caused (Evans and Doswell,
sponded with thunderstorms. As mentioned above, the satel-
2001).
lite allows us to measure signals in VLF and ELF ranges,
Vertical wind shears support the separation of the up-
which aids in the search of these relations (Parrot et al., 2008,
draughts from downdraughts; moreover, they support pro-
2013; Blecki et al., 2016) and, thus, differences and varia-
cesses that are responsible for development of the multicel-
tions in the ionosphere and magnetosphere caused by thun-
lular thunderstorms. The discussed airflow in the middle tro-
derstorm activity (Berthelier et al., 2006).
posphere allowed the whole system to move with relatively
high velocity. The convergence in the lower troposphere let
3 Results the bow echo form, which manifested as a squall line. Last,
but not least, another significant condition for MCS develop-
From the southwest, Poland was covered by a warm tropical ment is the advection of the cold air mass from the western
air masses. Their advection over colder polar maritime air regions of Europe. Thermodynamic conditions, which ap-
caused the occurrence of a significant thermal contrast be- peared over southwestern Poland, additionally confirm the
tween western and eastern Europe. For instance, the temper- development of the strong convective phenomena. The data
ature difference in Benelux and eastern Germany and Poland from atmospheric soundings show a high temperature level
was larger than 15 ◦ C. Furthermore, due to temperature dis- at the ground layer (over 30 ◦ C), with the dew tempera-
Ann. Geophys., 39, 321–326, 2021 https://doi.org/10.5194/angeo-39-321-2021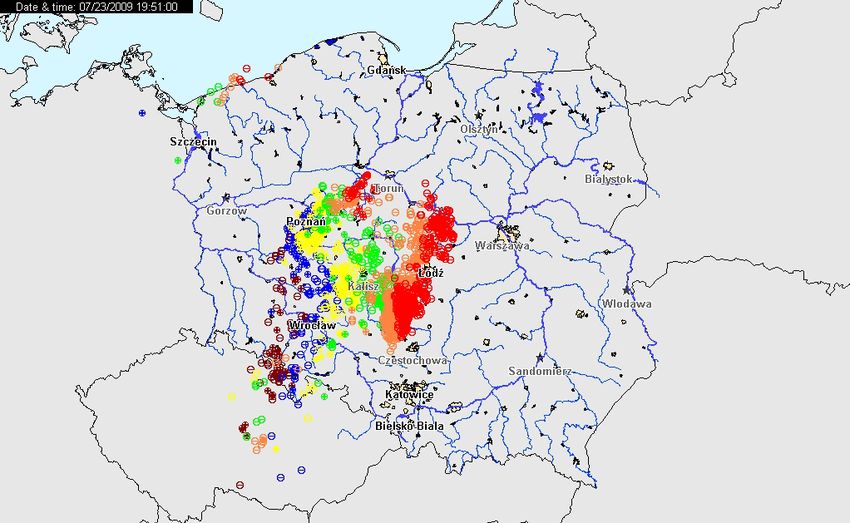
K. Martynski et al.: Mesoscale convective systems as a source of electromagnetic signals                                       323

Figure 2. Map of the atmospheric discharges for the most active period (+CG, −CG and IC), based on PERUN system, on 23 July 2009.

ture at 22 ◦ C. A strong airflow from the west is visible in        Table 1. Number of +CG, −CG and IC strokes during the MCS
the whole troposphere. Thermodynamic indicators, such as            activity on 23 July 2009. Data received from the PERUN system.
CAPE (convective available potential energy), with 2500 J           Note: all times are given in UTC.
per kilogram, or CIN (convective inhibition), with −100 J per
kilogram, indicate strong convective processes. A significant               Time    16:20   17:20    18:20   19:20    20:20
drying of air appears, and then a dry adiabatic gradient is no-             +CG         2       6        9       5        2
ticeable in the middle troposphere. A small inversion layer                 −CG         5      10       14     148       45
(CIN) favours the gathering of the energy beneath it. When                  IC        320     865      240     917      494
convection is strong enough, it is possible to break through
the inversion, which directly leads to the intensification of
the convection processes. Then the tropopause is penetrated         tive processes, which supplied cloud development at a level
by the convection, and an overshooting top may appear in the        higher than 15 km over the ground level.
lower parts of the stratosphere (Fig. 1). Apart from the dis-          Strong atmospheric discharges stem from significant MCS
cussed thermodynamic parameters, SBCAPE (surface-based              development. In the period of the highest thunderstorm activ-
convective available potential energy) is significant. The pa-      ity, 24 +CG (cloud-to-ground), 322 −CG and 2836 IC (in-
rameter indicates the convection in the surface layer; in this      tracloud) discharges were detected (Fig. 2). Additionally, we
case it exceeded 2500 J per kilogram. Furthermore, DCAPE            provide data for other periods where a significant amount of
(downward convective available potential energy) is avail-          discharges occurred (Table 1), which indicates an enormous
able, which is the potential of downdraughts at 1077 J per          extent of IC discharges. The intensification of the discharges
kilogram. The wind shear parameter, in 0–6 km, was higher           with highest wind gusts is visible in the front parts of MCSs.
than 20 m per second, whereas, in 0–3 km, the parameter was            During the analysis of the DEMETER data for the whole
equal to 13 m per second. A significant development of the          lifespan of the discussed MCSs, we have encountered a sig-
thunderstorm phenomenon is visible by the measurements of           nature of a whistler, a characteristic type of wave that oc-
the cloud reflectivity. In many parts of the MCSs, a level that     curs in VLF frequency range. The whistlers are cold plasma
exceeds 50 dBZ is distinguishable, indicating strong convec-        waves in the frequency range from the ion cyclotron up to the

https://doi.org/10.5194/angeo-39-321-2021                                                     Ann. Geophys., 39, 321–326, 2021
324                              K. Martynski et al.: Mesoscale convective systems as a source of electromagnetic signals

Figure 3. Comparison of DEMETER and Hylaty results. Panel (a) presents the waveform of the electric field in the ELF range,
panel (b) shows a spectrogram of the electric field in VLF range, both registered by DEMETER, and panel (c) presents the magnetic
field in the ELF range in time interval 20:05:47–20:05:51 UTC on 23 July 2009.

Figure 4. Histograms of charge moment distribution in the analysed MCSs for the whole activity period (a) and for the most inten-
sive hour (b).

Ann. Geophys., 39, 321–326, 2021                                                   https://doi.org/10.5194/angeo-39-321-2021
K. Martynski et al.: Mesoscale convective systems as a source of electromagnetic signals                                            325

electron plasma frequency or electron cyclotron frequency.         who stated that MCSs on high plains in the USA generated,
These waves are common in space around the Earth and may           in 1 h, roughly 312 +CG strokes, and the mean charge mo-
be registered in the ionosphere and the magnetosphere by           ment was equal to 36.8 C per kilometre. In this study, we
the satellite on-board receivers and by the ground-based sys-      also presented a whistler that was registered by DEMETER
tems. The characteristic shape of a whistler’s spectrum, with      during its overpass of the MCSs. This shows the potential of
falling frequency in time, is a result of its dispersion feature   combined ground-based and satellite studies.
and propagation. The group velocity is greater for waves with
higher frequencies than for lower ones. The whistlers propa-
gate along magnetic field lines from the site of the thunder-      Data availability. Data may be obtained from the main author of
storm. The arrival of the lower frequency waves is delayed         this paper upon request.
in relation to higher frequency (Helliwell, 1965; Hayakawa,
1995).
   Figure 3 presents a whistler that has been detected by          Author contributions. KM provided conceptualisation, data cura-
the DEMETER overpass, which was 287 km away from                   tion, formal analysis, investigation, project administration, software
                                                                   and writing of the paper. JB and RW were responsible for the fund-
the causative lightning stroke. Its precise location was
                                                                   ing acquisition, conceptualisation and investigation. JM and AK
provided by PERUN. During that time, an impulse was
                                                                   created the methodology and software and curated the data for this
caught by ground-based systems, which detected an impulse          paper. RI was responsible for the data visualisation, data curation
slightly ahead of the satellite; PERUN detected a signal at        and resources. All authors supervised the paper, since the topic is
20:05:49.13 and classified it as a +CG, with the maximum           broad and requires expertise in many fields.
current of 24 kA. Hylaty measurements distinguish an im-
pulse at 20:05:49.14, with an amplitude 220 pT and a charge
moment of 103 C per kilometre. The satellite registered a sig-     Competing interests. The authors declare that they have no conflict
nal at 20:05:49.23, with an electric field 1200 µV per metre;      of interest.
the magnetic field is omitted due to high noise. The whole pe-
riod of MCS activity has been presented in Fig. 4. Data pre-
sented in the figure represent a distribution of the charge mo-    Acknowledgements. The studies were conducted with fi-
ments, which were computed from data collected by the Hy-          nancial help of the Polish National Science Centre (grant
laty ELF station. As a result, only lightning with the charge      no. 2017/27/B/ST10/02285). We express our gratitude to
moment above 23 C per kilometre is included in our anal-           Michel Parrot, Jean-Andre Sauvaud, Jean-Jaques Berthelier
                                                                   and Jean-Pierre Lebreton and the principal investigators of the
ysis The highest charge moment during MCS lifespan was
                                                                   DEMETER instruments from which the data were used.
328.9 C per kilometre. The total amount of +CG discharges,
which occurred, was 1073. The average value of charge mo-
ment is 42.5 C per kilometre.
                                                                   Financial support. This research has been supported by the Polish
                                                                   National Science Centre (grant no. 2017/27/B/ST10/02285).

4   Summary
                                                                   Review statement. This paper was edited by Gunter Stober and re-
In this paper, we focused on a specific type of thunderstorm,      viewed by two anonymous referees.
an MCS classified as a derecho, which is not frequent in Eu-
rope and may be disastrous for overpassed areas. It is known
mostly for the intense wind gusts and small amount of dis-
charges. Comparing results from our previous paper about           References
supercell activity (Martynski et al., 2018), we can conclude
that the supercell in the most active hour generated an al-        Banta, R. M., Newsom, R. K., Lundquist, J. K., Pichugina, Y. L.,
most equal amount of discharge to the MCS case during its            Coulter, R. L., and Mahrt, L.: Nocturnal low-level jet character-
whole life cycle. That indicates that the supercell generated        istics over Kansas during Cases-99, Bound.-Lay. Meteorol., 105,
at least two times more discharge than MCSs, although the            2, 221–252, 2002.
strongest strokes are still produced by the huge cloud clus-       Berthelier, J. J., Godefroy, M., Leblanc, F., Malingre, M., Menvielle,
                                                                     M., Lagoutte, D., Brochot, J. Y., Colin, F., Elie, F., Legendre, C.,
ters. This means that MCSs are more developed storm cells,
                                                                     Zamora, P., Benoist, D., Chapuis,Y., Artru, J., and Pfaff, R.: ICE
although they are unable to generate multiple strong dis-
                                                                     – the electric field experiment on DEMETER, Planet. Space Sci.,
charges. This might be due to the fact that they cover larger        54, 456–471, 2006.
areas compared to supercells, which have a more organised          Blecki J., Parrot, M., Słomiński, J., Kościesza, M., Wronowski, R.,
and condensed structure, allowing heat and storm-like pro-           and Savin, S.: Evolution of the ionospheric Plasma Turbulence
cesses to develop as a stronger singular thunderstorm. Sim-          over Seismic and Thunderstorm Areas, Journal of Environmental
ilar results to ours have been obtained by Cummer (2004),            Science and Engineering, 6, 277–285, 2016.

https://doi.org/10.5194/angeo-39-321-2021                                                      Ann. Geophys., 39, 321–326, 2021
326 K. Martynski et al.: Mesoscale convective systems as a source of electromagnetic signals Bonner, W. D.: Climatology of the low level jet, Mon. Weather Rev., Martynski, K., Kulak, A., and Iwanski, R.: Comparison of Charge 96, 833–850, 1968. Moment Distribution in Supercell and Moderate Thunderstorm Cummer, S. A. and Lyons, W. A.: Lightning charge moment Based on ELF Electromagnetic Field Measurements, in: 22nd changes in US Plains thunderstorms, Geophys. Res. Lett., 31, International Microwave and Radar Conference MIKON/2018 L05114, https://doi.org/10.1029/2003GL019043, 2004. Baltic URSI Symposium, 15–17 May 2018, Poznań, Poland, Ewans, J. S. and Doswell, C. A.: Examination of derecho environ- 173–176, https://doi.org/10.23919/URSI.2018.8406712, 2018. ments using proximity soundings, Weather Forecast., 16, 329– Parrot, M., Benoist, D., Berthelier, J. J., Bł˛ecki, J., Chapuis, Y., 342, 2001. Colin, F., Elie, F., Fergeau, P., Lagoutte, D., Lefeuvre, F., Hayakawa, M.: Whistlers, in: Handbook of Atmospheric Electrody- Lévêque, M., Pinçon, J. L., Seran, H.-C., and Zamora, P.: namics, edited by: Volland, H., Vol. II, CRC Press, Boca Raton, The magnetic field experiment and its data processing onboard USA, 155–193, https://doi.org/10.1201/9780203713297, 1995. DEMETER: scientific objectives, description and first results, Helliwell, R. A.: Whistlers and Related Ionospheric Phenomena, Planet. Space Sci., 54, 441–455, 2006. Stanford University Press, 1965 stron VIII+349, 1965. Parrot, M., Berthelier, J. J., Lebreton, J. P., Treumann, R., Houze Jr., R. A.: Chapter 9 – Mesoscale Convective Systems, Cloud and Rauch, J. L.: DEMETER Observations of EM Emissions Dynamics, 104, 237–286, 2014. Related to Thunderstorms, Space Sci. Rev., 137, 511–519, Kulak, A., Nieckarz, Z., and Ziȩba, S.: Analytical de- https://doi.org/10.1007/s11214-008-9347-y, 2008. scription of ELF transients produced by cloud-to- Parrot, M., Sauvaud, J. A., Soula, S., Pinçon, J. L., and ground lightning discharges, JGR, 115, D19104, van der Velde, O.: Ionospheric density perturbations recorded by https://doi.org/10.1029/2009JD013033, 2010. DEMETER above intense thunderstorms, J. Geophys. Res., 118, Kulak, A., Kubisz, J., Klucjasz, S., Michalec, A., Mlynarczyk, J., 5169–5176, https://doi.org/10.1002/jgra.50460, 2013. Nieckarz, Z., Ostrowski, M., and Zieba, S.: Extremely low fre- Price, C., Asfur, M., Lyons, W., and Nelson, T.: An im- quency electromagnetic field measurements at the Hylaty station proved ELFVLF method for globally geolocating sprite- and methodology of signal analysis, Radio Sci., 49, 361–370, producing lightning, Geophys. Res. Lett., 29, 1031, https://doi.org/10.1002/2014RS005400, 2014. https://doi.org/10.1029/2001GL013519, 2002. Ann. Geophys., 39, 321–326, 2021 https://doi.org/10.5194/angeo-39-321-2021
You can also read