Metabolic consequences of perioperative oral carbohydrates in breast cancer patients - an explorative study
←
→
Page content transcription
If your browser does not render page correctly, please read the page content below
Lende et al. BMC Cancer      (2019) 19:1183
https://doi.org/10.1186/s12885-019-6393-7

 RESEARCH ARTICLE                                                                                                                                 Open Access

Metabolic consequences of perioperative
oral carbohydrates in breast cancer
patients — an explorative study
Tone Hoel Lende1,2*† , Marie Austdal3,4†, Tone Frost Bathen5, Anne Elin Varhaugvik4,6, Ivar Skaland4,
Einar Gudlaugsson4, Nina G. Egeland4,7, Siri Lunde1, Lars A. Akslen2, Kristin Jonsdottir3, Emiel A. M. Janssen4,7†,
Håvard Søiland1,8† and Jan P. A. Baak4,9†

  Abstract
  Background: The metabolic consequences of preoperative carbohydrate load in breast cancer patients are not
  known. The present explorative study investigated the systemic and tumor metabolic changes after preoperative
  per-oral carbohydrate load and their influence on tumor characteristics and survival.
  Methods: The study setting was on university hospital level with primary and secondary care functions in south-
  west Norway. Serum and tumor tissue were sampled from a population-based cohort of 60 patients with operable
  breast cancer who were randomized to either per-oral carbohydrate load (preOp™; n = 25) or standard pre-
  operative fasting (n = 35) before surgery. Magnetic resonance (MR) metabolomics was performed on serum samples
  from all patients and high-resolution magic angle spinning (HR-MAS) MR analysis on 13 tumor samples available
  from the fasting group and 16 tumor samples from the carbohydrate group.
  Results: Fourteen of 28 metabolites were differently expressed between fasting and carbohydrate groups. Partial
  least squares discriminant analysis showed a significant difference in the metabolic profile between the fasting and
  carbohydrate groups, compatible with the endocrine effects of insulin (i.e., increased serum-lactate and pyruvate
  and decreased ketone bodies and amino acids in the carbohydrate group). Among ER-positive tumors (n = 18),
  glutathione was significantly elevated in the carbohydrate group compared to the fasting group (p = 0.002), with a
  positive correlation between preoperative S-insulin levels and the glutathione content in tumors (r = 0.680; p =
  0.002). In all tumors (n = 29), glutamate was increased in tumors with high proliferation (t-test; p = 0.009),
  independent of intervention group. Moreover, there was a positive correlation between tumor size and proliferation
  markers in the carbohydrate group only. Patients with ER-positive / T2 tumors and high tumor glutathione (≥1.09),
  high S-lactate (≥56.9), and high S-pyruvate (≥12.5) had inferior clinical outcomes regarding relapse-free survival,
  breast cancer-specific survival, and overall survival. Moreover, Integrated Pathway Analysis (IPA) in serum revealed
  activation of five major anabolic metabolic networks contributing to proliferation and growth.
  (Continued on next page)

* Correspondence: tonehl@yahoo.no
Tone Hoel Lende and Marie Austdal shared First authorship.
Emiel A. M. Janssen, Håvard Søiland and Jan PA Baak are equal senior
contributor.
1
 Department of Breast & Endocrine Surgery, Stavanger University Hospital,
Helse Stavanger HF, P.O. Box 8100, N-4068 Stavanger, Norway
2
 Centre for Cancer Biomarkers CCBIO, Department of Clinical Medicine,
Faculty of Medicine and Dentistry, University of Bergen, Jonas Lies vei 87,
N-5012 Bergen, Norway
Full list of author information is available at the end of the article

                                         © The Author(s). 2019 Open Access This article is distributed under the terms of the Creative Commons Attribution 4.0
                                         International License (http://creativecommons.org/licenses/by/4.0/), which permits unrestricted use, distribution, and
                                         reproduction in any medium, provided you give appropriate credit to the original author(s) and the source, provide a link to
                                         the Creative Commons license, and indicate if changes were made. The Creative Commons Public Domain Dedication waiver
                                         (http://creativecommons.org/publicdomain/zero/1.0/) applies to the data made available in this article, unless otherwise stated.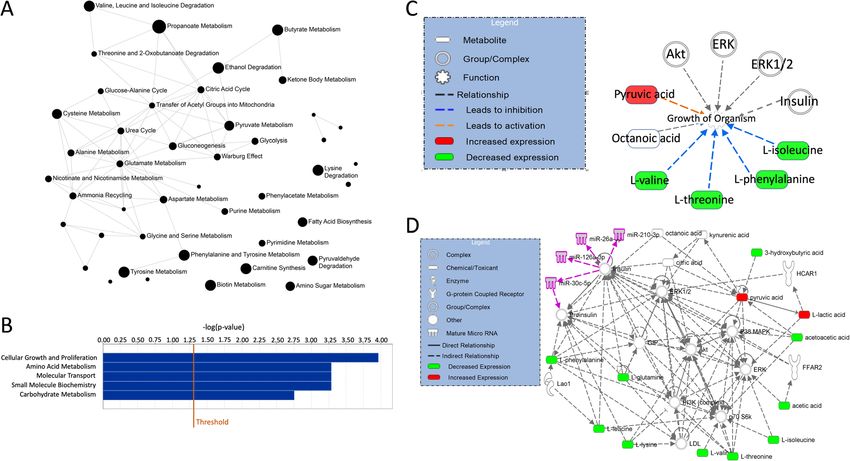
Lende et al. BMC Cancer    (2019) 19:1183                                                                        Page 2 of 23

 (Continued from previous page)
 Conclusions: Preoperative carbohydrate load increases systemic levels of lactate and pyruvate and tumor levels of
 glutathione and glutamate in ER-positive patients. These biological changes may contribute to the inferior clinical
 outcomes observed in luminal T2 breast cancer patients.
 Trial of registration: ClinicalTrials.gov; NCT03886389. Retrospectively registered March 22, 2019.
 Keywords: Breast cancer, Carbohydrate load, Proliferation, Insulin, Insulin c-peptide, S-lactate, S-pyruvate, Tumor
 glutamate, Tumor glutathione, Fasting state, Ketonic bodies, Clinical outcome,

Background                                                      recently conducted a randomized controlled trial (RCT) in
Breast cancer is the most common female malignancy and          which operable breast cancer patients were treated with
one of the most frequent causes of death among women            either two oral loads of enriched carbohydrate solution or
in the Western world [1]. Breast cancer incidence has           a standard fasting procedure comprising free drinking of
more than doubled in the last 50 years, probably due to in-     tap water before surgery [16]. In this study, luminal breast
creased estrogen exposure and a change towards high             cancer patients, who received oral pre-operative carbohy-
levels of alimentary carbohydrates and fat [2, 3]. Even         drates, had a higher tumor proliferation and an adverse
though breast cancer originates locally in the breast, circu-   survival. The goal of the present paper, using the same pa-
lating tumor cells (CTCs) may spread to the systemic cir-       tients, was to further explore the metabolic differences in
culation before and during surgery [4] and establish            serum and the tumor. Based on our previous findings, we
distant micrometastases [5]. These CTCs must thrive and         hypothesize that the metabolic changes after carbohydrate
survive attacks from the innate and adaptive immune sys-        loading will correlate with proliferation and outcome in
tem. Thus, tumor cells have to establish a favorable metab-     patients with ER positive tumors. Also, we also wanted to
olism that can produce energy, protection mechanisms,           study whether such metabolic alterations correlate with
and the necessary biomass to survive the journey from the       other tumor characteristics or translate into differences in
breast tumor to remote locations, including transform-          clinical outcome.
ation into dormancy [6]. The luminal breast cancer sub-
type, which express estrogen receptor (ER) and/or               Methods
progesterone receptor (PR) in the tumor cells, comprise         Ethics statement
the largest subgroup, accounting for approximately 75%          This paper is an explorative study based upon a recently
of all breast cancers. Endocrine resistance in this sub-        published randomized controlled trial (RCT) approved
type can creates micrometastases that escape anti-              by the Regional Ethics Committee in Western Norway
estrogen therapy and can hibernate for many years               (#2015/1445) and was retrospectively registered at Clini-
before they become clinically overt [7]. The molecular          caltrials.gov (NCT03886389).
features underlying these cellular characteristics are
driven by hallmarks of cancer [8], including changes            Patients
in cellular energetics and metabolism, followed by a            Details on these patients have been described previously
vast number of necessary metabolic modifications to             [16]. In short, between 12 May 2009 and 23 June 2010 a
strengthen the metabolic needs of breast cancer cells           population-based cohort of 61 operable breast cancer
[9]. A well-known cellular characteristic of tumor              patients (Stage I and II) were randomized into an inter-
cells is increased glucose consumption and glycolysis           vention group receiving preoperative per-oral carbo-
towards lactate despite the presence of oxygen, a fea-          hydrate loading (n = 26) or a control group (n = 35)
ture called ‘the Warburg effect’ [10, 11]. This meta-           receiving the standard preoperative fasting protocol.
bolic switch includes the production of ribose for                 The patients in the carbohydrate group drank 200 mL
DNA synthesis and allowing amino acids to be a                  pre-Op™ (Nutricia, the Netherlands). This non-carbonated
source for ATP production [12]. Furthermore, the                carbohydrate enriched drink contained 100 kCal per bot-
Warburg effect extends to increased choline metabol-            tle containing 4.2 g (2.1%) glucose and 20 g (10%) polysac-
ism for cell membrane synthesis and increased amino             charides. A loading dose of two bottles pre-Op™ were
acid turnover for protein synthesis [10, 13].                   given 18 h before surgery (i.e. the evening before surgery)
  Even though much is known about metabolism in breast          and another 2 bottles were administered 2–4 h before
cancer cells [14], little is known about the influence of       surgery (i.e. the morning of the operation day). In contrast,
carbohydrate loading in the early recovery after surgery        the control group practiced the standard fasting procedure
(ERAS) program [15] on peri-operative metabolism in the         with free intake of tap water 12–14 h before surgery. From
systemic circulation and locally in the breast tumor. We        this cohort, patients with available fresh frozen tissue and
Lende et al. BMC Cancer      (2019) 19:1183                                                                   Page 3 of 23

serum samples were included in the present study (Fig. 1).   analysis, tissues from all of the patients were analyzed
The patient characteristics are given in Table 1.            consecutively for histopathology and immunohistochem-
                                                             istry as described preciously [16].
Blood sampling
Blood samples were drawn immediately before surgery.         Serum hormone and protein analyses
In total three serum gel tubes and one EDTA plasma           Serum was transported to the Hormone Laboratory, Hau-
tube were drawn in this study. One serum gel tube and        keland University Hospital, Bergen, Norway. Insulin, insulin
one EDTA plasma tube were delivered within an hour to        c-peptide, insulin growth factor 1 (IGF-1), and insulin
the department of medical biochemistry for standard          growth factor binding protein 3 (IGFBP-3) were measured
analysis. For metabolomics analyses, two serum gel tubes     by the IMMULITE 2000 two-site chemiluminescent immu-
were centrifuged within one hour at 4 °C, 2500 x g in 10     nometric assay (Siemens Medical Solutions Diagnostics).
min. After centrifugation, the serum of the two tubes
were mixed and a minimum of 1.1 mL serum were sent           Serum metabolomics analyses
for analyses in Haukeland University Hospital, Bergen,       A separate aliquot of serum was transported to the MR
Norway, the rest of the serum were stored in 1 mL cryo-      Core Facility at NTNU, Trondheim, Norway for metabolo-
tubes at − 80 °C in the biobank at Stavanger University      mics analyses. Thawed samples (100 μL) were mixed with
Hospital, Stavanger, Norway.                                 bacteriostatic buffer (100 μL; pH 7.4, 0.075 mM Na2HPO4,
                                                             5 mM NaN3, 5 mM TSP), transferred to 3-mm NMR tubes,
Tumor tissue sampling                                        and stored at 5 °C until analysis (< 15 h). The MR analysis
Immediately after removal of the surgical specimen from      was performed using a Bruker Avance III Ultrashielded
the systemic circulation, it was transported to the          Plus 600 MHz spectrometer (Bruker Biospin GmbH,
Department of Pathology for further sampling. To avoid       Germany) equipped with a 5 mm QCI Cryoprobe with inte-
necrotic areas, cancerous tissue from the invasive front     grated, cooled pre-amplifiers for 1H, 2H, and 13C. Experi-
of the tumor (i.e. tumor periphery) was immediately          ments were fully automated using the SampleJet™ in
snap-frozen in liquid nitrogen and stored at − 80 °C until   combination with Icon-NMR in TopSpin 3.1 software (Bru-
assayed for tissue metabolomics. Before HR-MAS               ker Biospin). One-dimensional 1H Nuclear Overhauser

 Fig. 1 Flowchart of study participants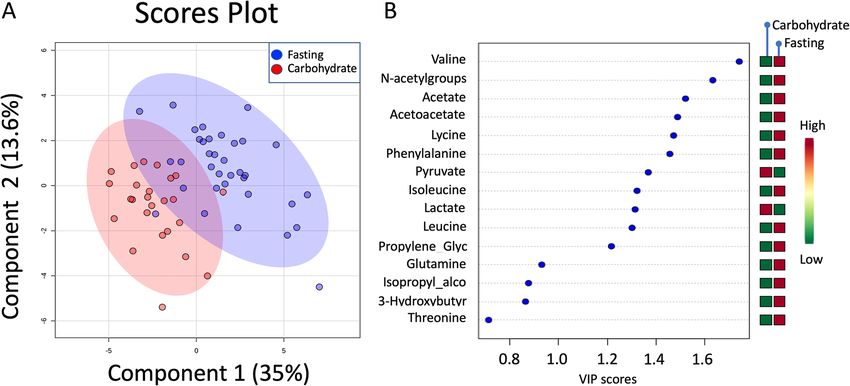
Lende et al. BMC Cancer         (2019) 19:1183                                                                                         Page 4 of 23

Table 1 Clinical variables in the randomized groups
                                        Carbohydrate                  Fasting group                Carbohydrate group with        Fasting group with
                                        group (N=26)                  (N=35)                       tissue (n=16)                  tissue (n=13)
Age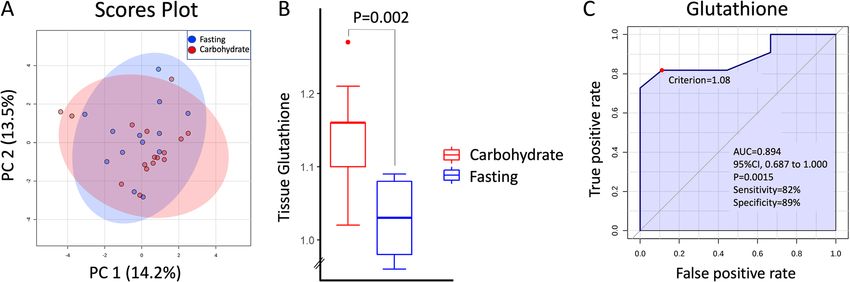
Lende et al. BMC Cancer   (2019) 19:1183                                                                         Page 5 of 23

Natick, MA, USA). The CPMG spectral region between 0.1          intensities. The metabolite integrals were log10 trans-
and 4.2 ppm was selected for further processing. Chemical       formed to satisfy prerequisite assumptions of normality.
shifts were referenced to the left alanine peak at 1.47 ppm.
Metabolites were identified based on previous assignment
[17, 18]. Twenty-eight metabolites were identified as meas-     Endpoints
urable and their areas calculated by integrating the area       Proliferation differences between the carbohydrate and fast-
under the signal curve.                                         ing groups were evaluated by Ki67 (< 15% or ≥ 15 and <
                                                                30% or ≥ 30%), mitotic activity index (MAI; < 10 or ≥ 10),
Breast tumor tissue metabolomics analyses                       and PPH3 (< 13 or ≥ 13). The metabolic response to pre-
In the 29 patients with available tissue, the tumors were       operative oral carbohydrate loading was evaluated in serum
larger (45% vs. 9% pT2/3/4, p = 0.003), had a higher histo-     (preoperative) by 1H NMR and in tumor tissue by HR-
logical grade (52% vs. 18% grade 3, p = 0.022), were more       MAS MRS.
often ER-negative (35% vs. 3%, p = 0.002), and had higher
proliferation (59% vs. 27% PPH3-positive, p = 0.002) than       Univariate analysis
those without tissue. Thus, we had a selection bias of lar-     Metabolite differences between groups were assessed by
ger, non-luminal and a more proliferative tumors into the       student T-tests. Correlations between continuous vari-
present study compared to the original study [16]. Tissue       ables were assessed by Pearson correlation. Categorical
was transported on dry ice to the MR Core Facility at           variables were compared by Chi square tests. P-values
NTNU, Trondheim, Norway, for metabolomics analyses.             were considered significant when p < 0.05. When multiple
Tissue samples were prepared frozen on a metal plate            variables were compared, the resulting p-value tables were
bathed in liquid nitrogen to minimize tissue degradation.       corrected for multiple testing by the Benjamini-Hochberg
Biopsies (11.0 ± 2.3 mg) were cut to fit 30 μL disposable in-   method [22].
serts (Bruker Biospin Corp, USA) filled with 3 μL D2O con-
taining 25 mM formate. The insert containing the frozen
sample was placed in a 4-mm diameter zirconium rotor            Multivariate analyses (serum and tissue)
(Bruker, Biospin GmbH, Germany) and kept at − 20 °C             Multivariate analyses were performed in R V.3.5 [23]
until analysis (< 8 h). Spin-echo spectra were acquired on a    using the package PLS [24] and MetaboAnalyst [25].
Bruker Avance DRX600 spectrometer with a 1H/13C magic           Metabolite values were auto-scaled (mean-centered and
angle spinning (MAS) probe with gradient (Bruker Biospin        divided by variance) before multivariate analysis. Princi-
GmbH, Germany) using the following parameters: 5 KHz            pal component analysis (PCA) was performed to evalu-
spin rate, 5 °C probe temperature, 5-min temperature            ate the data sets for outliers. Partial least squares
acclimatization before shimming and spectral acquisition,       discriminant analysis (PLS-DA) was performed to ex-
CPMG pulse sequence (cpmgpr1d; Bruker) with 4 s water           plore differences in serum and tissue metabolic profiles
suppression prior to a 90° excitation pulse, total echo time    between categories: carbohydrate loading vs fasting. Par-
77 ms, 256 scans, and spectral width 20 ppm. Spectra were       tial least squares (PLS) was used to find correlations be-
Fourier transformed into 64 K following 0.3 Hz line broad-      tween the tissue metabolic profile and variables (MAI,
ening. Phase correction was performed automatically for         PPH3, Ki67, serum (S)-glucose, S-insulin, S-insulin c-
each spectrum using TopSpin 3.1.                                peptide, S-IGFR, S-IGFPB3, S-estradiol). Metabolites
   Spectra were preprocessed in Matlab 2013b as follows         were evaluated by Variable Importance in Projection
[19]. The spectral region between 1.4–4.70 ppm, which           (VIP) score. The VIP score is a measure of how import-
contained the majority of the metabolite signals, was           ant each variable was for creating the discrimination
selected for further processing. Chemical shifts were           model. It is calculated as a weighted sum of squares of
referenced to the creatine peak at 3.03 ppm. The spectra        the PLS loadings, where the weights are based on the
were baseline-corrected using asymmetric least squares          amount of y-variance explained in each dimension [26].
[20] with parameters λ = 1e7 and p = 0.0001, setting the        PLS and PLS-DA classification parameters were evalu-
lowest point in each spectrum to zero. Lipid peaks at           ated by ‘leave-one-out’ cross validation due to the lim-
4.34–4.27, 4.19–4.14, 2.90–2.7, 2.31–2.18, 2.11–1.92, and       ited sample numbers. Permutation testing was carried
1.68–1.5, and ethanol at 3.67–3.62, were excluded. The          out as an additional model validation; sample classes or
resulting spectra were normalized to the total area to cor-     responses were shuffled, and the model rebuilt with the
rect for differences in sample size and tumor cell content.     same numbers of latent variables as the original model.
Metabolite peak assignment was based on previous identi-        One thousand permutations were performed, and
fication [21]. Twenty metabolites were identified as meas-      models were considered significant if the final accuracy
urable, and the area under the signal curve in the              (of classification models) or R2 (of regression models)
preprocessed spectra was used to calculate their relative       were > 95% of the permuted accuracy values (p < 0.05).
Lende et al. BMC Cancer (2019) 19:1183 Page 6 of 23
Thresholds in survival analyses levels of ketone bodies, such as S-acetate, S-acetoacetate,
Relapse-free survival (RFS) was defined as the time from and S-3-hydroxybutyrate, were increased (Table 2). In
surgery until a relapse from any site. Breast cancer- addition, we observed increased S-N-acetylated groups, S-
specific survival (BCSS) was defined as the time from leucine, S-valine and S-isoleucine in the fasting group (all
surgery until death from breast cancer, whereas overall p < 0.05; Fig. 2b). We found positive correlations between
survival (OS) was until death from any cause. Receiver- tumor size and S-lactate (r = 0.344; p = 0.016) and tumor
operator characteristic (ROC) analysis identified optimal size and S-pyruvate (r = 0.370; p = 0.009).
thresholds for the various continuous metabolite vari- In the carbohydrate group, there was a positive lin-
ables using relapse ‘Yes/No’ as the categorical variable ear correlation between proliferation (Ki-67) and
(Table 8 in Appendix). The cut-off values obtained in tumor size (r = 0.782, p = 0.038). When Ki-67, PPH3
RFS analysis were also used in the BCSS and OS ana- and MAI were included in a forward and backward
lyses. In ER-negative patients, none of the explanatory stepwise linear regression MAI was the only inde-
variables with ROC-derived thresholds were significant pendent factor explaining increment in tumor size
for analysis of RFS, BCSS, or OS. Therefore, further with a Beta = 0.530 (95%CI, 0.201 to 0.875) P = 0.009.
analyses were limited to ER-positive patients. The ROC- In the fasting group, there was no correlation be-
obtained thresholds were confirmed with the minimal p- tween tumor size and proliferation.’
value/maximal Wald-value in a Cox model. In the
multivariabel Cox analyses the ‘Forward Wald’ method Serum glucose and insulin responses
was primarily used. In cases of an unstable model, a The mean fasting glucose and insulin values at admission
stepwise backward analysis was performed. were 5.4 mmol/L (95% CI 5.1 to 10.0) and 9.4 mIU (95%
CI 6.8 to 32.5), respectively (normal ranges: glucose, 4.0 to
Metabolite set enrichment analysis and ingenuity 6.0 mmol/L; insulin, 6.0 to 27.0 mIU; c-peptide, 0.3 to 2.4
pathway analysis (IPA) nmol/L). In the carbohydrate group, the mean preoperative
Serum metabolite levels were uploaded to the Enrich- insulin value was 35.6 mIU (26.7 to 106 mIU), compared
ment module of MetaboAnalyst to explore the pathways to 9.1 (8.6 to 22 mIU) in the fasting group (student’s t-test
affected by the carbohydrate intervention. Pathway- p < 0.001). For C-peptide, the mean values in the carbohy-
associated metabolite sets with sets containing at least drate and fasting groups were 2.10 nmol/L and 0.76 nmol/
two metabolites were used. Pathways with p-values L, respectively (p < 0.001). We found significant univariate
≤0.05 (after FDR correction) were interpreted as signifi- correlations between the serum concentrations of pre-
cant. Serum metabolites with significantly different operative insulin (Table 3), Insulin C peptide (Table 9 in
expression (p = 0.05) and their corresponding fold Appendix) IGFBP3 (Table 10 in Appendix), but not to
changes were imported into the Ingenuity Pathway Ana- IGF1 (Table 11 in Appendix). Multivariate analysis with
lysis (IPA) software (Ingenuity, Redwood City, USA) to leave-one-out cross-validation showed significant correla-
explore which biological and molecular functions these tions between the serum metabolic profile and insulin
metabolites were involved in and how these and their (Cross-validated (CV) (R2 = 0.33, p < 0.001; Fig. 3a+b),
direct and indirect target molecules were connected, Insulin C-peptide (CV R2 = 0.35, p < 0.001; Fig. 3c+d),
using the network function in IPA. Additionally, we IGFBP3 (CV R2 = 0.11, p < 0.001; Fig. 3e+f), but not IGF-1.
examined if there were a direct or indirect connection For both insulin and insulin C-peptide, the most important
between the top network and seven microRNAs related metabolites for predictions were increased S-glucose, S-
to tamoxifen resistance from our previous paper [27], lactate and decreased S-Leucine. For IGFBP3, the most
using the grow function with a moderate or experimen- important metabolites were increased S-Acetone, S-
tally observed confidence level. Glycoprotein, and S-Leucine. We also found positive corre-
lations between S-lactate and the preoperative increase in
Results S-insulin and S-insulin / c-peptide (r = 0.57; p < 0.001 and
Systemic metabolism r = 0.61; p < 0.0001), and between S-pyruvate and the in-
The results of the quantification of serum metabolites in crease in preoperative S-insulin and S-insulin c-peptide
the carbohydrate and fasting groups are given in Table 2. (r = 0.54; p < 0.001 and r = 0.60; p < 0.001).
Fourteen out of 28 metabolites were significantly altered
between the groups. PLS-DA revealed a significant differ- Tumor metabolism
ence in metabolic profiles between the two groups.; (one Metabolites included in the analysis are presented in
component, classification accuracy = 0.85; p < 0.001; Fig. 2a). Table 4. PLS-DA did not result in a significant model dis-
The main increased markers were increased serum (S) lac- criminating between fasting and carbohydrate-fed patients,
tate and S-pyruvate in the carbohydrate group (p < 0.0001; and no metabolites were significantly different in univariate
Fig. 2a and b). Among the patients in the fasting group, the testing when all tumors were analyzed (Fig. 4a). However,Lende et al. BMC Cancer (2019) 19:1183 Page 7 of 23 Table 2 Serum metabolites with p-values from t-tests, fasting group versus carbohydrate (CH), for all patients and for the ER positive subset Metabolite p-valuea Fold change p-valuea ER+ Fold change ER+ 3-Hydroxybutyrate 0.010 -1.06 0.010 -1.07 Acetate
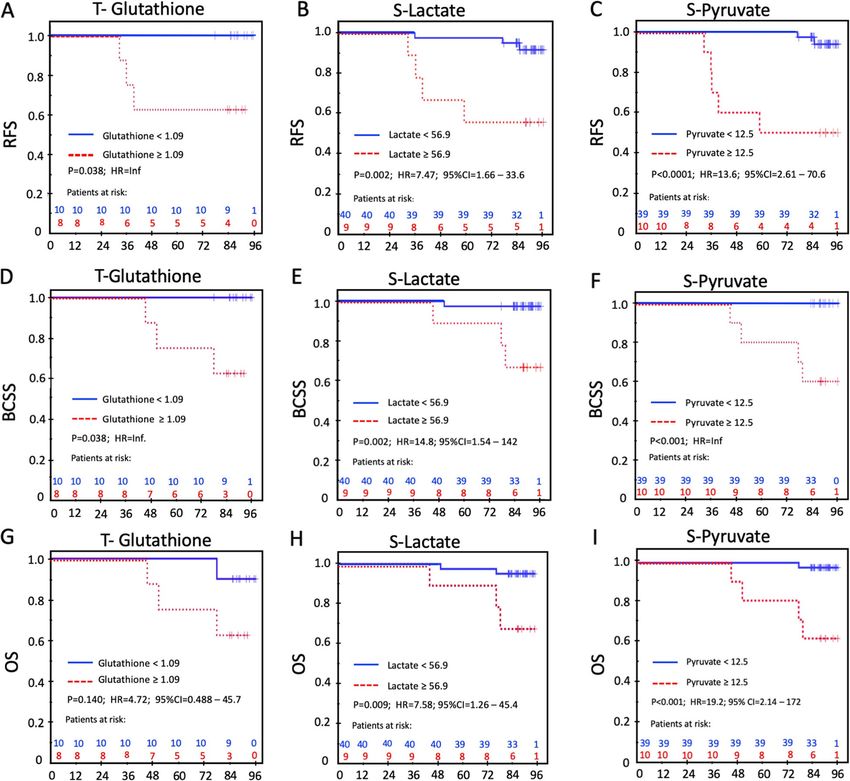
Lende et al. BMC Cancer     (2019) 19:1183                                                                                            Page 8 of 23

 Fig. 2 Partial Least Square Discriminant Analysis (PLS-DA) in serum. a Scores plot showing serum samples from the fasting group (green) and
 carbohydrate group (red). The carbohydrate and fasting groups have significantly different metabolic profiles as evidenced by permutation
 testing. b Variable Importance in Projection (VIP) scores showing the top 14 metabolites contributing to differences between the groups. The
 right column indicates increased (red) or decreased (green) metabolite in the indicated group

S-pyruvate and S-Lactate were 1.85 (95%CI, 1.15 to 2.97;                   group. Even though the relapses were restricted to pa-
p = 0.011) and 1.13 (95%CI, 1.01 1.26; p = 0.028) respect-                 tients with T2 tumors, tumor category was not an inde-
ively. The corresponding observations for OS were 1.63                     pendent prognostic factor in the multivariable analyses.
(95%CI, 1.11 to 2.40; p = 0.014) for lactate and 1.10                      In the multivariable analysis for RFS, S-pyruvate was the
(95%CI, 1.002 to 1.20; p = 0.045) for pyruvate. There-                     only factor left in the final model (HR = 12.8; 95% CI,
after, the following independent variables were dichoto-                   2.47 to 66.8), and only S-lactate remained in the final
mized according to the optimal ROC-derived thresholds:                     multivariable model for BCSS (HR = 14.8; 95% CI 1.54 to
S-lactate, S-pyruvate, preoperative S-insulin, preo-                       142). Furthermore, S-pyruvate was the sole factor to
perative S-insulin-c-peptide, and tissue glutathione. In                   reach significance in the multivariable model of the OS
addition, the well-established prognostic factors tumor                    analysis (HR = 18.2; 95% CI 2.03 to 164).
size, nodal status, histological grade, MAI 10, Ki-67-30
and PPH3–13 were deemed clinically relevant and in-                        Pathway analyses
cluded as explanatory variables in the multivariable ana-                  In the Pathway analyses, MetaboAnalyst and IPA
lyses. The results of the univariate RFS, BCSS, and OS                     showed complimentary information. Quantitative
analyses are given in Tables 5, 6 and 7, respectively. Pa-                 metabolite set enrichment analysis (MSEA) identified
tients with a high glutathione content in the tumor                        biologically meaningful patterns in serum metabolite
(≥1.09) had a 37% risk of experiencing a relapse and 37%                   concentration changes (Fig. 6a and Table 12 in Appen-
risk of dying of breast cancer compared to no relapses                     dix). Significantly enriched pathways included energy as-
and no deaths in patients with a low glutathione content                   sociated metabolic pathways (amino sugar metabolism
in the tumor (both comparisons: p = 0.038; HR = Inf.;                      and pyruvate metabolism which links to glutamate
Fig. 5a and d). Patients with high S-lactate (≥56.9) had                   metabolism, the citric acid cycle, gluconeogenesis and
RFS of 71% compared to 97% for those with lower S-                         the Warburg effect). IPA showed the main functions of
lactate (p = 0.002, HR = 7.47; 95% CI 1.66–33.6; Fig. 5b).                 the involved metabolites as cellular growth and prolifera-
Patients with S-pyruvate ≥12.5 had an adverse RFS of                       tion, molecular transport, small molecule biochemistry,
50% compared to 95% for the patients with S-pyruvate                       carbohydrate metabolism and amino acid metabolism
< 12.5 (p < 0.0001; HR = 13.6; 95% CI 2.61–70.6; Fig. 5c).                 (Fig. 6b). Interestingly, the metabolites showed a pattern
The same pattern was observed in the BCSS and OS                           congruent with growth of organism (Fig. 6c) with metab-
analyses for these three prognostic variables (Fig. 5e-i).                 olites increased in carbohydrate-fed patients activating
Notably, only one contralateral relapse occurred in the                    growth pathways, and downregulation of metabolites
fasting group – all others were in the carbohydrate                        acting as inhibitors of growth. Finally, four (miR-26a-5p,
Lende et al. BMC Cancer         (2019) 19:1183                                                                                     Page 9 of 23

Table 3 Serum metabolite values correlated to insulin                            the 15 different serum metabolites that distinguished
(Pearson’s correlation) for the total study population, and the                  fasting from the per-oral carbohydrate load, we observed
carbohydrate and fasting groups separately                                       increased systemic lactate and pyruvate, decreased
Metabolite            R (All)   P (All)*   R (CH)   P (CH)    R (F)   P (F)      ketone bodies, increased glycerol, and reduced amino
Lactate               0.57
Lende et al. BMC Cancer      (2019) 19:1183                                                                                            Page 10 of 23

 Fig. 3 Correlation between serum metabolic profile and serum insulin, insulin C-peptide, and IGFBP3. Samples from carbohydrate-fed patients are
 shown in red, while samples from fasting patients are shown in blue. Metabolites are colored according to their variable importance in projection
 (VIP) score and labeled when VIP≥1. a Measured insulin vs. predicted insulin levels based on metabolic profile (cross-validated measurements). b
 Metabolites versus regression coefficient for insulin. Increased S-glucose, S-lactate, and decreased S-Leucine are important to prediction of serum
 insulin from the metabolic profile. c Measured insulin C peptide vs. predicted insulin C-peptide levels. d Regression weight plot showing
 metabolites versus the regression coefficient for insulin C-peptide. Increased S-Glucose, S-Lactate, and decreased S-Leucine are important to
 prediction of serum insulin C-peptide from the metabolic profile. e Measured Insulin Growth Factor Binding Protein 3 (IGFBP3) vs. predicted
 IGFBP3 based on metabolic profile. f Regression weight plot showing metabolites versus the regression coefficient for IGFBP3. Increased S-
 Acetone, S-Glycoproteins, and S-Leucine are important to prediction of serum IGFBP3 from the metabolic profile

blur the contribution from the cancer cell metabolism to                    lactate and pyruvate will certainly benefit the free CTCs
the serum levels [18], our present observation of positive                  shed from the tumor during surgery that are on their
correlation between larger tumor size and increasing S-                     way to distant tissue to form micrometastases [39] but
lactate is supported by Hui S et al. [37].. Also, the posi-                 may also benefit the preoperatively established occult
tive correlation between proliferation and tumor size                       micrometastases [40, 41]. Lactate and pyruvate are the
solely occurs in the carbohydrate group this suggests                       most preferred substrates for lactate/pyruvate dehydro-
that carbohydrate exposure to larger tumors (i.e.T2                         genase (LDH/PDH), ensuring a 1:1 ratio between lac-
tumors) increases both proliferation and S-lactate. Thus,                   tate and pyruvate when equilibrium is reached. Thus,
this indicates that lactate from the Warburg effect in the                  LDH provides substrate for both the production of
tumor cells may have a substantial contribution to the                      ATP via the tricarboxylic acid (TCA) cycle [37] and
systemic lactate and pyruvate levels. This observation                      also increased gluconeogenesis for the production of ri-
also adheres to the lack of correlation between intra                       bose for nucleotide synthesis via the pentose phosphate
tumor lactate/pyruvate and fasting/carbohydrate status                      pathway (PPP) [38]. Notably, increased levels of serum
in the present study, as the former are probably excreted                   LDH [42] and increased expression of LDH in breast
from the cells into the systemic environment.                               cancer tissue [43] and lung tumors [44] are associated
   Moreover, tumor cells not only produce lactate for                       with an inferior prognosis.
excretion through MCT-4, they are also able to take up                        In line with other studies [45], we observed a positive
systemic circulating lactate and pyruvate via the MCT-                      correlation between higher proliferation and increased
1 transporters [38]. Regardless of the source, systemic                     glutamate content in tumor tissue. Glutamate is a
Lende et al. BMC Cancer (2019) 19:1183 Page 11 of 23
Table 4 Tumor metabolites with fold changes and t-test p- dependent, as it serves as a direct route into the TCA
values in carbohydrate vs fasting groups cycle at the alpha-ketoglutaric acid level with conse-
Tumor metabolite P (All)a FC (All) P (ER+)b FC (ER+) quential ATP production. Together with glycine and
Acetate 0.844 -1.030 0.620 -1.095 cysteine, glutamate is a precursor to the tripeptide gluta-
Alanine 0.322 1.038 0.163 1.067 thione, which is an antioxidant molecule that serves to
‘buffer’ superoxide insults encountered in the tumor
Ascorbate 0.300 -1.099 0.991 -1.001
microenvironment [45]. Glutathione is the major thiol-
Aspartate 0.385 1.100 0.545 1.088
containing endogenous antioxidant and serves as a redox
Choline 0.136 1.056 0.547 1.027 buffer against various sources of oxidative stress. In tu-
Creatine 0.418 -1.062 0.558 -1.051 mors, maintaining a supply of glutathione is critical for
Glucose 0.495 -1.151 0.500 -1.201 cellular survival because it allows cells to resist the oxi-
Glutamate 0.172 1.047 0.146 1.055 dative stress associated with rapid metabolism, DNA-
damaging agents, and inflammation, among others [48,
Glutamine 0.955 1.003 0.816 -1.015
49]. Glucose metabolism and biosynthesis of glutathione
Glutathione 0.006 1.082 0.002 1.103
are often modulated by the PI3K/Akt pathway, which is
Glycerophosphocholine 0.712 -1.018 0.762 -1.018 often dysregulated in breast cancer tumors [50, 51]. Im-
Glycine 0.186 1.063 0.162 1.090 portantly, one of the effects of targeting the PI3K/Akt-
Lactate 0.862 1.006 0.922 1.004 pathway upstream [52] and downstream [19] is reduced
Leucine 1.000 1.000 0.947 -1.004 glutathione content in tumor cells. In the PPP-pathway,
NAD+ and NADP are converted into NADH and
Myoinositol 0.445 -1.038 0.768 -1.018
NADPH, respectively, which contribute to maintaining
Phosphocholine 0.517 1.027 0.291 1.051
glutathione (GSSG) in the reduced state (GSH) [53].
Phosphoethanolamine 0.211 1.050 0.544 1.031 Thus, the PPP-pathway in the Warburg effect secures a
Scylloinositol 0.926 -1.007 0.565 1.060 high intracellular level of glutathione, which is regarded
Succinate 0.788 1.022 0.503 1.067 as the most important cellular protection system against
Taurine 0.982 1.001 0.902 1.004 attack from reactive oxygen species (ROS) in both divid-
ing and hibernating luminal cells [10], and also in cancer
Abbreviations: ER+ Estrogen receptor positive, FC Fold change, P T-test p-value
a
Significant at p ≤ 0.001 after Benjamini-Hochberg correction stem cells [54]. Thus, preoperative carbohydrate loading
b
Significant at p ≤0.030 after Benjamini-Hochberg correction seems to create a doubly favorable environment that will
probably serve the CTCs liberated during surgery [39]
metabolic product of glutaminolysis, which drives mem- more than the already established micrometastases [55].
brane trafficking to promote breast cancer cell invasive- First, CTCs have a surplus of cellular fuel via lactate and
ness [46]. In addition, the expression of glutaminase pyruvate available systemically. Second, they benefit
genes GLS and GLS2 correlates with increased tumor from an increased level of intracellular protection sys-
growth rates [47]. Many tumors become glutamine- tems against ROS via increased tumor glutathione. Both
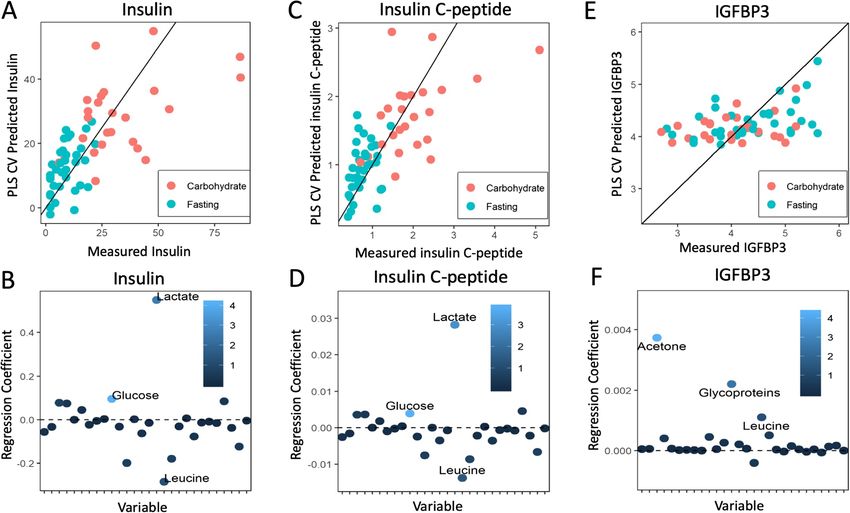
Fig. 4 a Principal Component Analysis (PCA) of tumor metabolites. No grouping of fasting vs carbohydrate groups observed. b Glutathione levels
in ER positive tumors. c ROC curve for classification into carbohydrate or fasting group by glutathione concentration in ER-positive tumors. AUC=
0.894; 95%CI=0.0.687-1.000, P=0.002Lende et al. BMC Cancer (2019) 19:1183 Page 12 of 23
Table 5 Univariate analysis of Relapse Free Survival in ER+ patients
Variable Events / At risk % Survival P HR 95% CI
Fasting / Carbohydrate
Fasting 1/29 97
Carbohydrate 6/21 71 0.012 9.34 1.12 –77.7
a
S-Pyruvate
< 12.5 2/39 95
≥ 12.5 5/10 50Lende et al. BMC Cancer (2019) 19:1183 Page 13 of 23
Table 6 Univariate analysis of Breast Cancer Specific Survival in resulting in apoptosis [58]. Secondly, a ketogenic diet
ER+ patients has been shown to be effective in preclinical studies [59].
Variable Events / % Survival P HR 95% CI A ketogenic diet produces a large amount of intracellu-
At risk lar ketone bodies that have a direct cytotoxic effect.
Fasting /Carbohydrate Furthermore, the ketogenic state inhibits insulin/IGF
Fasting 0/29 100 signaling and downstream signaling pathways, such as
Carbohydrate 4/21 81 0.015 Inf. PI3K/Akt/mTOR [60]. Interestingly, in the present
study, the patients in the fasting group reached a keto-
S-Pyruvate
genic state with increased ketone bodies, which may
< 12.5 0/40 100
have created an unfavorable environment for the cancer
≥ 12.5 4/10 60Lende et al. BMC Cancer (2019) 19:1183 Page 14 of 23
Table 7 Univariate analysis of Overall Survival in ER+ patients
Variable Events /At risk % survival P HR 95% CI
Carbo/Faste
Faste 1/29 97
Carbohydrate 4/21 81 0.068 6.02 0.675–53.8
a
S-Pyruvat
< 12.5 1/39 97
≥ 12.5 4/10 60 1.0855 3/8 63 0.140 4.72 0.488–45.7
Tumor size
T1 1/40 98
T2 4/10 60 < 0.0001 19.2 2.20 –176
Nodal status
N0 2/33 94
N+ 3/17 82 0.205 3.01 0.502–18.0
Grade
1 0/11 100
2+3 5/39 87 0.222 30.2 0.004–223736
a
MAILende et al. BMC Cancer (2019) 19:1183 Page 15 of 23 Fig. 5 Survival analyses for Tumor-Glutathione, Serum-lactate and Serum-pyruvate. a-c Relapse Free Survival (RFS); d-f Breast Cancer Survival (BCSS); g-i Overall Survival (OS) resistance with reduced effect of tamoxifen and aroma- included paucimannosylation [78]. Intriguingly, the tase inhibitors. Thus, it seems plausible to introduce metastatic Epithelial-Mesenchymal-Transition (EMT) metformin early on as adjuvant treatment to regain the process is regulated through glycosylation of key regula- endocrine sensitivity. Intriguingly, circulating micro- tor proteins, that are frequently modulated via the insu- RNAs from the tumor in exosomes [76] can perform lin /IGF signaling [79]. Thus, glycosylation opens up a cell-independent microRNA biogenesis and promote connection between the glucose/insulin signaling and tumorigenesis away from the primary tumor [77]. Thus, increased survival of CTCs trough enhancement of the we may speculate that one of the steps in the metastatic EMT-processes. process is to control the systemic metabolic pathways to Taken together, this explorative study indicates that the ensure a beneficial environment and survival of the carbohydrate loading state and fasting state have opposite liberated cancer cells [54]. Moreover, increased cellular systemic and micro-environmental effects, which may ex- uptake of glucose via the Warburg effect [10] favor plain why the relapses in the present study were skewed differentiating glycosylation of intracellular proteins towards the carbohydrate group, with an inferior RFS,
Lende et al. BMC Cancer     (2019) 19:1183                                                                                         Page 16 of 23

 Fig. 6 Pathway analyses in serum metabolites. a Metabolite Set Enrichment Analysis of serum metabolism. Significantly enriched pathways are
 annotated in the pathway network. The circle size denotes significance of the pathway, and lines denote at least 25% shared metabolites in the
 pathways. b Ingenuity pathway analysis (IPA) bar chart showing the top 5 functions enriched in the dataset. c IPA pathway network showing the
 metabolites connected to four microRNAs found to be involved in tamoxifen resistance. Metabolites in green are downregulated in
 carbohydrate-fed patients, while metabolites in red are upregulated. MicroRNAs are colored purple. d IPA Function plot showing metabolites
 involved in organismal growth. Orange arrows indicate activation, while blue arrows indicate inhibition

BCSS, and OS in patients with high tissue glutathione,                    demographic data of the patients would have
high S-lactate, and high S-pyruvate. The favorable macro-                 strengthened the study. Detecting the well-known
and micro-environmental changes for the tumor that                        endocrine metabolic fingerprint of insulin strengthens
come from carbohydrate loading reflect the Warburg ef-                    the method and the reliability of the various findings
fect, which serves the CTCs and micrometastases more                      in this study. However, the study is too small to con-
than the patient [80]. In luminal cancers, the Warburg                    clude on preoperative preparation guidelines; fasting
pathway enzyme PFKFB4 acts as a molecular fulcrum that                    or carbohydrate loading. Moreover, the pilot nature of
couples sugar metabolism to transcriptional activation by                 the present study calls for validation in a larger study
stimulating the ER co-activator SRC-3 to promote aggres-                  with a long-term follow-up. Introducing a ketogenic
sive metastatic tumors [81].                                              diet as a third study arm may test out whether ketone
  The present study has several weak points. First, it                    bodies could wipe out the liberated CTCs and thus
is a post hoc explorative analysis of an RCT. There-                      improve survival.
fore, the various analyses are not sufficiently powered
regarding the various endpoints. In addition, tissue                      Conclusion
samples were not available for all patients, which re-                    Preoperative oral glucose loading increases systemic levels
duces the number of patients in the various analyses.                     of lactate and pyruvate, and tumor levels of glutathione and
Thus, this creates a greater risk of a type II error                      glutamate in luminal breast cancer patients. In fasting
than a type I error. Furthermore, the tissue analyses                     patients, the proapoptotic ketone bodies are increased.
were skewed towards patients with larger tumors.                          These biological changes may contribute to the survival
This could introduce systematic error in the analysis.                    differences observed between these two study groups.
However, tumor size was not included in the final                         Integrated Pathway Analysis (IPA) in serum revealed
Cox models in any survival analysis, indicating that                      activation of five major anabolic metabolic networks con-
this error was not strong enough to blur the effects                      tributing to proliferation and growth mainly through insu-
of the metabolites. Also, including diet recalls and                      lin signaling pathways.
Lende et al. BMC Cancer         (2019) 19:1183                                                                               Page 17 of 23

Appendix

Table 8 ROC – analysis with ‘Relapse / No relapse’ as dichotomous variable in ER+ patients
Test variable                                 AUC               95% CI              Sensitivity      Specificity     P           Threshold
                                                                                    (%)              (%)
S-lactate                                     0.769             0.609 – 0.929       57               88              0.024       56.9
S-pyruvate                                    0.765             0.541 – 0.989       71               86              0.026       12.5
Tumor-Glutathione                             0.711             0.485 – 0.938       100              66              0.260       1.09
S-preoperative Insulin                        0.724             0.554– 0.896        86               67              0.059       18.3 I.U./L
S-preoperative insulin c-peptide              0.735             0.566 – 0.903       86               67              0.049       1.22 nM

Table 9 Metabolites correlated to serum insulin C peptide (Pearson’s correlation) for all patients, carbohydrate group, and fasting
groups
Metabolite                          R All                   P Alla              R CH              P CHa            RF              P Fb
Lactate                             0.611
Lende et al. BMC Cancer (2019) 19:1183 Page 18 of 23 Table 10 Metabolites correlated to serum Insulin Growth Factor Binding Protein 3 (IGFBP3) (Pearson’s correlation) for all patients, carbohydrate group, and fasting groups Metabolite R (All) P (All)* R (CH) P (CH)* R (F) P (F)* Isoleucine 0.424 0.001 0.414 0.040 0.351 0.039 Glycoproteins 0.410 0.001 0.224 0.282 0.478 0.004 Asparagine 0.401 0.001 0.364 0.073 0.399 0.018 Leucine 0.393 0.002 0.107 0.612 0.440 0.008 Acetone 0.383 0.003 0.298 0.148 0.397 0.018 Lysine 0.378 0.003 -0.017 0.937 0.459 0.006 N.acetylgroups 0.342 0.007 -0.241 0.247 0.484 0.003 Phenylalanine 0.322 0.012 0.114 0.586 0.314 0.066 Propylene-Glycol 0.321 0.012 0.044 0.833 0.349 0.040 Isopropyl-alcohol 0.319 0.013 -0.079 0.706 0.434 0.009 Alanine 0.310 0.016 0.100 0.635 0.413 0.014 Acetoacetate 0.243 0.062 0.036 0.866 0.192 0.268 Threonine 0.206 0.114 -0.250 0.228 0.395 0.019 Valine 0.196 0.134 0.050 0.814 0.082 0.640 Acetate 0.180 0.169 0.079 0.707 0.066 0.707 Lactate -0.166 0.205 -0.347 0.090 0.207 0.232 pyruvate -0.164 0.211 -0.287 0.164 0.131 0.453 Methionine -0.158 0.228 -0.484 0.014 -0.066 0.704 Glycerol 0.137 0.296 -0.384 0.058 0.360 0.034 Proline -0.124 0.345 -0.358 0.079 0.004 0.982 Creatine 0.103 0.435 0.175 0.401 0.051 0.773 Creatinine 0.084 0.522 -0.189 0.365 0.146 0.403 Methanol 0.079 0.549 0.288 0.162 -0.110 0.528 Glutamine 0.075 0.569 -0.176 0.399 0.123 0.481 Glucose 0.055 0.678 0.007 0.972 0.186 0.285 Citrate 0.031 0.812 -0.052 0.804 0.134 0.442 Dimethylsulfone -0.005 0.967 -0.255 0.219 0.096 0.584 3-Hydroxybutyrate -0.001 0.993 -0.320 0.119 0.046 0.794 Abbreviations: CH Carbohydrate group, F Fasting group, P Pearson’s correlation p-value, R Pearson’s correlation R value. *Significant at p ≤ 0.01 after Benjamini-Hochberg correction for multiple testing **Significant at p ≤ 0.037 after Benjamini-Hochberg correction for multiple testing ***Significant at p ≤ 0.04 after Benjamini-Hochberg correction for multiple testing
Lende et al. BMC Cancer          (2019) 19:1183                                                                                     Page 19 of 23

Table 11 Metabolites correlated to serum Insulin Growth Factor 1 (IGF1) (Pearson’s correlation) for all patients, carbohydrate group,
and fasting groups
Metabolite                           R (All)                 P (All)a                R (CH)                   P (CH)a      R (F)            P (F)a
Methionine                           -0.318                  0.013                   -0.591                   0.002        -0.135           0.438
Isopropyl_alcohol                    -0.314                  0.015                   -0.318                   0.121        -0.330           0.052
Creatinine                           -0.302                  0.019                   -0.381                   0.061        -0.265           0.124
Proline                              -0.274                  0.034                   -0.465                   0.019        -0.095           0.585
Valine                               -0.251                  0.053                   -0.122                   0.563        -0.406           0.015
Propylene_Glycol                     -0.230                  0.077                   -0.159                   0.446        -0.291           0.089
Acetoacetate                         -0.230                  0.077                   -0.168                   0.421        -0.308           0.072
Methanol                             -0.218                  0.094                   -0.001                   0.996        -0.400           0.017
Acetone                              -0.184                  0.159                   -0.061                   0.772        -0.247           0.152
pyruvate                             -0.173                  0.186                   -0.271                   0.191        -0.179           0.303
Leucine                              -0.160                  0.222                   -0.090                   0.670        -0.208           0.231
3.Hydroxybutyrate                    -0.157                  0.230                   -0.231                   0.266        -0.114           0.515
Dimethylsulfone                      0.155                   0.238                   0.032                    0.880        0.245            0.155
Threonine                            -0.152                  0.248                   -0.397                   0.050        0.013            0.941
Lactate                              -0.139                  0.289                   -0.323                   0.115        -0.026           0.882
N.acetylgroups                       -0.131                  0.320                   -0.385                   0.057        -0.038           0.830
Glycerol                             -0.125                  0.342                   -0.430                   0.032        0.075            0.668
Lysine                               -0.118                  0.370                   -0.169                   0.418        -0.104           0.551
Glutamine                            0.100                   0.447                   -0.053                   0.801        0.257            0.136
Isoleucine                           -0.096                  0.468                   0.116                    0.582        -0.225           0.193
Acetate                              -0.092                  0.483                   0.031                    0.883        -0.148           0.395
Creatine                             -0.087                  0.507                   -0.002                   0.994        -0.154           0.378
Glycoproteins                        -0.081                  0.539                   -0.059                   0.779        -0.088           0.614
Citrate                              0.063                   0.631                   0.115                    0.584        0.014            0.936
Alanine                              -0.048                  0.717                   -0.070                   0.738        -0.048           0.783
Glucose                              0.017                   0.899                   -0.008                   0.969        0.079            0.652
Phenylalanine                        0.011                   0.931                   0.253                    0.222        -0.080           0.648
Asparagine                           -0.006                  0.962                   0.393                    0.052        -0.163           0.349
Abbreviations: CH Carbohydrate group. F Fasting group, P Pearson’s correlation p-value, R Pearson’s correlation R value.
a
 Significant at p ≤ 0.002 after Benjamini-Hochberg correction for multiple testing
Lende et al. BMC Cancer         (2019) 19:1183                                                        Page 20 of 23

Table 12 Results from Quantitative Metabolite Set Enrichment Analysis
Metabolic pathway                                Total Cmpd         Hits   Statistic Q        Raw p           FDR
                                                                           (Expected 1.613)
Amino Sugar Metabolism                           33                 3      24.50              0.000           0.000
Propanoate Metabolism                            42                 1      44.09              0.000           0.000
Valine, Leucine and Isoleucine Degradation       60                 4      31.60              0.000           0.000
Pyruvate Metabolism                              48                 3      28.66              0.000           0.000
Phenylalanine and Tyrosine Metabolism            28                 2      31.54              0.000           0.000
Fatty Acid Biosynthesis                          35                 3      25.58              0.000           0.000
Aspartate Metabolism                             35                 3      16.23              0.000           0.000
Ethanol Degradation                              19                 1      33.64              0.000           0.000
Tyrosine Metabolism                              72                 1      32.22              0.000           0.000
Butyrate Metabolism                              19                 1      32.22              0.000           0.000
Lysine Degradation                               30                 1      31.52              0.000           0.000
Biotin Metabolism                                8                  1      31.52              0.000           0.000
Carnitine Synthesis                              22                 1      31.52              0.000           0.000
Ammonia Recycling                                32                 3      14.09              0.000           0.000
Warburg Effect                                   58                 5      13.16              0.000           0.000
Cysteine Metabolism                              26                 1      27.23              0.000           0.000
Pyruvaldehyde Degradation                        10                 1      27.23              0.000           0.000
Urea Cycle                                       29                 3      13.38              0.000           0.000
Glutamate Metabolism                             49                 3      13.38              0.000           0.000
Gluconeogenesis                                  35                 3      17.45              0.000           0.000
Ketone Body Metabolism                           13                 2      17.24              0.000           0.000
Glycolysis                                       25                 2      13.61              0.000           0.000
Citric Acid Cycle                                32                 2      14.00              0.000           0.001
Glycine and Serine Metabolism                    59                 5      8.26               0.000           0.001
Alanine Metabolism                               17                 2      13.75              0.000           0.001
Transfer of Acetyl Groups into Mitochondria      22                 3      9.34               0.001           0.001
Glucose-Alanine Cycle                            13                 3      9.17               0.001           0.002
Pyrimidine Metabolism                            59                 1      12.64              0.005           0.008
Nicotinate and Nicotinamide Metabolism           37                 1      12.64              0.005           0.008
Purine Metabolism                                74                 1      12.64              0.005           0.008
Phenylacetate Metabolism                         9                  1      12.64              0.005           0.008
Threonine and 2-Oxobutanoate Degradation         20                 1      7.42               0.035           0.048
Methionine Metabolism                            43                 1      6.38               0.052           0.065
Betaine Metabolism                               21                 1      6.38               0.052           0.065
Spermidine and Spermine Biosynthesis             18                 1      6.38               0.052           0.065
Glycerolipid Metabolism                          25                 1      5.74               0.065           0.080
Galactose Metabolism                             38                 2      2.87               0.184           0.219
Arginine and Proline Metabolism                  53                 2      0.94               0.575           0.665
Glutathione Metabolism                           21                 1      0.27               0.692           0.743
Selenoamino Acid Metabolism                      28                 1      0.27               0.692           0.743
Tryptophan Metabolism                            60                 1      0.27               0.692           0.743
Sphingolipid Metabolism                          40                 1      0.00               0.969           0.969
Lactose Synthesis                                20                 1      0.00               0.969           0.969
Lactose Degradation                              9                  1      0.00               0.969           0.969
Lende et al. BMC Cancer (2019) 19:1183 Page 21 of 23
Abbreviations reasonable request and with permission from Stavanger Breast Cancer
ATP: Adenosine triphosphate; AUC: Area under the curve; BCSS: Breast cancer Research Group.
specific survival; CI: Confidence interval; CPMG: Carr–Purcell–Meiboom–Gill
spectra; CTC: Circulating tumor cell; EMT: Epithelial mesenchymal transition; Ethics approval and consent to participate
ER: Estrogen receptor; ERAS: Enhanced recovery after surgery; The RCT, which this study is based upon, was approved by the Regional
GSH: Glutathione, reduced form; GSSG: Glutathione, oxidized form; Ethics Committee (Accession number 2015/1445), Norwegian Centre for
HER2: Human epithelial growth factor receptor 2; HR: Hazard ratio; HR-MAS- Research Data (#20984), and The Norwegian Biobank Registry (#2239). An
MR: High-resolution magic angle spinning - magnetic resonance; informed consent form was signed by each patient. The trial was
IGF1: Insulin-like growth factor 1; IGF1R: Insulin-like growth factor 1 receptor; retrospectively registered at Clinicaltrials.gov (NCT03886389).
IGFBP3: Insulin-like growth factor 1 binding protein 3;
IHC: Immunohistochemistry; IPA: Ingenuity Pathway Analysis; IR: Insulin Consent for publication
receptor; LDH: Lactate dehydrogenase; MAI: Mitotic activity index; MCT- Not applicable.
1: Monocarboxylate transporter 1; MCT-4: Monocarboxylate transporter 4;
MR: Magnetic resonance; MRI: Magnetic resonance imaging;
Competing interests
MSEA: Metabolite Set Enrichment Analysis; NAD: Nicotinamide adenine
The authors declare that they have no competing interests.
dinucleotide; NADP: Nicotinamide adenine dinucleotide phosphate;
NOESY: One-dimensional 1H Nuclear Overhauser effect spectroscopy;
Author details
NSD: Norwegian Center for Research Data; OS: Overall survival; PHD: Pyruvate 1
Department of Breast & Endocrine Surgery, Stavanger University Hospital,
dehydrogenase; PLS: Partial least square; PLS-DA: Partial least square
Helse Stavanger HF, P.O. Box 8100, N-4068 Stavanger, Norway. 2Centre for
discriminant analysis; PPH3: Phosphorylated phosphohistone 3; PPP: Pentose
Cancer Biomarkers CCBIO, Department of Clinical Medicine, Faculty of
phosphate pathway; PR: Progesterone receptor; RCT: Randomized controlled
Medicine and Dentistry, University of Bergen, Jonas Lies vei 87, N-5012
trial; RFS: Relapse free survival; ROS: Reactive oxygen species; S: Serum; SRC-
Bergen, Norway. 3Department of Research, Stavanger University Hospital,
3: Steroid receptor co-activator 3; TCA-cycle: Tri carboxyl acid cycle
Helse Stavanger HF, P.O. Box 8100, N-4068 Stavanger, Norway. 4Department
of Pathology, Stavanger University Hospital, Helse Stavanger HF, P.O. Box
Acknowledgements 8100, N-4068 Stavanger, Norway. 5Department of Circulation and Medical
In memory of our late and beloved co-author Bianca van Diermen Hidle, Imaging, Norwegian University of Science and Technology, Trondheim,
who all too early became a victim of cancer. We are very much in debt to Norway. 6Department of Pathology, Helse Møre og Romsdal, Ålesund,
her legacy, and for her excellent work on the quantitative pathology analysis Norway. 7Department of Chemistry, Bioscience and Environmental
— provided also for this paper. Technology, University of Stavanger, P.O. Box 8600 Forus, N-4036 Stavanger,
Advices on the various statistical analyses given by Prof. Jan Terje Kvaløy at Norway. 8Department of Clinical Science, University of Bergen, Jonas Lies vei
University of Stavanger, Stavanger, Norway are very much appreciated. 87, N-5012 Bergen, Norway. 9Dr. Med. Jan Baak AS, Risavegen 66, N-4056
We would also like to thank the former department heads Dr. Ottar Bjerkeset Tananger, Norway.
and Dr. Kjell H. Kjellevold, who facilitated the study flow in the Department
of Surgery and the Department of Pathology, respectively. Received: 6 September 2019 Accepted: 21 November 2019
Authors’ contributions
THL included and operated on all of the patients, built the database, and References
contributed to statistical analyses and interpretation of data. MA contributed 1. Lundqvist A, Andersson E, Ahlberg I, Nilbert M, Gerdtham U. Socioeconomic
to analyses of the metabolite spectra of all serum and tissue samples and inequalities in breast cancer incidence and mortality in Europe-a systematic
also to the IPA analyses. TFB provided all the metabolomic analyses in her review and meta-analysis. Eur J Pub Health. 2016;26(5):804–13.
MR-imaging lab and interpreted the results of the metabolic spectra. AEV ob- 2. Yap YS, Lu YS, Tamura K, Lee JE, Ko EY, Park YH, Cao AY, Lin CH, Toi M, Wu
tained all of the blood samples and performed the laboratory analyses. IS J, Lee SC. Insights into breast Cancer in the east vs the west: a review.
contributed to the laboratory analyses. EG performed surgical pathological JAMA Oncol. 2019. https://doi.org/10.1001/jamaoncol.2019.0620.
analysis with histological grading and morphological analysis of the tumor. 3. Sun YS, Zhao Z, Yang ZN, Xu F, Lu HJ, Zhu ZY, Shi W, Jiang J, Yao PP, Zhu
NGE and SL provided detailed information of the micro RNA in the IPA ana- HP. Risk factors and preventions of breast Cancer. Int J Biol Sci. 2017;13(11):
lyses. LAA contributed with scientific support and advice. KJ performed the 1387–97.
IPA analyses. EAMJ contributed to the concept of the study, assessed the 4. Baum M, Demicheli R, Hrushesky W, Retsky M. Does surgery unfavourably
pathological parameters and scorings, and participated in interpreting the perturb the "natural history" of early breast cancer by accelerating the
data. HS contributed to the concept of the study, statistical analyses and in- appearance of distant metastases? Eur J Cancer. 2005;41(4):508–15.
terpretation of data. JPAB contributed to the concept of the study and the 5. Pukazhendhi G, Gluck S. Circulating tumor cells in breast cancer. J Carcinog.
analysis and interpretation of the data. All co-authors contributed to writing 2014;13:8. https://doi.org/10.4103/1477-3163.135578.
the manuscript and gave their final approval of the last version to be 6. Price TT, Burness ML, Sivan A, Warner MJ, Cheng R, Lee CH, Olivere L,
published. Comatas K, Magnani J, Kim Lyerly H, et al. Dormant breast cancer
micrometastases reside in specific bone marrow niches that regulate their
Authors’ information transit to and from bone. Sci Transl Med. 2016;8(340):340–73.
N.A. 7. Wangchinda P, Ithimakin S. Factors that predict recurrence later than 5
years after initial treatment in operable breast cancer. World J Surg Oncol.
2016;14(1):223.
Funding 8. Hanahan D, Weinberg RA. Hallmarks of cancer: the next generation. Cell.
The present study was funded by Marathon Oil, the Folke Hermannsen 2011;144(5):646–74.
Foundation, and the Inge Steenslands Foundation, Stavanger, Norway. The 9. Zhao H, Shen J, Moore SC, Ye Y, Wu X, Esteva FJ, Tripathy D, Chow WH.
funding covered the cost of preOp™, blood chemistry, and hormone Breast cancer risk in relation to plasma metabolites among Hispanic and
analysis. The funding bodies were not involved in the design of the study, African American women. Breast Cancer Res Treat. 2019. https://doi.org/10.
data collection, analysis, interpretation of the data, or in writing the 1007/s10549-019-05165-4.
manuscript. 10. Vander Heiden MG, Cantley LC, Thompson CB. Understanding the Warburg
effect: the metabolic requirements of cell proliferation. Science. 2009;
Availability of data and materials 324(5930):1029–33.
The data that support the findings of this study are available from Stavanger 11. Warburg OPK, Negelein E. Ueber den stoffwechhsel der tumoren. Biochem
Breast Cancer Research Group, but restrictions apply to the availability of Z. 1924;152(1):319–44.
these data, which were used under license for the current study and as such 12. Fernandez-de-Cossio-Diaz J, Vazquez A. Limits of aerobic metabolism in
are not publicly available. However, data are available from the authors upon cancer cells. Sci Rep. 2017;7(1):13488.Lende et al. BMC Cancer (2019) 19:1183 Page 22 of 23
13. Tran Q, Lee H, Park J, Kim SH, Park J. Targeting Cancer metabolism - 37. Hui S, Ghergurovich JM, Morscher RJ, Jang C, Teng X, Lu W, Esparza LA,
revisiting the Warburg effects. Toxicol Res. 2016;32(3):177–93. Reya T, Le Z, Yanxiang Guo J, et al. Glucose feeds the TCA cycle via
14. Hart CD, Tenori L, Luchinat C, Di Leo A. Metabolomics in breast Cancer: circulating lactate. Nature. 2017;551(7678):115–8.
current status and perspectives. Adv Exp Med Biol. 2016;882:217–34. 38. Faubert B, Li KY, Cai L, Hensley CT, Kim J, Zacharias LG, Yang C, Do QN,
15. Ljungqvist O. ERAS--enhanced recovery after surgery: moving evidence- Doucette S, Burguete D, et al. Lactate metabolism in human lung tumors.
based perioperative care to practice. JPEN J Parenter Enteral Nutr. 2014; Cell. 2017;171(2):358–71.
38(5):559–66. 39. Papavasiliou P, Fisher T, Kuhn J, Nemunaitis J, Lamont J. Circulating tumor
16. Lende TH, Austdal M, Varhaugvik AE, Skaland I, Gudlaugsson E, Kvaløy JT, cells in patients undergoing surgery for hepatic metastases from colorectal
Akslen LA, Søiland H, Janssen EAM, Baak JPA. Influence of pre-operative oral cancer. Proc (Baylor Univ Med Cent). 2010;23(1):11–4.
carbohydrate loading vs. standard fasting procedure on tumor proliferation 40. Braun S, Vogl FD, Naume B, Janni W, Osborne MP, Coombes RC, Schlimok
and clinical outcome in breast cancer patients — a randomized trial. BMC G, Diel IJ, Gerber B, Gebauer G, et al. A pooled analysis of bone marrow
Cancer. 2019;19(1):1076. micrometastasis in breast cancer. N Engl J Med. 2005;353(8):793–802.
17. Austdal M, Tangeras LH, Skrastad RB, Salvesen K, Austgulen R, Iversen AC, 41. de Boer M, van Dijck JA, Bult P, Borm GF, Tjan-Heijnen VC. Breast cancer
Bathen TF. First trimester urine and serum metabolomics for prediction of prognosis and occult lymph node metastases, isolated tumor cells, and
preeclampsia and gestational hypertension: a prospective screening study. micrometastases. J Natl Cancer Inst. 2010;102(6):410–25.
Int J Mol Sci. 2015;16(9):21520–38. 42. Bidard FC, Hajage D, Bachelot T, Delaloge S, Brain E, Campone M, Cottu P,
18. Giskeodegard GF, Madssen TS, Euceda LR, Tessem MB, Moestue SA, Bathen Beuzeboc P, Rolland E, Mathiot C, Pierga JY. Assessment of circulating
TF. NMR-based metabolomics of biofluids in cancer. NMR Biomed. 2018: tumor cells and serum markers for progression-free survival prediction in
e3927. https://doi.org/10.1002/nbm.3927. metastatic breast cancer: a prospective observational study. Breast Cancer
19. Euceda LR, Hill DK, Stokke E, Hatem R, El Botty R, Bièche I, Marangoni E, Res. 2012;14(1):R29.
Bathen TF, Moestue SA. Metabolic response to Everolimus in patient- 43. Liu D, Wang D, Wu C, Zhang L, Mei Q, Hu G, Long G, Sun W. Prognostic
derived triple-negative breast Cancer Xenografts. J Proteome Res. 2017; significance of serum lactate dehydrogenase in patients with breast cancer:
16(5):1868–79. a meta-analysis. Cancer Manag Res. 2019;11:3611–9.
20. Eilers PH. Parametric time warping. Anal Chem. 2004;76(2):404–11. 44. Liu L, He Y, Ge G, Li L, Zhou P, Zhu Y, Tang H, Huang Y, Li W, Zhang L.
21. Sitter B, Sonnewald U, Spraul M, Fjosne HE, Gribbestad IS. High-resolution Lactate dehydrogenase and creatine kinase as poor prognostic factors in
magic angle spinning MRS of breast cancer tissue. NMR Biomed. 2002;15(5): lung cancer: a retrospective observational study. PLoS One. 2017;12(8):
327–37. e0182168.
22. Benjamini Y, Yekutieli D. The control of the false discovery rate in multiple 45. Choi JS, Yoon D, Koo JS, Kim S, Park VY, Kim EK, Kim S, Kim MJ. Magnetic
testing under dependency. Ann Stat. 2001;29(4):1165–88. resonance metabolic profiling of estrogen receptor-positive breast cancer:
23. R: A language and environment for statistical computing. R Foundation for correlation with currently used molecular markers. Oncotarget. 2017;8(38):
Statistical Computing, Vienna, Austria. https://www.R-project.org/. 63405–16.
24. pls: Partial Least Squares and Principal Component Regression. R package 46. Dornier E, Rabas N, Mitchell L, Novo D, Dhayade S, Marco S, Mackay G,
version 2.7–1. https://cran.r-project.org/web/packages/pls/index.html Sumpton D, Pallares M, Nixon C, et al. Glutaminolysis drives membrane
25. Xia JMR, Sinelnikov IV, Broadhurst D, Wishart DS. MetaboAnalyst 2.0—a trafficking to promote invasiveness of breast cancer cells. Nat Commun.
comprehensive server for metabolomic data analysis. Nucleic Acids Res. 2017;8(1):2255.
2012;40(web server issue). https://doi.org/10.1093/nar/gks374. 47. Knox WE, Horowitz ML, Friedell GH. The proportionality of glutaminase
26. Mehmood TLK, Snipen L, Sæbø S. A review of variable selection methods in content to growth rate and morphology of rat neoplasms. Cancer Res.
partial least squares regression. Chemom Intell Lab Syst. 2012;118:62–9. 1969;29(3):669–80.
27. Egeland NG, Lunde S, Jonsdottir K, Lende TH, Cronin-Fenton D, Gilje B, 48. Estrela JM, Ortega A, Obrador E. Glutathione in cancer biology and therapy.
Janssen EA, Søiland H. The role of MicroRNAs as predictors of response to Crit Rev Clin Lab Sci. 2006;43(2):143–81.
Tamoxifen treatment in breast Cancer patients. Int J Mol Sci. 2015;16(10): 49. Franco R, Cidlowski JA. Apoptosis and glutathione: beyond an antioxidant.
24243–75. Cell Death Differ. 2009;16(10):1303–14.
28. Shaham O, Wei R, Wang TJ, Ricciardi C, Lewis GD, Vasan RS, Carr SA, 50. Lien EC, Lyssiotis CA, Juvekar A, Hu H, Asara JM, Cantley LC, Toker A.
Thadhani R, Gerszten RE, Mootha VK. Metabolic profiling of the human Glutathione biosynthesis is a metabolic vulnerability in PI (3) K/Akt-driven
response to a glucose challenge reveals distinct axes of insulin sensitivity. breast cancer. Nat Cell Biol. 2016;18(5):572–8.
Mol Syst Biol. 2008;4:214. 51. DeBerardinis RJ, Cheng T. Q's next: the diverse functions of glutamine in
29. Hou Y, Zhou M, Xie J, Chao P, Feng Q, Wu J. High glucose levels promote metabolism, cell biology and cancer. Oncogene. 2010;29(3):313–24.
the proliferation of breast cancer cells through GTPases. Breast Cancer 52. Fack F, Espedal H, Keunen O, Golebiewska A, Obad N, Harter PN,
(Dove Med Press). 2017;9:429–36. Mittelbronn M, Bahr O, Weyerbrock A, Stuhr L, et al. Bevacizumab treatment
30. Tang FY, Pai MH, Chiang EP. Consumption of high-fat diet induces tumor induces metabolic adaptation toward anaerobic metabolism in
progression and epithelial-mesenchymal transition of colorectal cancer in a glioblastomas. Acta Neuropathol. 2015;129(1):115–31.
mouse xenograft model. J Nutr Biochem. 2012;23(10):1302–13. 53. Liberti MV, Locasale JW. The Warburg effect: how does it benefit Cancer
31. Passarella S. Schurr a: l-lactate transport and metabolism in mitochondria of cells? Trends Biochem Sci. 2016;41(3):211–8.
Hep G2 cells-the Cori cycle revisited. Front Oncol. 2018;8:120. 54. Lee SY, Ju MK, Jeon HM, Lee YJ, Kim CH, Park HG, Han SI, Kang HS.
32. Scott MJ, Fawcett WJ. Oral carbohydrate preload drink for major surgery - Oncogenic metabolism acts as a prerequisite step for induction of Cancer
the first steps from famine to feast. Anaesthesia. 2014;69(12):1308–13. metastasis and Cancer stem cell phenotype. Oxidative Med Cell Longev.
33. Atkins RPVK, Constantin-Teodosiu D, Lobo DN, Greenhaff PL. Rates of 2018;2018:1027453.
skeletal muscle mitochondrial ATP production are reduced during 55. Klauber-DeMore N, Van Zee KJ, Linkov I, Borgen PI, Gerald WL. Biological
elective abdominal surgery in humans. J Am Coll Surg. behavior of human breast cancer micrometastases. Clin Cancer Res. 2001;
2011;2013:S59. 7(8):2434–9.
34. Varadan KKAR, Dimitru CT, Blackshaw E, Perkins AC, Greenhaff PL, Lobo DN. 56. Engstrom MJ, Opdahl S, Hagen AI, Romundstad PR, Akslen LA, Haugen OA,
Gastrointestinal surgery mediated increases in gut permeability and Vatten LJ, Bofin AM. Molecular subtypes, histopathological grade and
expression of IL6 and PDK4 mRNAs in quadriceps muscle may underpin the survival in a historic cohort of breast cancer patients. Breast Cancer Res
post-operative increase in whole-body insulin resistance in humans. J Am Treat. 2013;140(3):463–73.
Coll Surg. 2011;2013:S53. 57. Saunier E, Antonio S, Regazzetti A, Auzeil N, Laprevote O, Shay JW, Coumoul
35. Prando R, Cheli V, Buzzo P, Melga P, Ansaldi E, Accoto S. Blood lactate X, Barouki R, Benelli C, Huc L, Bortoli S. Resveratrol reverses the Warburg
behavior after glucose load in diabetes mellitus. Acta Diabetol Lat. 1988; effect by targeting the pyruvate dehydrogenase complex in colon cancer
25(3):247–56. cells. Sci Rep. 2017;7(1):6945.
36. Moore MC, Davis SN, Mann SL, Cherrington AD. Acute fructose 58. Blanquer-Rossello MD, Hernandez-Lopez R, Roca P, Oliver J, Valle A.
administration improves oral glucose tolerance in adults with type 2 Resveratrol induces mitochondrial respiration and apoptosis in SW620 colon
diabetes. Diabetes Care. 2001;24(11):1882–7. cancer cells. Biochim Biophys Acta Gen Subj. 2017;1861(2):431–40.You can also read