Microplastics in the New Zealand Environment - MDPI

 
CONTINUE READING
Microplastics in the New Zealand Environment - MDPI
processes
Article
Microplastics in the New Zealand Environment
Nur Atifah Mazlan † , Lilian Lin and Heon E. Park *

                                          Department of Chemical and Process Engineering, University of Canterbury, Christchurch 8041, New Zealand;
                                          nnuratifah@gmail.com (N.A.M.); lli121@uclive.ac.nz (L.L.)
                                          * Correspondence: heon.park@canterbury.ac.nz; Tel.: +64-3-369-0962
                                          † Current affiliation: Evyap Sabun (M) Sdn. Bhd., Pasir Gudang 81700, Johor, Malaysia.

                                          Abstract: It is a concern that microplastics have been discovered in the food sources and water that
                                          we consume. This research was to evaluate the methods to isolate microplastics from organisms and
                                          how much of the environment of New Zealand (NZ), which is one of the least polluted countries, is
                                          contaminated by microplastics. New Zealand green-lipped mussels (Perna canaliculus) are considered
                                          to be an important product in the NZ food industry. For this reason, the existence of microplastics in
                                          these were investigated. Tarakihi fish (Nemadactylus macropterus) consume food near the bottom of
                                          ocean, so this fish can be an indicator of the contamination of microplastics denser than water. In
                                          addition, bottled water, tap water and sea salt samples were also investigated. To isolate solid particles
                                          in an animal body, its tissues were chemically digested. It was found that 10% (w/w) potassium
                                          hydroxide (KOH) was a practical digestive protocol on biological tissues since polymers such as
                                          polyethylene terephthalate (PET), high-density polyethylene (HDPE), low-density polyethylene
                                          (LDPE), polypropylene (PP) and polystyrene (PS) are relatively resistant to KOH. Thus, treating
                                          tissues with KOH can be considered a viable method to remove tissues and isolate microplastics. Nile
                                          red was used to stain the plastic particles from the samples for visual inspection. Fourier-transform
                                          infrared spectrometry (FTIR) was performed to identify the particles. It was evaluated that all those
                                samples had traces of microplastics.
         
Citation: Mazlan, N.A.; Lin, L.; Park,    Keywords: microplastics; mussel; pollution; New Zealand environment; marine environment; tissue
H.E. Microplastics in the New             digestion; identifying plastic; polymer; NZ green-lipped mussel
Zealand Environment. Processes 2022,
10, 265. https://doi.org/10.3390/
pr10020265

Academic Editor: Maximilian               1. Introduction
Lackner                                        Plastic production increased exponentially since the 1950s to meet market demand
Received: 11 January 2022
                                          and will exceed one billion tons by 2050 [1–3]. This intense production creates severe
Accepted: 26 January 2022
                                          issues in the aquatic (such as freshwater or marine) environment. One specific issue is the
Published: 28 January 2022
                                          development and accumulation of microplastics (MPs), which are defined as particles that
                                          are smaller than 5 mm with no lower bound in size [4,5]. There are two types of MPs [5]:
Publisher’s Note: MDPI stays neutral
                                          one intentionally made to give certain functions in products such as personal care and the
with regard to jurisdictional claims in
                                          other degraded from larger products. The generation of these MPs from lost or discarded
published maps and institutional affil-
                                          plastic products in our marine environment is influenced by a combination of various
iations.
                                          factors. The dominant causes would be UV radiation and mechanical abrasion, which
                                          accelerate physical degradation of synthetic polymers [6]. The size of MPs became smaller
                                          and smaller over decades to sizes similar to planktons, which are the main food source for
Copyright: © 2022 by the authors.
                                          small marine organisms. The distribution of MPs in the aquatic environment is dependent
Licensee MDPI, Basel, Switzerland.        on the plastics’ density, which would either allow them to float or sink in water [7]. Plastics
This article is an open access article    in the ocean cause problems to marine life as they are sometimes mistaken as food [2].
distributed under the terms and           Organisms consuming other organisms containing plastics can lead to blockage of their
conditions of the Creative Commons        intestinal tracts or even death due to insufficient food uptake or harmful chemicals from
Attribution (CC BY) license (https://     plastics being ingested into their body [8].
creativecommons.org/licenses/by/               Currently, the major concern of MPs is the contamination to our marine environment
4.0/).                                    and seafood consumed by humans. In recent years, global researchers have reported

Processes 2022, 10, 265. https://doi.org/10.3390/pr10020265                                               https://www.mdpi.com/journal/processes
Microplastics in the New Zealand Environment - MDPI
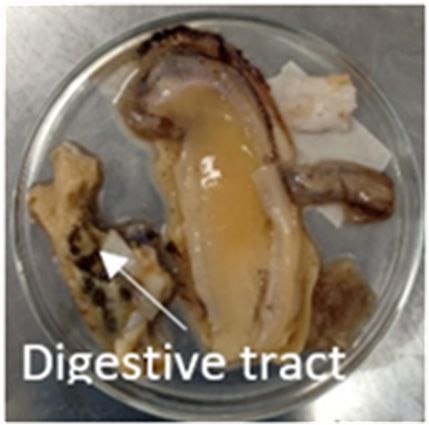
Processes 2022, 10, 265                                                                                            2 of 16

                          that MPs have been taken by aquatic organisms [9–15], such as fish-eating birds, marine
                          mammals, fish, mussels, sea cucumber, etc., and that it was found in sea salt [16–21], tap or
                          drinking water [20,22–25] and bottled water [26–30]. It was also found that New Zealand is
                          no longer a safe zone [31–33]. Microplastics can be associated with chemicals used during
                          polymer manufacture or absorbed contaminants and toxic substances. Even though it is
                          possible that some of those have already oozed out of the plastics to the environment, those
                          that are still presenting MPs may lead to adverse effects to human health [34]. These effects
                          can come from seafood consumption. There have been active and ongoing studies of MPs
                          contamination, but there is no current evidence that the intake of MPs can cause a negative
                          effect to human health [35] although there has been research on whether the accumulation
                          of MPs in gills of marine animals can affect their respiration rate [3]. Microplastics in
                          the digestive tracts can migrate into other tissues [36–39], and live tissues of cells can be
                          scanned using a CT scan to see the impact of leaching of MPs, but this is out of the scope of
                          this project, and we did not study this aspect further.
                                New Zealand (NZ) is encompassed by the sea and ocean, which means that there
                          are higher chances of the human population to be ingesting MPs through marine food
                          with low chances of biodegradation [9]. For this reason, NZ has been chosen as the
                          environment to identifying and quantifying MPs. Moreover, NZ has a relatively small
                          population (more than 5 million) and is an isolated country. For example, Sydney, the closest
                          and large overseas city, is more than 2000 km away from NZ. Thus, we can understand
                          how significantly global MPs contamination has developed by studying the level of MP
                          contamination in the NZ environment. As model environmental indicators, NZ water
                          sources, tarakihi fish (deep sea perch, Nemadactylus macropterus) and NZ green-lipped
                          mussels (Perna canaliculus) were studied. New Zealand’s main water supplies comes from
                          its lakes and rivers, which are connected to the main ocean. In addition, benthic and
                          planktonic organisms can be found in these environments. Therefore, NZ bottled water, tap
                          water and sea salt were also investigated to evaluate whether MPs exist in these resources.
                          Sea salt has been known to be healthier than chemically synthesized salt because it is natural.
                          However, if it is produced without filtering the sea water, it could contain particles in the
                          sea water including MPs. By taking this into consideration, we have selected sea salt as an
                          indicator of MP pollution [21]. Fish are commonly found in NZ, but the digestive system of
                          fish is not typically consumed by humans. Thus, the probability of MPs being taken via fish
                          consumption will be smaller. However, the presence of MPs in their digestive system may
                          result in MPs migrating into other tissues [36–39]. Hence, the digestive tracts of fish were
                          also chosen for studies. Mussels are commonly used as a water pollution biomarker [40]
                          since they are able to tolerate and accumulate large concentrations of pollutants. In addition,
                          they have high tolerance to temperature and salinity change [41]. In NZ, NZ green-lipped
                          mussels are widely produced along the country’s coastline and shore as it provides the
                          most ideal environment for their growth. The gills of mussels are located internally, and
                          function as an oxygen supplier. They collect food particles by utilizing its fine moving hairs
                          (cilia) and mucus sheet to transport to their mouth. Mussel consumption by humans can
                          create a pathway for MPs entering our human bodies because mussels are generally eaten
                          as a whole, including their digestive tract. In addition, NZ green-lipped mussel oil can
                          be extracted using supercritical fluids, which can lead to potential chemicals, if any, being
                          extracted from MPs, and this will eventually end up in the final product. NZ green-lipped
                          mussels are being suspended on lines in water during their farming, and thus, they live
                          on food floating in the water, implying that they tend to intake floating MPs. Due to all
                          these reasons, NZ green-lipped mussels were studied in this paper. Tarakihi fish are easily
                          found in NZ shore, especially relatively shallow water. Thus, it can be a representative fish
                          species. They live on a variety of organisms, such as crustaceans, shellfish, and worms,
                          which they take from the mud on the bottom of the ocean. This implies that they may
                          intake MPs that have settled on the bottom of the ocean, and thus, tarakihi fish can indicate
                          the number of MPs present on the bottom of ocean. Considering all these reasons, tarakihi
                          fish were studied in this project.
Processes 2022, 10, 265                                                                                            3 of 16

                               There are three remaining questions in regards to identifying and quantifying MPs in
                          animal bodies or the environment in NZ. Firstly, how can we isolate MPs from samples such
                          as biological tissues? In order to separate solid particles from biological tissues, researchers
                          use chemical digestion methods, i.e., decomposing biological tissues, assuming that the
                          methods do not alter plastics. We used two chemical digestion methods in this study.
                          Secondly, how do we identify plastics found in the animals or environment? Researchers
                          use spectroscopy such as Fourier-transform infrared spectroscopy (FTIR) to find finger-
                          prints of functional groups on polymeric chains over a wide spectral range. The principles
                          of this technique rely on the absorption or emission of the sample at a particular frequency
                          in relation to its vibrational motion of molecules. FTIR spectra illustrate peaks that rep-
                          resent the transitions between quantized vibrational energy states. These correspond to
                          a particular functional group. Aluminum oxide filters are often used in FTIR as the car-
                          rier material, which allows the MPs to be measured directly on the filter substrate [42].
                          Synthetic plastics found in the environment can be identified by matching the experimental
                          values to the literature values. Hence, we used FTIR in this study. Thirdly, does the isola-
                          tion/identification method alter MPs? It could be possible to only collect the contents in
                          the digestive tracts and analyze them without tissues, but MPs can migrate to other tissues
                          including intestine walls as mentioned above, which could contain other organisms. Thus,
                          it would still be favorable to digest samples chemically to remove biological tissues and
                          isolate MPs. However, we still need to ensure that such chemical digestion would not alter
                          the plastics. Hence, we have studied how chemical digestion methods alter plastics and
                          selected a method which has insignificant effects for MP isolation.

                          2. Materials and Methods
                          2.1. Model Microplastics Sample Preparation
                                To study the effect of digestion methods on the intactness or chemical resistance of
                          plastics, samples from five different types of plastics were collected from items such as
                          water bottles, spray bottles, films, lunchboxes and drinking cups, which were sourced lo-
                          cally. The samples collected were polyethylene terephthalate (PET), high-density polyethy-
                          lene (HDPE), low-density polyethylene (LDPE), polypropylene (PP) and polystyrene (PS),
                          respectively. Model MP samples were obtained through sanding them with 80-grit sand-
                          paper. Thereafter, these powder particles were sieved with a 500 µm sieve to obtain the
                          size required, which is below 500 µm. Each of the plastic powder (i.e., model MP) samples
                          were rinsed with deionized (DI) water and then oven-dried at temperature (T) = 50 ◦ C for
                          duration (t) = 2 h [43] and, subsequently, stored in clean glass vials.

                          2.2. Testing Model Microplastic Sample Resistance to Chemical Digestion Methods
                                Two different chemical digestion methods were used to test the chemical resistance of
                          each of the five types of plastics. The mass of each sample before and after applying each
                          method were measured. Each type of powdered plastic samples was prepared in triplicates.
                          The first method was applying 20 mL of 10% (w/w) potassium hydroxide (KOH) (Sigma
                          Aldrich, Burlington, MA, USA, ≥99.0%, ACS reagent grade) solution into five separate test
                          tubes. One type of plastic was placed into each test tube containing the solution. Every
                          test tube was swirled around to ensure that all samples were coated with the solution and
                          then left at T = 20 ◦ C for t = 24 h. Similarly, the second method was prepared by combining
                          10 mL each of 0.27 M potassium persulfate (K2 S2 O8 ) (Sigma Aldrich, Burlington, MA, USA,
                          90%, reagent grade) and 0.24 M sodium hydroxide (NaOH) (Ajax Finechem, Sydney, NSW,
                          Australia, 100% purity, analytical reagent grade) in five separate test tubes to make up
                          20 mL of solution. Each type of the plastic samples was placed in five separate test tubes,
                          swirled around, and then left in that solution for the same amount of time and temperature
                          as the first method. Next, samples from each method were vacuum filtered individually
                          using nylon membrane filters (0.8 µm pore size, 90 mm diameter, Sterlitech, Auburn, WA,
                          USA) and DI water in a glass flask. For every sample filtered, a fresh new filter was used.
Processes 2022, 10, x FOR PEER REVIEW                                                                                                            4 o

     Processes 2022, 10, 265     flask. For every sample filtered, a fresh new filter was used. The filters 4containing
                                                                                                              of 16

                                 samples were placed in labeled glass petri dishes then oven-dried again at T = 100 °C
                                 for t = 2 h [43].
                                  The filters containing the samples were placed in labeled glass petri dishes then oven-dried
                                  again at T = 100 ◦ C and for t = 2 h [43].
                                 2.3. NZ Green-Lipped Mussels and Tarakihi Fish Sample Preparation
                                  2.3. NZ
                                        RawGreen-Lipped Mussels and
                                             NZ green-lipped         Tarakihi Fish
                                                                   mussels     andSample
                                                                                    tarakihiPreparation
                                                                                               fish specimens were obtained from
                                 local Raw
                                         supermarkets   as these
                                             NZ green-lipped       willand
                                                               mussels   be tarakihi
                                                                             the direct
                                                                                     fish source  of were
                                                                                          specimens   consumption     for the
                                                                                                           obtained from   consumers.
                                                                                                                              local   Sp
                                  supermarkets   as these will be the direct  source of consumption    for consumers.
                                 imens were stored in a freezer and removed from the freezer one hour prior to apply   Specimens
                                  were stored in a freezer and removed from the freezer one hour prior to applying the
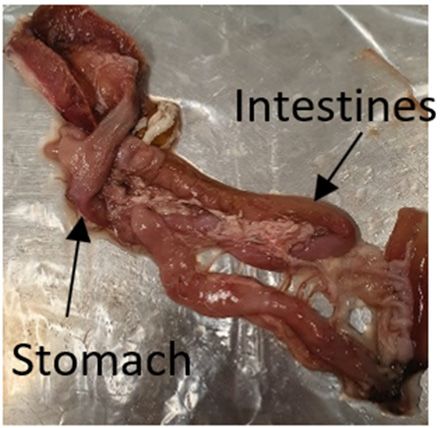
                                 the   chemical digestion methods. Each source was dissected to collect their digestive tra
                                  chemical digestion methods. Each source was dissected to collect their digestive tracts,
                                 i.e., stomach and intestines. Figure 1 illustrates the digestive tracts retrieved from the
                                  i.e., stomach and intestines. Figure 1 illustrates the digestive tracts retrieved from the NZ
                                 green-lipped    mussel
                                  green-lipped mussel     and
                                                        and     tarakihi
                                                            tarakihi  fish.fish.

                                                (a)                                (b)
                                         1. Digestive
                                  Figure 1.
                                 Figure     Digestive tracts from
                                                        tracts    (a) NZ
                                                                from   (a)green-lipped mussel and
                                                                           NZ green-lipped        (b) tarakihi
                                                                                              mussel    and (b)fish, obtained
                                                                                                                  tarakihi    at Tobtained
                                                                                                                            fish, = room at T =
                                  temperature.
                                 room temperature.
                                        Nine NZ green-lipped mussels were dissected to retrieve their digestive tracts, and
                                        Nine NZ green-lipped
                                  the tissue-digestion      method was   mussels      were dissected
                                                                             implemented                   to retrieve
                                                                                               in triplicates.            their digestive
                                                                                                                As for tarakihi   fish, three tracts, a
                                 the  tissue-digestion
                                  of those   were dissected   method
                                                                 to obtainwas    implemented
                                                                              their                  in triplicates.
                                                                                     digestive tracts.    Each type of Asbiological
                                                                                                                           for tarakihi
                                                                                                                                     samplefish, three
                                 those   wereinto
                                  was placed     dissected
                                                     separatetoconical
                                                                    obtain     theirand
                                                                           flasks,    digestive     tracts. Each type
                                                                                         the first tissue-digestion        of biological
                                                                                                                      method   was applied,  sample w
                                  where   40–60   mL  of  10%   (w/w)    KOH     (>3 times   the volume    of digestive
                                 placed into separate conical flasks, and the first tissue-digestion method was appli    tracts) was  added
                                  into each flask. These flasks were covered with aluminum foil and left at T = 20 ◦ C for
                                 where     40–60 mL of 10% (w/w) KOH (>3 times the volume of digestive tracts) was add
                                  t = 24 h [44]. The next day, each of the samples in the conical flasks were placed on a hot
                                 into  each   flask. These flasks were covered with aluminum foil and left at T = 20 °C for
                                  plate at T = 100 ◦ C for t = 2 h. Subsequently, DI water at T = 80 ◦ C was added into the
                                 24  h [44].
                                  flasks.  TheThe   nextinday,
                                               content            each of
                                                             the flasks   was the  samples
                                                                                swirled   and in  the conical
                                                                                               immediately       flasksfiltered
                                                                                                              vacuum      were placed     on a hot pl
                                                                                                                                  with nylon
                                 atmembrane
                                    T = 100 °C     for (0.8
                                               filters  t = 2µm
                                                              h. pore
                                                                  Subsequently,
                                                                        size, 90 mmDI       water Sterlitech,
                                                                                        diameter,    at T = 80 °C   was added
                                                                                                                 Auburn,   WA, USA)intoand
                                                                                                                                         thea flasks. T
                                  glass filtration
                                 content    in the system.
                                                    flasks was The swirled
                                                                    nylon filtersandfor  every samplevacuum
                                                                                      immediately         were constantly
                                                                                                                    filteredreplaced   whenmembr
                                                                                                                              with nylon
                                  clogging
                                 filters     occurred,
                                          (0.8  μm pore   andsize,
                                                               any sample
                                                                      90 mmremaining
                                                                                 diameter,  on Sterlitech,
                                                                                                the filter wasAuburn,
                                                                                                                carefully Washington,
                                                                                                                          poured back into   USA) an
                                  the flask. Before replacement, DI water was poured onto the filter to fully rinse any of the
                                 glass filtration system. The nylon filters for every sample were constantly replaced wh
                                  chemicals that may remain on the filter paper. Then, the filter paper was placed in a clean
                                 clogging
                                  and labeledoccurred,
                                                 glass petriand   any
                                                              dish.     sample
                                                                      Once   pouringremaining      on the
                                                                                        was finished,       filter was
                                                                                                         additional      carefully
                                                                                                                     DI water   at T =poured
                                                                                                                                        80 ◦ C back i
                                 the  flask.  Before    replacement,        DI   water    was   poured     onto  the  filter
                                  was poured into the flask and swirled around. This was then drained into the filtration    to  fully  rinse any of
                                 chemicals     that may
                                  system to ensure     that remain      on were
                                                             all residues    the filter
                                                                                   fully paper.
                                                                                          retrieved.Then, the filter paper was placed in a cl
                                        After filtration,  the filter papers    containing
                                 and labeled glass petri dish. Once pouring was finished,    the residues  in clean and labeled
                                                                                                                  additional    DIglass  petriat T = 80
                                                                                                                                     water
                                  dishes  were  oven   dried  at  T =  50 ◦ C for t = 2 h. After the drying process, these samples were
                                 was poured into the flask and swirled around. This was then drained into the filtrat
                                  stored for analysis. The analysis techniques implemented were optical visualization [45]
                                 system to ensure that all residues were fully retrieved.
                                  and Fourier-transform infrared spectrometry (FTIR) [45].
                                       After filtration, the filter papers containing the residues in clean and labeled gl
                                 petri dishes
                                  2.4. Nile     wereSolution
                                            Red Stock   oven dried   at T = 50 °C for t = 2 h. After the drying process, these samp
                                                                Preparation
                                 were Nile
                                        stored
                                             red for analysis.
                                                 stock  solution The
                                                                 with analysis   techniques
                                                                       a concentration of 1 g/Limplemented
                                                                                                was produced were     optical
                                                                                                               in an amber    visualizat
                                                                                                                           glass
                                  container   under  a fume   hood  by adding  Nile  red (Sigma
                                 [45] and Fourier-transform infrared spectrometry (FTIR) [45].   Aldrich, Burlington,  MA, USA,
                                  100% purity, microscopy grade) solids to acetone (ASCC, Auckland, New Zealand, 99.5%
                                  purity, industrial grade) solution. This was then stored in a refrigerator at T = 4 ◦ C. The
                                 2.4. Nile Red Stock Solution Preparation
                                  amount of stock solution produced was dependent on the frequency of this solution used
                                       Nile itred
                                  to ensure       stock
                                                was      solution
                                                    sufficient      with aallconcentration
                                                               to perform     experiments. of 1 g/L was produced in an amber gl
                                 container under a fume hood by adding Nile red (Sigma Aldrich, Burlington, Massac
                                 setts, USA, 100% purity, microscopy grade) solids to acetone (ASCC, Auckland, New Z
                                 land, 99.5% purity, industrial grade) solution. This was then stored in a refrigerator at
Processes 2022, 10, 265                                                                                             5 of 16

                          2.5. Water Samples Preparation
                                Bottled water, tap water and sea salt water samples were prepared. Sea salt and 1.5 L
                          bottled water were purchased from a local supermarket. Tap water of 5 L was retrieved
                          from the laboratory at the University of Canterbury. This was obtained after removing the
                          screen at the tip of the tap. Sea salt water was produced in the laboratory by dissolving 400 g
                          of sea salt into 5 L of DI water to obtain a concentration of 8% (w/w) [20]. All these samples
                          were poured in clean capped glass bottles, which were washed with DI water. For every
                          1 L of each water sample, 10 mL of 1 g/L Nile red stock solution was added and mixed
                          well. These samples were left sitting at T = 20 ◦ C for at least t = 30 min [46]. Subsequently,
                          all samples were rinsed and vacuum filtered individually using nylon membrane filters
                          (0.8 µm pore size, 90 mm diameter, Sterlitech, Auburn, WA, USA). For every water sample,
                          one filter paper was used for each sample. Each filter was stored in labeled and clean petri
                          dishes separately until optical visualization and Fourier-transform infrared spectrometry
                          (FTIR) analysis were implemented.

                          2.6. Validation of Nile Red Staining
                               There is a tendency that Nile red will stain biogenic materials such as lipids and chitins,
                          which will result in an overestimation of the synthetic polymer in the samples collected.
                          For this reason, each individual sample collected on filter paper were placed into a discrete
                          and clean capped bottle where 20 mL of 3% hydrogen peroxide (H2 O2 ) (Ajax Finechem,
                          Sydney, NSW, Australia, 35%) was added into it. These samples were placed in an oven
                          at T = 60 ◦ C for t = 1 h, thereafter at T = 100 ◦ C for another t = 7 h [47]. The solution in
                          each flask was filtered with new nylon membrane filters (0.8 µm pore size, 90 mm diameter,
                          Sterlitech, Auburn, WA, USA). The filters were replaced constantly to minimize the effects
                          of clogging. Additionally, the flask was rinsed with DI water to remove any content that
                          would still be in the flask. The new filter paper containing the samples were stored in
                          separate petri dishes until optical visualization and FTIR analysis were implemented.

                          2.7. Optical Microscope Analysis
                               A portion of Nile red stock solution was diluted using n-hexane solution (Ajax
                          Finechem, Sydney, NSW, Australia, 99.5% purity, laboratory grade) to obtain the desired
                          concentration of 5 mg/L. For every sample obtained in Sections 2.3 and 2.5, these were
                          stained with 200 µL of 5 mg/L Nile red solution. Subsequently, every filter was washed
                          with 100 µL of n-hexane and then air dried for approximately t = 5 min before examining
                          them individually under a fluorescence coupled optical microscope (DMIL with Leica
                          DFC490 camera, Leica, Wetzlar, Germany). Each filter was analyzed in non-fluorescent
                          mode at 15× magnification to detect possible MPs. Any detected Nile red stained MPs
                          were analyzed in fluorescent mode at optimal 120× magnification. In addition, for every
                          particle identified in each type of sample, two parallel lines were drawn at the top and
                          bottom of the particle image. The largest distance that incorporates the particle in between
                          those two lines is the maximum Feret diameter, which is considered the mean size of the
                          particle.

                          2.8. Fourier-Transform Infrared Spectroscopy
                              All samples were further analyzed using Fourier-transform infrared spectrometer
                          (FTIR, Bruker ALPHA, Billerica, MA, USA) by comparing their spectral data with peak
                          wavenumbers from literature [48–50]. The carrier material used was aluminum oxide filters,
                          on which MPs were directly detected.

                          2.9. Statistical Analysis
                               Student t-test analysis was performed to reflect whether the mass change of MPs due
                          to chemical digestion methods were statistically significant. A paired sample t-test with
                          one tail and trusted p value < 0.05 was used and evaluated by Microsoft Excel Professional
                          Plus 2019.
Plus
                                             2.9.2019.
                                                  Statistical Analysis
                                                   Student t-test analysis was performed to reflect whether the mass change of MPs due
                                          3. Results and Discussion
                                             to chemical digestion methods were statistically significant. A paired sample t-test with
                                          3.1.one
                                               Size ofand
                                                  tail Model  Microplastic
                                                          trusted  p value < Samples
                                                                             0.05 was used and evaluated by Microsoft Excel Professional
Processes 2022, 10, 265                                                                                                             6 of 16
                                             Plus  2019.
                                                The mean Feret diameter of model polyethylene terephthalate (PET) sample, i.e., the
                                          average size of the particles produced in Section 2.1 was selected and measured as a
                                             3. Results and Discussion
                                          model.   It wasand
                                              3. Results    assumed    that the obtained mean size of PET would be the same for the other
                                                                Discussion
                                             3.1. Size of Model Microplastic Samples
                                          model    microplastic
                                              3.1. Size             samples made
                                                        of Model Microplastic  Samplesby the same method in Section 2.1. Thus, it was as-
                                          sumed Thethat mean
                                                         the   Feret particle
                                                              mean   diametersize
                                                                                of model
                                                    The mean Feret diameter of model
                                                                                          polyethylene
                                                                                    for other             terephthalate
                                                                                                plastic samples
                                                                                           polyethylene             would
                                                                                                           terephthalate
                                                                                                                         (PET) sample,
                                                                                                                            be the
                                                                                                                          (PET)    samei.e.,
                                                                                                                                sample,    orthe
                                                                                                                                         i.e., close to
                                                                                                                                               the
                                             average
                                          the average
                                              PET samplesize of  the particles produced    in  Section  2.1  was  selected and  measured    as   a
                                                        size ofof 0.16
                                                                the    ± 0.07produced
                                                                    particles  mm. Figure     2 depicts
                                                                                        in Section        theselected
                                                                                                    2.1 was    size distribution
                                                                                                                      and measuredof PET   particles.
                                                                                                                                     as a model.
                                                    model. It was assumed that the obtained mean size of PET would be the same for the other
                                                     It was assumed that the obtained mean size of PET would be the same for the other model
                                                    model microplastic samples made by the same method in Section 2.1. Thus, it was as-
                                                     microplastic
                                                       50 that the samples made by the same method in Section 2.1. Thus, it was assumed that
                                                    sumed            mean particle size for other plastic samples would be the same or close to
                                                     the mean particle size for other plastic samples would be the same or close to the PET
                                                    the PET sample of 0.16 ± 0.07 mm. Figure 2 depicts the size distribution of PET particles.
                                                     sample
                                                       40    of 0.16 ± 0.07 mm. Figure 2 depicts the size distribution of PET particles.
                                           Particle Count

                                                                             50
                                                               30
                                                                             40
                                                            Particle Count

                                                               20
                                                                             30
                                                               10
                                                                             20
                                                                      0
                                                                             100     0.05     0.1        0.15   0.2     0.25   0.3         0.35
                                                                              0                     Feret Diameter (mm)
                                                     0       0.05     0.1      0.15     0.2     0.25     0.3     0.35
                                          Figure 2. Particle Feret diameter  andDiameter
                                                                          Feret   count of (mm)
                                                                                           polyethylene terephthalate (PET). Mean Feret diam-
                                          eter of PET particles were found to be 0.16 ± 0.07 mm.
                                               Figure 2. Particle Feret diameter and count of polyethylene terephthalate (PET). Mean Feret diameter
                                             Figure 2. Particle Feret diameter and count of polyethylene terephthalate (PET). Mean Feret diam-
                                               of PET  particles were found   to beto0.16 ± 0.07 mm.
                                          3.2.eter
                                                Microplastic
                                                   of PET       Mass
                                                          particles    Analysis
                                                                    were   found    before  and
                                                                                      be 0.16    after
                                                                                              ± 0.07   Chemical Treatment
                                                                                                     mm.
                                              3.2. Microplastic
                                                About   20 g ofMass modelAnalysis
                                                                              MP before    and after
                                                                                    particles   wasChemical
                                                                                                      collectedTreatment
                                                                                                                  to make each sample. The mass of
                                             3.2. Microplastic Mass Analysis before and after Chemical Treatment
                                                   Aboutbefore
                                          each sample       20 g of and
                                                                      model    MP applying
                                                                            after    particles was
                                                                                                 the collected
                                                                                                      chemicaltodigestion
                                                                                                                   make eachmethods
                                                                                                                              sample. The  wasmass    of
                                                                                                                                                  measured.
                                              each About
                                                    sample 20before
                                                               g of model
                                                                        and    MP particles
                                                                              after  applying  was
                                                                                                the  collected
                                                                                                     chemical  to make each
                                                                                                                digestion    sample.
                                                                                                                          methods     was The  mass of
                                                                                                                                             measured.
                                          Figures 3 and 4 illustrate the results for the first chemical digestion method, i.e., 10% (w/w)
                                             each  sample
                                              Figures    andbefore
                                                      3hydroxide       and after
                                                               4 illustrate         applying
                                                                             the results       thefirst
                                                                                          for the   chemical   digestion
                                                                                                         chemical         methods
                                                                                                                  digestion method,was i.e.,measured.
                                                                                                                                             10%  (w/w)
                                          potassium
                                             Figures  3 and
                                                                        (KOH)
                                                             4 illustrate
                                                                                   and
                                                                            the results
                                                                                        second
                                                                                         for the
                                                                                                   chemical    digestion
                                                                                                  first chemical  digestion
                                                                                                                           method,
                                                                                                                            method,
                                                                                                                                       i.e.,
                                                                                                                                       i.e.,
                                                                                                                                              0.27(w/w)
                                                                                                                                                   M potas-
                                              potassium   hydroxide      (KOH)    and second    chemical   digestion method, i.e., 0.27   M10%
                                                                                                                                             potassium
                                          sium   persulfate
                                             potassium         (K2S2O8(KOH)
                                                          hydroxide       ) and 0.24
                                                                                   and M    sodium
                                                                                        second        hydroxide
                                                                                                  chemical          (NaOH),
                                                                                                             digestion       respectively.
                                                                                                                       method,   i.e., 0.27 M potas-
                                              persulfate (K  2 S2 O8 ) and 0.24 M sodium hydroxide (NaOH), respectively.
                                             sium persulfate (K2S2O8) and 0.24 M sodium hydroxide (NaOH), respectively.
                                       a) PET                                                                          d) PP
                  24
                                          a) PET                                   b) HDPE           c) LDPE         d) PP
                                                                                                                         *
                  22           24                                                                                                       e) PS
                                                                                    b) HDPE          c) LDPE            *
      Mass (mg)

                  20           22                                                     *                                              e) PS
                                                                                                                                             *
                   Mass (mg)

                  18           20                                                         *                                            *
                  16           18
                  14           16
                               14
                  12
                               12
                  10           10   Before    After Before
                                           After
                                       Before        BeforeAfter
                                                            After                               Before After
                                                                                                Before After       BeforeAfter
                                                                                                                  Before          Before
                                                                                                                          After Before    After
                                                                                                                                       After
                                                       Figure 3. Mass change of five different types of model plastics and paired t-test analysis for each
                                          Figure
                                              Figure3. Mass
                                                        3. Masschange
                                                                 changeofoffive
                                                                            five different     typesofofmodel
                                                                                  different types        model   plastics
                                                                                                              plastics  andand    paired
                                                                                                                              paired   t-testt-test analysis
                                                                                                                                               analysis        for each
                                                                                                                                                        for each
                                               model microplastic sample of three repeats with 10% (w/w) potassium hydroxide (KOH) solution
                                          model     microplastic    sample
                                              model microplastic sample       of three     repeats with   10%  (w/w)    potassium      hydroxide
                                                                               of three repeats with 10% (w/w) potassium hydroxide (KOH) solution     (KOH)     solution
                                               at V = 20 mL and T = 20 ◦ C for t = 24 h. The mean mass loss percentage (shown as short black bar)
                                              at V  =  20 mL   and T = 20 °C  for  t = 24  h. The mean   mass loss  percentage     (shown
                                          at V = 20 mL and T = 20 °C for t 24 h. The mean mass loss percentage (shown as short black bar)     as short black bar)
                                               for (a)PET,
                                                        PET, (b) HDPE,
                                                                  HDPE, (c)
                                                                         (c) LDPE,
                                                                             LDPE, (d) (d) PP
                                                                                            PP and
                                                                                               and (e) PS
                                                                                                       PS were 5.0,
                                                                                                                5.0, 6.7,
                                                                                                                     6.7, 2.8, 9.3
                                                                                                                               9.3 and   5.0%,   respectively.  Error
                                          for for
                                               (a) (a)
                                                    PET, (b)(b)HDPE, (c)    LDPE, (d)       PP and(e)
                                                                                                    (e) PSwere
                                                                                                           were 5.0,      2.8,2.8,
                                                                                                                        6.7,        and  5.0%,5.0%,
                                                                                                                                    9.3 and      respectively.
                                                                                                                                                      respectively.
                                               bars are
                                              Error   barsstandard  deviation   ± mean      of experimental values.    SolidSolid
                                                                                                                              points   show    the actual  values of
                                          Error   bars   areare standard
                                                              standard    deviation
                                                                         deviation      ±± mean
                                                                                           meanofofexperimental
                                                                                                    experimental  values.
                                                                                                                     values.        points
                                                                                                                                Solid       show
                                                                                                                                        points      the actual
                                                                                                                                                  show   the actual
                                                       each datum, and the long thin black lines are the connection of the same samples before and after the
                                                       treatment. * = p < 0.05.
method, respectively, i.e., the number of plastics in animal tissues will be less underesti-
                             mated by the first method than the second method. In past research, the use of KOH is
                             proven to be more useful in the studies of plastic ingestion by marine animals as well
                             [52,53]. Moreover, there have been few studies on the use of K2S2O8 and NaOH. Hence,
Processes 2022, 10, 265      the first method was chosen to be applied to digest tarakihi fish and NZ green-lipped
                                                                                                                7 of 16
                             mussel tissues to isolate solid particles in this study.

                                                                                         d) PP
                          a) PET                                  c) LDPE
                  24                                                                        *                  e) PS
                             *
                  22                                                                                             **
      Mass (mg)

                  20
                  18                        b) HDPE
                  16                             **
                  14
                  12
                  10
                       Before After      Before After         Before After          Before After          Before After
                                   Figure 4. Mass change of five different types of model plastics and paired t-test analysis for each
                             Figure 4. Mass change of five different types of model plastics and paired t-test analysis for each
                                 model microplastic sample of three repeats in V = 10 mL with 0.27 M potassium persulfate (K2 S2 O8 )
                             model microplastic sample of three repeats in V = 10 mL with 0.27 M               potassium persulfate
                                 and V = 10 mL of 0.24 M sodium hydroxide (NaOH) solution at T = 20 ◦ C for t = 24 h. The mean mass
                             (K2S2O8) and V = 10 mL of 0.24 M sodium hydroxide (NaOH) solution at T = 20 °C for t = 24 h. The
                                 loss percentage (shown as short black bar) for (a) PET, (b) HDPE, (c) LDPE, (d) PP and (e) PS were
                             mean loss percentage (shown as short black bar) for (a) PET, (b) HDPE, (c) LDPE, (d) PP and (e) PS
                                 10.7, 13.2, 5.2, 15.1 and 11.4%, respectively. Error bars are standard deviation ± mean of experimental
                             were 10.7, 13.2, 5.2, 15.1 and 11.4%, respectively. Error bars are standard deviation ± mean of ex-
                                 values. Solid points show the actual values of each datum, and the long thin black lines are the
                             perimental values. Solid points show the actual values of each datum, and the long thin black lines
                                 connection of the same samples before and after the treatment. * = p < 0.05, ** = p < 0.01.
                             are the connection of the same samples before and after the treatment. * = p < 0.05, ** = p < 0.01.
                                        For the application of the first method shown in Figure 3, we can be 95% confident
                             3.3. based
                                  Optical
                                        onMicroscope
                                          the statistical analysis (p < 0.05) that the mass of all the plastic types decreased
                                  after
                                    Thethe   treatment
                                          particles        except for
                                                       collected       PET
                                                                   after  theand   LDPE. For
                                                                               filtration       the application
                                                                                            process                of the second
                                                                                                      of NZ green-lipped           method
                                                                                                                                mussel    diges-
                                  illustrated  in Figure   4, we can be  95%  confident    that the mass  of PET  and
                             tive tracts, tarakihi fish digestive tracts, sea salt water, tap water and bottled water   PP  decreased  afterwere
                                  the treatment. For HDPE and PS, we can be 99% confident based on the statistical analysis
                             analyzed under an optical microscope first. This analysis was to investigate the potential
                                  (p < 0.01). LDPE was found to be the most resistant to both chemical (base) treatments.
                             MPsThis that  were successfully stained with Nile red dye. Figure 5 shows three different
                                        implies that LDPE is more stable than HDPE in such a basic environment. At a glance,
                             shapes     of solidhave
                                  this should      particles   stained
                                                        been the         by Nile
                                                                  other way   around red:considering
                                                                                          fibers, fragments
                                                                                                       the higherand   beads, obtained
                                                                                                                    crystallinity in HDPEfrom
                             the than
                                  samples     under     the  optical  microscope.       Fibers  are generally    from    fabric
                                         LDPE and having very few tertiary carbons, which lead to fast thermal degradations.    such   as mate-
                             rialsHowever,
                                     coming LDPE
                                               from islaundry
                                                         also knownwashing     and resistance
                                                                      for its good    fishing nets,   while
                                                                                                 to bases  andfragments
                                                                                                               acids and alsoareshows
                                                                                                                                  from less
                                                                                                                                         broken
                             down     plastics.
                                  weight          Beads
                                           loss due        are formed
                                                       to fungal         due
                                                                  isolates  [51]toimplying
                                                                                   either plastics   abrasion
                                                                                             resistant           in the
                                                                                                        to chemical       environment
                                                                                                                      degradation.        or are
                                                                                                                                      Thus,
                                  the  result is not  surprising   even  though    the  exact reason  is not known.
                             from certain applications utilizing microbeads, such as toothpaste, cleansing scrubs,
                             shower gel,The average
                                              etc. It ismass  loss was
                                                         observed       obtained
                                                                     that           to be 5.8had
                                                                           the particles      anda11%
                                                                                                    sizefor the first
                                                                                                          range   fromand10‒100
                                                                                                                           secondμm.
                                                                                                                                   method,
                                  respectively, i.e., the number of plastics in animal tissues will be less underestimated by
                                  the first method than the second method. In past research, the use of KOH is proven to be
                                  more useful in the studies of plastic ingestion by marine animals as well [52,53]. Moreover,
                                  there have been few studies on the use of K2 S2 O8 and NaOH. Hence, the first method was
                                  chosen to be applied to digest tarakihi fish and NZ green-lipped mussel tissues to isolate
                                  solid particles in this study.

                                   3.3. Optical Microscope
                                        The particles collected after the filtration process of NZ green-lipped mussel digestive
                                   tracts, tarakihi fish digestive tracts, sea salt water, tap water and bottled water were
                                   analyzed under an optical microscope first. This analysis was to investigate the potential
                                   MPs that were successfully stained with Nile red dye. Figure 5 shows three different
                                   shapes of solid particles stained by Nile red: fibers, fragments and beads, obtained from the
                                   samples under the optical microscope. Fibers are generally from fabric such as materials
                                   coming from laundry washing and fishing nets, while fragments are from broken down
                                   plastics. Beads are formed due to either plastics abrasion in the environment or from certain
                                   applications utilizing microbeads, such as toothpaste, cleansing scrubs, shower gel, etc. It
                                   is observed that the particles had a size range from 10–100 µm.
Processes 2022, 10, x FOR PEER REVIEW                                                                                                                         8 of 16
 Processes 2022,10,
 Processes2022,  10,265
                     x FOR PEER REVIEW                                                                                                                         88 of 16
                                                                                                                                                                     16

                                 Figure 5. Images of fibers, fragments and bead particles under an optical microscope. The color of
                                  Figure
                                  Figure
                                 each    5. Images
                                         5. Images
                                      particle      of fibers,
                                                    of
                                               has been        fragments
                                                         removed               bead particles under
                                                                          and purposes.
                                                                   for clarity                under an
                                                                                                    an optical
                                                                                                       optical microscope.
                                                                                                               microscope. The
                                                                                                                           Thecolor
                                                                                                                               colorof
                                                                                                                                     of
                                  each particle
                                  each particle has
                                                hasbeen
                                                    beenremoved
                                                          removedforforclarity
                                                                        claritypurposes.
                                                                                purposes.
                                          Figure 6 shows the number of particles found in every 100 g of raw NZ green-lipped
                                 mussel     Figure
                                           Figure     66 shows
                                              digestive  shows      the
                                                              tractthe
                                                                     and  number
                                                                          number
                                                                            raw tarakihi of particles
                                                                                        of  particles     found in
                                                                                                         found
                                                                                                fish digestive     intract,
                                                                                                                       everyas100
                                                                                                                      every     100  gg of
                                                                                                                                  well   of  raw
                                                                                                                                         asraw      NZ green-lipped
                                                                                                                                                   NZ
                                                                                                                                             sea salt.   green-lipped
                                                                                                                                                         In addition,
                                   mussel
                                  mussel        digestive
                                               digestive       tract
                                                              tract    and
                                                                      and     raw
                                                                            raw       tarakihi
                                                                                    tarakihi      fish
                                                                                                fish     digestive
                                                                                                       digestive
                                 it also expresses the number of particles per liter of tap water and bottled water.   tract,
                                                                                                                    tract,  as as  well
                                                                                                                                well    as as
                                                                                                                                            seasea   salt.
                                                                                                                                                  salt. In In  addition,
                                                                                                                                                            addition,
                                                                                                                                                                A rela-it
                                 tively high number of fragments was found in the digestive tract of NZ green-lippedAmus-
                                   it
                                  also also    expresses
                                           expresses      the  the  number
                                                                number       of    of   particles
                                                                                 particles     per   per
                                                                                                     liter liter
                                                                                                            of    of
                                                                                                                tap  tap
                                                                                                                     water water
                                                                                                                              and    and
                                                                                                                                     bottledbottled
                                                                                                                                                 water. water.
                                                                                                                                                           A         rela-
                                                                                                                                                              relatively
                                  high
                                   tively
                                 sels      number
                                         andhigh        of
                                                      number
                                                tarakihi    fragments
                                                             fish.of         was
                                                                   It fragments
                                                                       is expectedwasfound    in  the
                                                                                          thatfound
                                                                                                some indigestive     tract
                                                                                                             the digestive
                                                                                                         particles          of
                                                                                                                      are solid NZ
                                                                                                                               tract  green-lipped
                                                                                                                                       of NZ green-lipped
                                                                                                                                   fragments              mussels
                                                                                                                                                    which originate   and
                                                                                                                                                                    mus-
                                  tarakihi
                                   sels and
                                 from       the fish.
                                                 foodItingested
                                                 tarakihi   isfish.
                                                                expected
                                                                      It is    thatanimals.
                                                                         byexpected
                                                                              the      some thatparticles
                                                                                                  some        are solid
                                                                                                   Few particles
                                                                                                           fibers   werearefragments
                                                                                                                             solid fragments
                                                                                                                            found           which
                                                                                                                                       in the          originate
                                                                                                                                                  NZwhich           from
                                                                                                                                                               originate
                                                                                                                                                        green-lipped
                                  the
                                   from  foodthe  ingested
                                                    food         by
                                                            ingested the   animals.
                                                                           by   the        Few
                                                                                       animals.  fibers
                                                                                                    Few    were
                                                                                                            fibers found
                                                                                                                     were
                                 mussel digestive tracts while many more fibers were found in the tarakihi fish digestive    in  the
                                                                                                                              found    NZin  green-lipped
                                                                                                                                             the   NZ            mussel
                                                                                                                                                         green-lipped
                                  digestive
                                   mussel
                                 tracts.     This  tracts
                                                digestive   while
                                                     is probably     many
                                                                tracts   while
                                                                         due  more   thefibers
                                                                                to many          were
                                                                                              more
                                                                                           different     found
                                                                                                      fibers
                                                                                                         mouth    insizes
                                                                                                               were   the  tarakihi
                                                                                                                        found          fishtarakihi
                                                                                                                                  in the
                                                                                                                            of tarakihi       digestive
                                                                                                                                              fish   andfishtracts.
                                                                                                                                                           NZ        This
                                                                                                                                                               digestive
                                                                                                                                                                 green-
                                  is  probably
                                   tracts.     This   due
                                                       is    to  the
                                                           probably    different
                                                                          due     to  mouth
                                                                                       the      sizes
                                                                                             different   of  tarakihi
                                                                                                           mouth         fish
                                                                                                                     sizes
                                 lipped mussels or the different types of food they intake. It is also possible that tarakihi  and
                                                                                                                              of      NZ
                                                                                                                                  tarakihi  green-lipped
                                                                                                                                                fish   and   NZ mussels
                                                                                                                                                                  green-
                                  or
                                 fish, the
                                   lipped     different
                                               mussels
                                          looking           types
                                                             or the
                                                       for food    inofdifferent
                                                                          food
                                                                        the  mud,  they areintake.
                                                                                        types         It
                                                                                                      toistake
                                                                                                of food
                                                                                             prone           alsodenser
                                                                                                            they   possible
                                                                                                                   intake.    Itthat   tarakihi
                                                                                                                                  is also
                                                                                                                           plastics,    such possiblefish,that
                                                                                                                                                           looking
                                                                                                                                                 as polyester          for
                                                                                                                                                                tarakihi
                                                                                                                                                                  fibers
                                  food      in  the   mud,     are   prone     to   take    denser    plastics,    such    as  polyester       fibers   or  fishing    net
                                 orfish,    looking
                                      fishing           for food
                                                   net fibers,       in the
                                                                  than         mud,
                                                                           water.        are proneboth
                                                                                      However,          to take
                                                                                                              NZ denser      plastics,
                                                                                                                   green-lipped           such as
                                                                                                                                       mussel      and polyester
                                                                                                                                                         tarakihifibers
                                                                                                                                                                     fish
                                  fibers,     thannet water.     However,        bothHowever,
                                                                                         NZ green-lipped          mussel     and tarakihi        fishand
                                                                                                                                                       show    a similar
                                 show a similar number of fragments, and this implies that a similar amounttarakihi
                                   or   fishing           fibers,   than    water.                     both    NZ   green-lipped         mussel              of micro-fish
                                  number
                                   show       a  of fragments,
                                                 similar      number    andof  this    impliesand
                                                                                fragments,         thatthis
                                                                                                          a similar
                                                                                                               implies  amount
                                                                                                                           that    a of  microplastic
                                                                                                                                      similar     amount     fragments
                                                                                                                                                               of micro-
                                 plastic fragments remain in their digestive tract with similar masses. Those particles were
                                  remain       in their digestive
                                   plastic analyzed
                                               fragments        remain     tract
                                                                            in theirwith    similar masses.
                                                                                         digestive     tract with  Those    particles
                                                                                                                      similar    masses.   were
                                                                                                                                              Thosefurther    analyzed
                                 further                       using     Fourier-transform             infrared     spectroscopy          (FTIR)      toparticles   were
                                                                                                                                                          verify their
                                  using      Fourier-transform
                                   further analyzed                        infrared       spectroscopy        (FTIR)    to  verify    their   characteristics.
                                                                                                                                                           verify Nile
                                 characteristics.          Nileusing
                                                                  red only Fourier-transform
                                                                                 stains hydrophobic      infrared     spectroscopy
                                                                                                                material;     thus, the(FTIR)stainedtoparticles      their
                                                                                                                                                                      are
                                  red    only     stains
                                   characteristics.         hydrophobic
                                                            Nile    red    only   material;
                                                                                    stains       thus,
                                                                                             hydrophobic  the  stained
                                                                                                                 material; particles
                                                                                                                               thus,     are
                                                                                                                                        the    either
                                                                                                                                               stained  hydrophobic
                                                                                                                                                          particles    are
                                 either hydrophobic plastics or lipids.
                                  plastics      or lipids.
                                   either hydrophobic              plastics or lipids.
                                                     18
                                                      18                          16
                                                                                   16                                            Fibers
                                                     15              14                                                           Fibers
                                                      15              14                                                         Fragments
                                               particles

                                                                                                                                  Fragments
                                            particles

                                                     12                                                                          Beads
                                                      12                                                                          Beads
                                          ofof

                                                           9                                      8
                                                            9                7                     8
                                    Number

                                                                              7
                                   Number

                                                           6                                                                         5
                                                            6                           4                                             5
                                                                                         4                                                3
                                                           3                                 2         2                                   3
                                                            3   1                             2         2      1 1
                                                                 1                                              1 10                      1
                                                                      0                                                                    1
                                                           0            0                                           0
                                                            0 Mussel           Fish          Sea salt        Tap water              Bottled
                                                                Mussel
                                                              (digestive        Fish
                                                                            (digestive        Sea salt        Tap water              Bottled
                                                                                                                                     water
                                                               (digestive
                                                                tracts)      (digestive
                                                                              tracts)                                                 water
                                                                 tracts)       tracts)
                                  Figure 6. The number of particles found in each sample. Data attained express the normalized
                                 Figure 6. The number of particles found in each sample. Data attained express the normalized
                                  number
                                  Figure 6.of particles found  per 100 g of NZ    green-lipped  mussel, tarakihi fish and  sea  salt samples.
                                 number  of The  number
                                             particles    of particles
                                                       found per 100 gfound
                                                                         of NZingreen-lipped
                                                                                  each sample.mussel,
                                                                                                Data attained
                                                                                                      tarakihiexpress
                                                                                                               fish andthe
                                                                                                                         seanormalized
                                                                                                                             salt samples.
                                 The normalized number of particles in tap water and bottled water samples are expressedper
                                  The normalized
                                  number   of      number
                                              particles    of
                                                        found particles
                                                               per 100  gin
                                                                          oftap
                                                                             NZ water and  bottled
                                                                                  green-lipped     water
                                                                                                mussel,  samples
                                                                                                        tarakihi   are
                                                                                                                 fish  expressed
                                                                                                                      and  sea salt    liter
                                                                                                                                         literof
                                                                                                                                    samples.
                                                                                                                                    per
                                  sample.
                                  The  normalized
                                 of sample.         number   of particles in  tap water and bottled water  samples   are expressed    per  liter
                                  of sample.
Processes 2022, 10, 265                                                                                                 9 of 16

                                  3.4. MP Identification by Fourier-Transform Infrared Spectrometry (FTIR)
                                         The fragments and beads observed (i.e., stained by Nile red) under the optical mi-
                                    croscope were then identified using FTIR. Fibers were not analyzed due to the small size
                                    of those. Those particles were classified by determining the apparent and distinct peak
                                    wavenumbers [48,49]. Figures 7–11 show the attained spectra for the particles found in
                                    the samples. Figure 7, which shows particles found in NZ green-lipped mussels, and
                                    Figure 8, which shows particles found in sea salt, exhibit apparent peaks at around
                                    1460 and 1375 cm−1 , which are representations of C–H scissoring and concentrations
                                    of methyl (–CH3 ) groups, respectively [48,49]. Upon these peaks, they classify the presence
                                    of polypropylene (PP) in NZ green-lipped mussel digestive tract and sea salt samples.
                                    However, the peaks that occurred between 2500 and 2000 cm−1 in those two figures are
                                    different. This may be due to their different grades or degradations. Webb et al. [32,40]
                                    collected NZ green-lipped mussels around the NZ shore and observed apparent contamina-
                                    tion by plastic fragments even though they did not identify them. Leung et al. [54] reported
                                    that green-lipped mussels caught near China are contaminated by plastic fragments as
                                    well. They used Raman microspectroscopy to identify those fragments, and more than
                                    half of the particles were identified as PP, about a quarter was PE and the rest was PS and
                                    PET. Our results are in accordance with their research in terms of PP fragments. There
                                    also were unidentified plastics in NZ green-lipped mussels in this study (Table 1), and
                                    those could be denatured PE, PS and PET or some other plastics. Kim et al. [21] analyzed
                                    MPs from sea salt around the world and found that there are various types of MPs and
                                    natural polymers including unidentifiable particles in the sea salt. They reported that the
                                    identified MPs composed one third each of PE, PP and PET. However, one of the three
                                    plastic particles in this study is also PP, while the other two were not identified. The density
                                    of PET is around 1.4 g/cm3 , so theoretically, such a plastic should sink quickly in the ocean
                                    before traveling far. However, the main sources of PET MP fragments are from water
                                    bottles, which normally float on the ocean surface, and thus, PET MPs are likely to be found
                                    worldwide.
Processes 2022, 10, x FOR PEER REVIEW             To minimize this type of MP source, we can consider replacing the use of that 10 of 16
                                    plastic with biodegradable polymers [55,56]. Even if biodegradable plastics degrade more
                                    slowly than anticipated, its degradation is still faster than non-degradable plastics.

                                                      98

                                                      96
                                  Transmittance (%)

                                                      94

                                                      92
                                                                          CH scissoring
                                                                          1456 cm-1
                                                      90

                                                      88
                                                                                    CH3 peak
                                                                                    1377 cm-1
                                                           3000   2500     2000     1500        1000   500
                                                                         Wavenumber (cm-1)

                                  Figure 7. FTIR spectrum of a particle collected from the NZ green-lipped mussel digestive tract
                                 Figure 7. FTIR spectrum of a particle collected from the NZ green-lipped mussel digestive tract
                                  identified as PP.
                                 identified as PP.

                                                      99

                                                      98
                                  e (%)
1377 cm
                                                             3000   2500     2000    1500      1000   500
                                                                           Wavenumber (cm-1)

        Processes 2022, 10, 265   Figure 7. FTIR spectrum of a particle collected from the NZ green-lipped
                                                                                                         10 mussel
                                                                                                            of 16  dig
                                  identified as PP.

Processes 2022, 10, x FOR PEER REVIEW 99

                                                        98
                                   Transmittance (%)
                                  prolonging MP issues. PEG found in tarakihi fish distinctly proclaims that a
                                  and97their food consumption should be considered when animal models ar
                                  MP studies. This is because their food intake routes can govern the types of
                                  them 96[59]. Due to NZ’s remote location from highly populated counties [57],
                                  ination in tarakihi fish may imply that the MPs can be from domestic source
                                  al. [60]
                                       95 expressed that the number and types of MPs found in fish in Austral
                                  very different even though               the two countries are relatively close and are bo
                                                                CH scissoring
                                                                1456   cm -1
                                  the South Pacific Ocean. This implies that domestic sources of plastics are a
                                       94
                                  to control MPs. There can be a few approaches                          to minimize the sources of M
                                                                     CH3 peak 1377 cm-1
                                  ple, intentional and unintentional disposal of plastics into the river or oce
                                  prohibited.
                                           3000 This  2500means  2000that personal
                                                                              1500        and governmental
                                                                                         1000        500          recognition is nece
                                  researchers and engineers   Wavenumber  need  (cmto
                                                                                    -1) develop economical plastic recycling p

                                  and
                                   Figurestrong    regulations
                                          8. FTIR spectrum         should
                                                           of a particle        befrom
                                                                         collected  enforced       [31]. as PP.
                                                                                        sea salt identified
                                  Figure 8. FTIR spectrum of a particle collected from sea salt identified as PP.

                                                       100.0                       C – O – C symmetric
                                                         Figure 9 exhibits that asymmetric    stretching
                                                                                   stretching 900 cm-1   of CH3 and             CH2 groups, wh
                                  appear around 2950‒2970 cm and 2920‒2935 cm , respectively, is observ
                                                                                      −1                    −1

                                  peak99.5at 2983 and 2915 cm−1. In addition, there were peaks at around 830‒
                                  1080‒1150 cm−1, which suggest asymmetric and symmetric C–O–C stretc
                                   Transmittance (%)

                                  tively.
                                       99.0
                                            By combining these peaks [49], they evaluate the presence of polyet
                                  (PEG) in tarakihi fish digestive tracts. PEG particles can typically be foun
                                  products, such as lotion, soaps, hair products and shower gel, which co
                                       98.5            CHenvironment
                                  flushed into the         2 asymmetric         with water after use. In addition, since the P
                                                       stretching 2915 cm-1
                                  1.125 g/cm (i.e., denser than ocean water) and considering that tarakihi fish c
                                                 3

                                       98.0 from the mud at the bottom of the ocean, it is coherent that PEG is fo
                                  sources          CH3 asymmetric
                                  Markic et al.stretching
                                                     [57] also     reported
                                                                2983  cm-1      that MPs were found in tarakihi fish caught ne
                                  New97.5Zealand. However,       C – O –they     did not identify the plastics. Cverenkárová
                                                                           C asymmetric
                                                                    stretching 1051 cm-1
                                  ported that in nearly all Australian fish, a piece of MP could be found, but
                                              3000       2500        2000       1500      1000         500
                                  reported. PEG particles will normally                -1
                                                                                            settle on the bottom of the ocean relat
                                                                  Wavenumber (cm )
                                  and this can explain why PEG is not always easily identified in studies. PEG o
                                   Figure 9. FTIR of a particle collected from the tarakihi fish digestive tract identified as polyethylene
                                  of  the ocean will experience less degradation than floating plastics, and th
                                  Figure
                                   glycol. 9. FTIR of a particle collected from the tarakihi fish digestive tract identified
                                  ylene glycol.

                                        Although Figures 10 and 11 have representations of CH2 rocking, whic
                                  spatial configuration at around 720 cm−1, they have other apparent peaks th
                                  them. Figure 10 shows two apparent peaks next to each other at around 1
                                  cm−1, which reflect the presence of terephthalate (OOCC6H4–COO) group [49
                                  strating the CH2 rocking and terephthalate nature shows that tap water conta
                                  It is not surprising to find polyester in tap water, as this is commonly used
                                  fabrics and films. For example, polyester could easily originate from drai
                                  laundry washing, where tiny fabric pieces could have been spun off during
Processes 2022, 10, x265
Processes             FOR PEER REVIEW                                                                                                          1211ofof 16
                                                                                                                                                        16

                                                       100

                                                        99
                                                                                                  CH2 rocking

                                   Transmittance (%)
                                                                                                     720 cm-1
                                                        98

                                                        97

                                                        96

                                                              Terephthalate Group
                                                        95    (OOCC6H4 – COO)
                                                                      (a) 1241 cm-1
                                                                                      (a)           (b)
                                                                      (b) 1091 cm-1
                                                             3000    2500    2000     1500        1000    500

Processes 2022, 10, x FOR PEER REVIEW                                       Wavenumber   (cm-1)                                                13 of 16

                                 Figure 10.
                                 Figure     FTIR spectrum
                                        10. FTIR spectrum of
                                                          of aa particle
                                                                particle collected
                                                                         collected from
                                                                                   from tap
                                                                                        tap water
                                                                                            water identified
                                                                                                  identified as
                                                                                                             as polyester.
                                                                                                                polyester.

                                        Figure 11 demonstrates CH stretching and CH scissoring around 2950 and 1460 cm−1,
                                      101
                                 respectively.      Although PE and PP share similar peaks, there is no apparent presence of a
                                 CH3 group peak at around 1377 cm−1, which can be seen in Figures 7 and 8, in Figure 11,
                                 implying that the spectrum does not illustrate PP. Nonetheless, there is a peak around
                                      100
                                 that range with very weak intensity, which may convey the presence of methyl groups at
                                   Transmittance (%)

                                 the end of the polymer chain. Upon these aspects, including the exhibition of CH rocking,
                                 we can99 conclude that bottled water contains traces of polyethylene (PE) [48,49]. However,
                                 it is difficult to determine whether PE is high density (HDPE) or low density (LDPE) due
                                 to its high similarities. Since this particle was found in bottled water, it is likely that it
                                       98                     CH scissoring 1466 cm-1
                                 would be HDPE rather            than LDPE, as HDPE is commonly used to produce bottle packag-
                                 ing. LDPE is normally used to produce plastic -1bags. Singh [28] manifested how MPs can
                                                                              CH2 rocking 719 cm
                                 be introduced
                                       97             into bottled water from           PP caps, but the identified MPs in this study was
                                 not PP. The cause         of how     PE
                                                    CH stretching 2914 cm  entered
                                                                              -1       into  the studied bottled water is unknown and be-
                                 yond the scope of this research. There were four particles identified per liter of bottled
                                           3000
                                 water (Table        2500
                                                   1);  much 2000
                                                                fewer than 1500 what  1000
                                                                                         Wong500 et al. [27] reported: 100 particles per liter of
                                                             Wavenumber      (cm -1)
                                 bottled water were found in Malaysia. This implies that number of MPs in bottled water
                                 can   vary11. significantly
                                                      spectrumwith
                                               FTIR spectrum             the location
                                                                  of aa particle
                                                                        particle          of from
                                                                                   collected  waterbottled
                                                                                                      production     facilities.asDistinct
                                                                                                            water identified
                                                                                                                    identified                locations
                                 Figure
                                 Figure   11.  FTIR              of                collected  from bottled  water              as polyethylene.
                                                                                                                                   polyethylene.
                                 would use different water sources and may even use different filtration systems. Likewise,
                                 Table
                                 the        The number
                                         1.quality
                                       air                  of particles
                                                       at various          (fragments
                                                                      locations      can and   beads)
                                                                                          alsowere
                                                                                                vary. found  in each
                                                                                                       Overall,       sampletoand
                                                                                                                  in order            identifiedMPs
                                                                                                                                                 plastics
                                        Not   all of the   collected      solid particles           identified    even   thoughminimize
                                                                                                                                   we only focused    in
                                 using FTIR.
                                 bottled         Particles
                                            water,    the   found inshould
                                                           process      NZ green-lipped
                                                                                  be   well   mussels, tarakihi
                                                                                            regulated,           fish, and
                                                                                                          including    air  sea  salt
                                                                                                                           quality,    were
                                                                                                                                       whilenormalized
                                                                                                                                               packing
                                 on polymers that illustrated apparent peaks between 3000‒500 cm−1. Hence, those parti-
                                 per 100 g of
                                 materials     andsample.
                                                     the not Particles
                                                          type           found in
                                                                 ofidentified
                                                                    methods           tap are
                                                                                   used   water   and
                                                                                               also   bottled water were normalized per liter of
                                                                                                    crucial.
                                 cles, which     could         be                  via using    polymer    spectra handbooks, were all partic-
                                  sample.
                                  ularly distinct from the spectra shown in there. However, Table 1 summarizes the number
                                  of particles identified and unidentified in each sample.  Showing There are more
                                                                                                      Absorbance        non-polymeric
                                                                                                                   in 3000–500    cm−1
                                                             Total
                                  particles  than
                                    Type of Sample  polymer  particles
                                                          Number of    in samples
                                                                          Not Polymerfrom the ocean, and  processed     water   (tap and
                                                                                             Unidentified
                                  bottled) shows much fewer       particles
                                                           Particles        than  in mussel, fish and sea salt    Identified
                                                                                                               samples.   It  Plastic
                                                                                                                             is possible
                                                                                                Polymer
                                  that the polyester particle was introduced during the sampling and handling processes of
                                    NZ green-lipped
                                  tap water, and PP in bottled water could originate from the bottle cap. However, it is not
                                    mussel digestive          14                9                  3                     2 PP
                                  clear
                                    tractwhy PE particles were found in bottled water. There can possibly be at least two
                                  reasons
                                    Tarakihiwhy
                                              fish samples from the ocean show that there are many unidentifiable polymers.
                                                              20               10                  9            1 polyethylene glycol
                                  Firstly, there
                                    digestive      could be a wide range of plastics in the ocean and not every one of those may
                                               tract
                                  beSea salt
                                      covered                 10
                                                 in polymer spectra            7 Secondly, it is2 also possible that1polymers
                                                                      handbooks.                                           PP          in
                                    Tap  water                 1               0                   0
                                  the ocean underwent both physical and chemical degradation over decades, which could1 polyester
                                    Bottled water              4               0                   0                3 PE and 1 PP
                                  lead plastics being converted into unconventional ones. It is expected that various MPs
                                  would be found in tarakihi fish and green-lipped mussel. This is because tarakihi fish
                                  typically source food not only in the ocean but also around mud areas, and hence, there
                                  are higher chances that it could ingest various MPs. As for green-lipped mussels, which
                                  are commonly utilized as a water pollution marker, they tend to intake a great extent of
                                  floating particles, leading to either solid particle accumulation temporarily or perma-
                                  nently. On the whole, a constructive identification technique that identifies all of the pol-
Processes 2022, 10, 265                                                                                          12 of 16

                                 Figure 9 exhibits that asymmetric stretching of CH3 and CH2 groups, which normally
                          appear around 2950–2970 cm−1 and 2920–2935 cm−1 , respectively, is observed as a split
                          peak at 2983 and 2915 cm−1 . In addition, there were peaks at around 830–940 cm−1 and
                          1080–1150 cm−1 , which suggest symmetric and asymmetric C–O–C stretching, respectively.
                          By combining these peaks [49], they evaluate the presence of polyethylene glycol (PEG)
                          in tarakihi fish digestive tracts. PEG particles can typically be found in skincare products,
                          such as lotion, soaps, hair products and shower gel, which could easily be flushed into
                          the environment with water after use. In addition, since the PEG density is 1.125 g/cm3
                          (i.e., denser than ocean water) and considering that tarakihi fish consume food sources
                          from the mud at the bottom of the ocean, it is coherent that PEG is found in them. Markic
                          et al. [57] also reported that MPs were found in tarakihi fish caught near Auckland, New
                          Zealand. However, they did not identify the plastics. Cverenkárová et al. [58] reported that
                          in nearly all Australian fish, a piece of MP could be found, but PEG was not reported. PEG
                          particles will normally settle on the bottom of the ocean relatively quickly, and this can
                          explain why PEG is not always easily identified in studies. PEG on the bottom of the ocean
                          will experience less degradation than floating plastics, and this can lead to prolonging MP
                          issues. PEG found in tarakihi fish distinctly proclaims that animal habitat and their food
                          consumption should be considered when animal models are selected for MP studies. This
                          is because their food intake routes can govern the types of MPs found in them [59]. Due to
                          NZ’s remote location from highly populated counties [57], PEG contamination in tarakihi
                          fish may imply that the MPs can be from domestic sources. Wootton et al. [60] expressed
                          that the number and types of MPs found in fish in Australia and Fiji are very different
                          even though the two countries are relatively close and are both located in the South Pacific
                          Ocean. This implies that domestic sources of plastics are also important to control MPs.
                          There can be a few approaches to minimize the sources of MPs, for example, intentional and
                          unintentional disposal of plastics into the river or ocean should be prohibited. This means
                          that personal and governmental recognition is necessary [31,33], researchers and engineers
                          need to develop economical plastic recycling processes [55], and strong regulations should
                          be enforced [31].
                                 Although Figures 10 and 11 have representations of CH2 rocking, which is related to
                          spatial configuration at around 720 cm−1 , they have other apparent peaks that distinguish
                          them. Figure 10 shows two apparent peaks next to each other at around 1240 and 1100 cm−1 ,
                          which reflect the presence of terephthalate (OOCC6 H4 –COO) group [49,50]. Demonstrating
                          the CH2 rocking and terephthalate nature shows that tap water contains polyester. It is not
                          surprising to find polyester in tap water, as this is commonly used in packaging, fabrics
                          and films. For example, polyester could easily originate from drained water of laundry
                          washing, where tiny fabric pieces could have been spun off during the washing process
                          and eluted from water filtering processes. It is likely that tap water from different location
                          will show different MPs depending on the level of plastic use and its types [24]. Hence,
                          different approaches are necessary to control MPs in tap water. For example, there can be
                          a simple method to minimize MPs from laundry. Laundry washing water from washing
                          machines should be filtered before releasing it down to drain to reduce the number of fibers
                          and fragments discharged to the environment. Additionally, it is rather simple to minimize
                          MPs in the tap water such by installing a water filtration system on the tap. However,
                          nano-sized MPs could not be filtered by these methods. It has been evaluated that there are
                          existing nanoparticles in tap water, but the presence of those does not seem to cause any
                          major issues to human health under controlled exposure [35]. Those nanoparticles are out
                          of the scope of this study; thus, no further investigation was performed.
                                 Figure 11 demonstrates CH stretching and CH scissoring around 2950 and 1460 cm−1 ,
                          respectively. Although PE and PP share similar peaks, there is no apparent presence of a
                          CH3 group peak at around 1377 cm−1 , which can be seen in Figures 7 and 8, in Figure 11,
                          implying that the spectrum does not illustrate PP. Nonetheless, there is a peak around that
                          range with very weak intensity, which may convey the presence of methyl groups at the
                          end of the polymer chain. Upon these aspects, including the exhibition of CH2 rocking, we
You can also read