Middle East Real Estate Predictions - 2023 Dubai market review - Deloitte
←
→
Page content transcription
If your browser does not render page correctly, please read the page content below
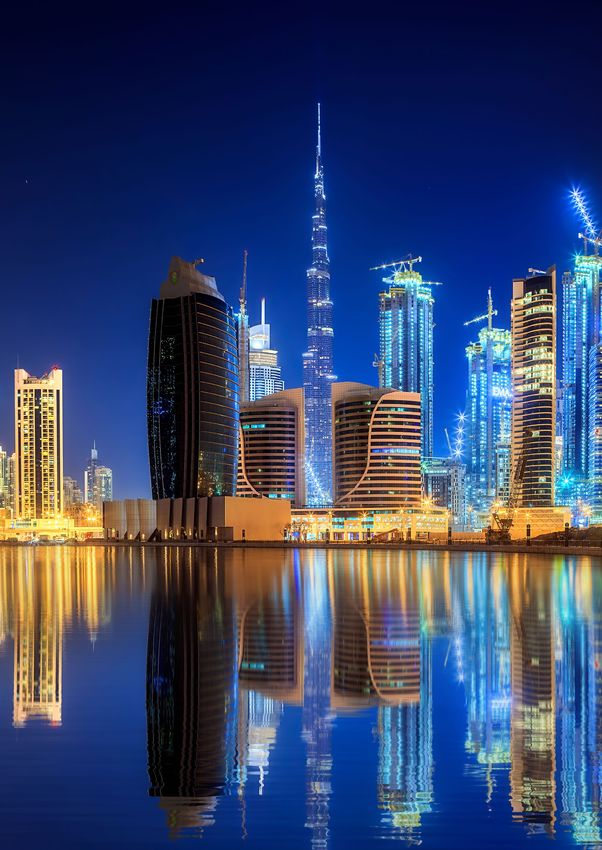
Middle East Real Estate
Predictions
2023
Dubai market review


Middle East Real Estate Predictions | 2023

Contents
  Executive summary                         04

  Dubai real estate market performance

  Hospitality market                        08

  Residential market                        10

  Office market                             12

  Retail market                             14

  Industrial and logistics market           17

  Key contacts                              18

                                                                                03
Middle East Real Estate Predictions | 2023

Executive summary
Dubai real estate market performance
Pent-up demand from travellers and increased spending by residents led the post-pandemic recovery of the real estate sector in
Dubai. Amidst global economic uncertainty and recessionary fears, Dubai’s status as a safe haven has attracted investors to the
market throughout 2022. However, inflation remains a concern for consumers and is expected to impact sentiment resulting in
price discovery and rent increases leading into 2023.

                     Hospitality
                     Occupancy for Dubai averaged 70% at the end of 2022, compared to the same period in 2021, while the average
                     ADR over this period has increased by 37% year-on-year to AED 641. This is higher than the majority of the
                     regional and international markets.

                     Residential
                     Average sales prices for residential property in Dubai increased by approximately 12% between Q3 2021 and
                     Q3 2022 to reach AED 1,203 per sq ft. Average rents also increased by approximately 19% over the same period,
                     rising to AED 73 per sq ft as as at the end of 2022. Gross yields reflect 6.1% compared to 5.7% in 2021.

                     Offices
                     Office rents have recovered to pre-pandemic levels registering an increase of 12% at the end of 2022 over the
                     same period.

04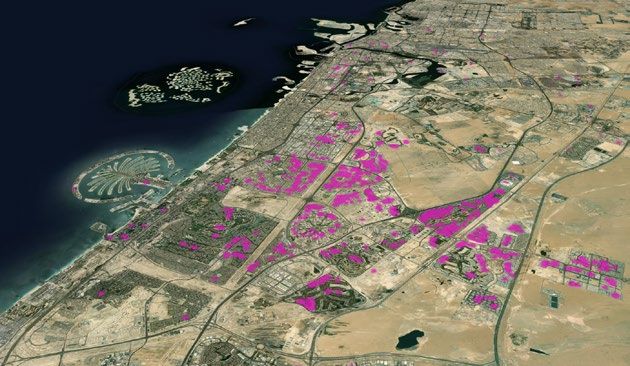
Middle East Real Estate Predictions | 2023

Retail
Consumer spending growth fueled the retail sector recovery in both online and traditional mall formats. The
Economist Intelligence Unit (EIU) estimates that the total UAE retail sales volume will increase by approximately
4.2% in 2022, with sales expected to increase by 3.9% on average between 2023 to 2026.

Industrial and logistics
Average warehouse rents have continued to recover as demand from logistics companies remains buoyant and
freight movements at the airports surpass 2020 levels by 22% and 3% at Dubai International Airport (DXB) and
Dubai World Central (DWC) respectively.

                                                                                                                    05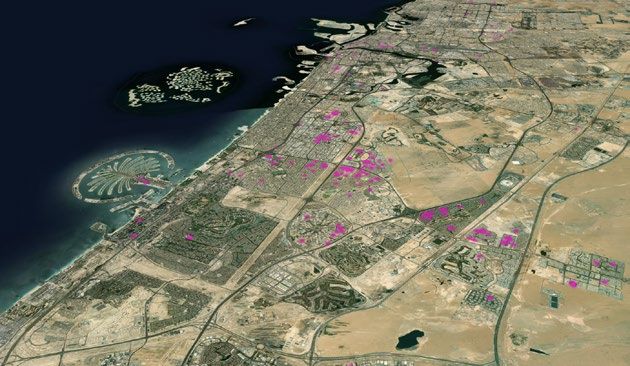
Middle East Real Estate Predictions | 2023

Dubai real
estate market
performance

06
Middle East Real Estate Predictions | 2023

Hospitality market                08
Residential market                10
Office market                     12
Retail market                     14
Industrial and logistics market   17

                                                                              07
Dubai’s hospitality market
The hospitality market recovery strengthened during 2022 as key
performance indicators tracked higher than the previous year despite total
visitor numbers remaining below pre-pandemic levels.
Review of 2022 performance Dubai hotel performance percentage change, January 2021 to
Dubai welcomed 10.1 million overnight visitors in the first nine September 2021 vs January 2022 to September 2022
70
months of 2022, with the highest number of international guests
64%
arriving from India at 1.2 million and more than double the
60
number of visitors from Oman, KSA and the UK compared to
the previous year. International visitors are still lower than pre-
50
pandemic levels, with a total of 12.1 million visitors in Dubai during
Y-o-y% change from 2021
2019.
40
37%
The YTD September 2022 occupancy for Dubai averaged 70% 30
compared to 59% for the same period in 2021, while the average
ADR over this period has increased by 37% year-on-year to 20 20%
AED 641. This is higher than the majority of the regional and
international markets, as shown on the following page. 10
As seen in the adjacent graph, both ADR and occupancy improved 0
significantly from the previous year as a market-wide recovery Occupancy (%) ADR RevPAR
was supported by ease of travel and the lifting of capacity and
Source: Business Intelligence and Reporting (DTCM)
personal protective equipment (PPE) related restrictions. The
first three months of the year were the strongest for occupancy
performance, reaching 91% in March.
Dubai hotel market performance, January to September 2022
1,000
71% 91% 100%
59%
85%
80%
750 73%
ADR/RevPAR (AED)
63% 61% 69% 60%
64%
500
40%
250
20%
850
601
784
663
888
809
789
462
590
429
447
280
435
263
425
272
446
307
0 0%
January February March April May June July August September
ADR (AED) RevPAR (AED) Occupancy (%)
Source: STR Global
08Middle East Real Estate Predictions | 2023
Post-pandemic recovery UAE Tourism Strategy 2031
The YTD September 2022 data STR shows all performance metrics In mid-November 2022, His Highness Sheikh Mohammed bin
are tracking above 2019 levels with the exception of city-wide Rashid Al Maktoum launched the UAE Tourism Strategy 2031,
occupancy. In addition to international visitors, activity from which aims to strengthen the position of the UAE as one of the
residents has supported the recovery of the hospitality sector in best destinations in the world for tourism.
Dubai.
The goal is to boost the country’s competitiveness as an
ADRs are tracking 22.6% higher than 2019 levels, resulting in a international tourism destination by attracting AED 100 billion as
18% increase in revenue per available room (RevPAR) from 2019 additional tourism investments and welcoming 40 million hotel
levels. guests in 2031.
Data from the Department of Tourism and Commerce Marketing The strategy includes 25 initiatives and policies to support the
(DTCM) shows an increase in the average length of stay, which was development of the tourism sector in the country with a targeted
3.4 nights from January to September 2019 and has increased to gross domestic product (GDP) contribution of AED 450 billion in
4.0 nights over the same period in 2022. 2031, representing an annual increase of AED 27 billion.
Dubai ADR and occupancy vs regional markets, YTD September 2022
350 70% 70%
68%
300 62% 60%
Occupancy (%)
57% 52% 58%
250 47% 51% 50%
ADR (US$)
46%
200 44% 40%
150 38% 30%
100 20%
50 10%
104
140
125
175
214
169
107
169
97
88
75
0 0%
Abu Dhabi Amman Cairo & Casablanca Doha Dubai Jeddah Manama Muscat Riyadh Sharm el
Giza center Sheikh
ADR (US$) Occupancy (%)
Source: STR Global
Dubai ADR and occupancy vs international markets, YTD September 2022
65%
350 68% 70%
300 67% 60%
71% 55%
ADR/RevPAR (US$)
250 70% 50%
Occupancy (%)
60%
200 59% 62% 40%
63% 50%
150
51% 30%
45%
100 20%
50 10%
116
115
175
138
217
202
135
266
306
201
166
73
99
0 0%
Beijing Berlin Beunos Dubai Hong London Los Angeles Madrid New York Paris Rome Sydney Tokyo
Aires Kong
ADR (US$) Occupancy (%)
Source: STR Global
09Dubai’s residential market
Amidst global economic uncertainty and recessionary fears, Dubai’s status as
a safe haven has attracted investors during 2022, with transaction levels rising
year-on-year surpassing 2019 levels.
Review of 2022 performance Dubai ranging from 38% to 43% and Deira was the only location
Average sales prices for residential property in Dubai increased to record a decline of 5%. Transaction volumes have increased by
by approximately 12% between Q3 2021 and Q3 2022 to reach 56% YTD September 2022 when compared to the same period in
AED 1,203 per sq ft. Average rents have also increased by 2021 and have more than doubled from 2019 levels for the same
approximately 19% over the same period, rising to AED 73 per period. Secondary market properties constituted 55% of the total
sq ft as of September 2022. Gross yields reflect 6.1%, compared transactions in the first nine months of this year, with Business
to 5.7% in YTD September 2021 as rental growth has outpaced Bay, Dubai Marina and Jumeirah Village Circle recording the
growth in prices. highest number of transactions.
The average trend masks a much more varied sub-market picture The market continues to be dominated by cash buyers while
with Mohammed Bin Rashed City, Palm Jumeirah and Business demand for affordable villas and townhouses from existing
Bay being the top three sales price growth areas year-on-year residents has driven rental activity in this segment. Rents in this
against Dubai Land, Dubai South and Dubai Creek Harbour as category began to recover by the end of 2020, while the apartment
the locations with the highest price declines. By comparison, rent segment began to show signs of improved performance from the
increases were highest in Jumeirah, Palm Jumeirah and Downtown first half of 2021.
Dubai residential sales prices, Q1 2007 to Q3 2022
Lehman Bros. Last market Travel restrictions and
collapse peak lockdown measures
1,600
1,400
Price (AED per sq ft)
1,200
1,000
800
600
400
200
0
2007
2008
2009
2010
2011
2012
2013
2014
2015
2016
2017
2018
2019
2020
2021
2022
Villa Apartment Residential
Dubai residential rents, Q1 2009 to Q3 2022
Last market Travel restrictions and
peak lockdown measures
80
70
60
Rent (AED per sq ft)
50
40
30
20
10
0
2009
2010
2011
2012
2013
2014
2015
2016
2017
2018
2019
2020
2021
2022
Villa Apartment Dubai average
Source: REIDIN
10Middle East Real Estate Predictions | 2023
Dubai residential sales prices by location, Q3 2022
Palm Jumeirah Villas
AED 4,831 47%
Dubai Marina
AED 1,536 5%
Palm Jumeirah Apartments
Jumeirah Lakes Towers AED 1,857 34%
AED 1,045 2%
Downtown
Dubai Sports AED 2,159 14%
City
AED 724 -1.5%
Business
Dubai South Discovery
Bay
AED 701 -17% Gardens Duabi Land
AED 1,732 27%
AED 556 12% AED 787 -11%
Al Furjan
Mohammed Bin
AED 918 14%
Rashid City
Arabian Ranches Villas AED 2,076 51% Dubai Creek Harbour
AED 1,682 -4%
AED 1,191 -3%
AED 539 18%
Positive Neutral Negative
Source: REIDIN
Note: Sales prices are quoted in AED per sq ft with year-on-year change in %
Metric Apartment Apartment Villa rent Villa sales price Dubai average Dubai average
rent sales price (AED per sq ft (AED per sq ft) rent (AED per sales price
(AED per sq ft (AED per sq ft) per year) sq ft per year) (AED per sq ft)
per year)
2021 AED 64 AED 1,027 AED 58 AED 1,126 AED 61 AED 1,076
2022 AED 74 AED 1,105 AED 70 AED 1,302 AED 73 AED 1,203
Y-o-y trend
17% 8% 21% 16% 19% 12%
11Dubai’s office market
Office rents have recovered to pre-pandemic levels registering an increase
of 12% YTD in September 2022 compared to the same period last year.
Occupiers continue to assess relocation and consolidation opportunities in an
environment of increasing fit-out costs.
Review of 2022 performance The majority of government services, banks and professional
The post-pandemic workplace forms an integral part of corporate services companies have returned to the office while media,
occupier recovery strategies as issues of staff retention and technology and design firms have largely embraced hybrid working
employee engagement came to the fore over the last two models. Demand for office space continues to be defined by
years. The office market in Dubai has historically been driven by growth in business operations in key sectors of the economy.
international companies looking to establish a regional market
base in the Emirate. This segment of the market typically seeks Dubai employment in financial and business services, 2015 to 2022f
prime central business district (CBD) properties, where rents were
the quickest to recover in 2022. 600 15%
Limited grade A stock within or in proximity to the central 500 10%
12%
business district of DIFC/Downtown has allowed building owners 10% 1% 3%
400 8% 5%
to maintain rent levels this year. Inflation linked rental escalations 3%
Persons in Thousands
have impacted ongoing leases for corporate tenants, even as the 300 -0%
role of the office continues to be reassessed. Capital investment
200 -5%
for fit-outs has previously been provided on stock outside of CBD
locations as an incentive to tenants and this trend is expected to 100 -10%
continue. -10%
0 -15%
Dubai Statistics Centre forecasts GDP growth forecast at 4.5% in
2015 2016 2017 2018 2019 2020 2021 2022f
2022 led by the hospitality, food and beverage (F&B), real estate,
wholesale and retail, transport, manufacturing and financial Employment - financial and business service
services sectors. As a result, hiring levels across key sectors is
Year-on-year change (%)
expected to increase and will have a positive impact on office
Source: Oxford Economics; Note: f:forecast
demand.
Dubai average office rents, Q1 2015 to Q3 2022
125 126 125 126 125 124 124 124 122 140
121 121 121 119 119
116 115 114
112 110 108 110 114
106 103 105 107 120
101 100 99 101 102
100
AED per sq ft per year
80
60
40
20
0
Q1-2015
Q2-2015
Q3-2015
Q4-2015
Q1-2016
Q2-2016
Q3-2016
Q4-2016
Q1-2017
Q2-2017
Q3-2017
Q4-2017
Q1-2018
Q2-2018
Q3-2018
Q1-2022
Q1-2019
Q2-2019
Q3-2019
Q4-2019
Q1-2020
Q2-2020
Q3-2020
Q4-2020
Q1-2021
Q2-2021
Q3-2021
Q1-2022
Q1-2022
Q2-2022
Q3-2022
Source: REIDIN
Note: Rents quoted above exclude service charge
12Middle East Real Estate Predictions | 2023
WTC/SZR** Deira
AED 126 AED 83
DIFC
AED 259
TECOM Downtown
AED 202
AED 165
JLT*
AED 81
Al Barsha
Business Al Garhoud
AED 82 Bay
AED 76
AED 105
Bur Dubai
AED 87
Rents are quoted AED per sq ft per year
Rents are average achieved rents for shell and core offices exclusive of service charges
*Jumeirah Lakes Towers
**World Trade Centre/Sheikh Zayed Road
Area DIFC Bur Al Deira WTC/ Al Busi- Down- TECOM JLT Dubai
Dubai Garh- SZR Barsha ness town aver-
oud Bay age
2020 216 90 75 86 111 77 84 177 166 71 101
2021 239 82 69 80 109 75 87 164 167 72 102
Y-o-y
trend 8% 6% 10% 4% 16% 9% 21% 23% -1% 13% 12%
2022 259 87 76 83 126 82 105 202 165 81 114
Source: REIDIN, Deloitte
13Dubai’s retail market
Consumer spending growth fueled retail sector recovery in both online and
traditional mall formats.
Review of 2022 performance UAE retail sales volume growth, 2017 to 2026f
The EIU estimates that the total UAE retail sales volume will
increase by approximately 4.2% in 2022, with sales expected to 9% 7.7%
increase by 3.9% a year on average over the remainder of the 6% 4.2%
5.3%
4.0% 3.6%
forecast period. 2.7%
Retail sales volume growth
3% 1.9%
0.9% 1.5%
0%
Emaar Malls, which owns and operates approximately 6.8 million
sq ft of retail gross leasable area (GLA)1, registered 24% growth in -3%
revenue during the first nine months of 2022, when compared to -6%
the same period in 2021. Meanwhile average occupancy for the -9%
Emaar portfolio, which includes Dubai Mall, Dubai Marina Mall, -9.7%
-12%
Gold & Diamond Park, Souk Al Bahar and other community retail
2017e 2018e 2019e 2020e 2021e 2022f 2023f 2024f 2025f 2026f
centres stood at 96% as of September 2022. Dubai Hills Mall, the
newest entrant among the portfolio opened in February 2022 and
had achieved an occupancy of 87% as of September 2022. Source: EIU a:actual, e:EIU estimate, f: EIU forecast
Meanwhile, Majid Al Futtaim (MAF) point of sale (POS) data2 shows For residents, ‘other malls’, which include smaller community cen-
that overall, consumer spending increased by 20% from January tres and convenience retail, as well as ‘non-mall’ outlets continue
to September 2022 compared to the same period in 2021 and to dominate in 2022 due to their convenience and proximity to
retail sector growth was 15%, with non-retail up 29%. According to residential areas. Majid Al Futtaim footfall data reveals an increase
the MAF data, fashion spending was the highest growth category of 15% in mall visitors during YTD September 2022 compared to
increasing 23% from 2021 levels and gaining 25% on 2019 levels. the same period in 2021.
January to March recorded the strongest sales through YTD
September, contributing 44% of the growth for the first nine Inflation remains a concern for consumers and is expected to
months compared to the same period in 2021. This mirrored the impact the overall discretionary spending in 2023. Omnichannel
highest performing months in the hospitality sector as highlighted formats are allowing consumers to search for discounts and deals,
previously. with retailers focusing on a seamless shopping experience through
an increased use of data and technology. The UAE e-commerce
Dubai consumer preferences market is expected to reach US$ 9.2 billion in 2026 according to
The Dubai Mall and Mall of the Emirates have historically been the analysis by the Dubai Chamber of Commerce. This growth
the majority of the demand from visitors, collectively capturing will be supported by increasing mobile e-commerce transactions
51% of total tourist retail demand in 2022. Demand from tourists through the availability of applications.
recovered during 2022 due to ease of travel and the lifting of re-
strictions. Additionally, retail centres continue to rely on resident
footfall and spend.
Note:
(1) Emaar Malls, Q3 2021 Results Presentation
(2) Majid Al Futtaim ‘State of the UAE Retail Economy’ Q3 2022 Report
14Middle East Real Estate Predictions | 2023
Cannibalising shopping malls:
how does a newly opened asset and its
location affect consumer behaviour?
Spatial cannibalisation, also referred to as, customer loss to competition
or to one’s own assets, is of crucial importance to retailers and commercial
developers alike.
Deloitte has partnered with Perigon AI to analyse the impact of credit card spend allows spending patterns for established centres
a new mall on existing retail developments. If you could reliably and the impact of new centres to be assessed.
estimate spatial cannibalisation when planning for retail expansion,
developing a new mall or monitoring the performance of your As a case study to demonstrate this approach we review
assets, will consumers previously populating other locations switch the impact the newly opened Dubai Hills Mall has had on it's
to your location? How does the location, e-commerce, marketing catchment. Below we see the weekly relative footfall in Dubai Hills
campaigns and tenant mix affect this expansion? Mall starting from week 1 of operations. We can see a steady
growth in the number of visitors to the mall in the first few weeks,
Utilising mathematical modelling and AI to process a vast array of mounting to a spike in week 6.
data ranging from human mobility data to geographically granular
1.0 1. Weekly relative footfall
Relative footfall
A spike in visitors to Dubai Hills Mall
0.8
in the first few weeks, called a honeymoon
0.6 period , known as a phase of discovery,
exploration and 'checking it out'.
0.4
0.2
Dubai Hills Mall visitation
0
1 2 3 4 5 6 7 8 9 10 11 12 13 14 15 16 17 18 19 20 21 22 23 24 25 26 27 28
Weeks after opening
Note: The indicated relative footfall is a score obtained from streams of big data, depicting footfall on a given
week between its all-time minimum (0) and all-time maximum (1). As seen on the graph, footfall in Dubai Hills
Mall reached its maximum on week 6 during the period analysed.
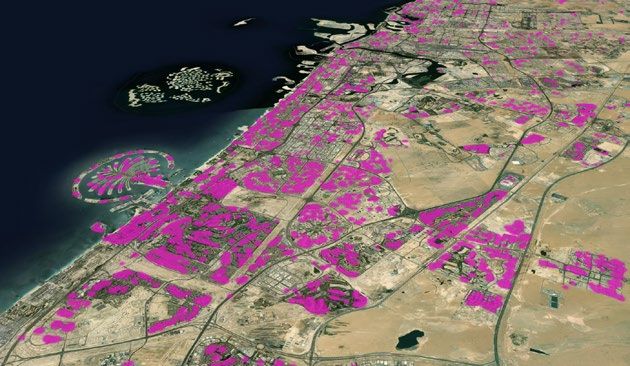
2. Where do these customers come from? Ranches - Mira Community axis, along Umm Suqeim Street.
We see the trade areas clustered around Dubai Hills Mall (green The honeymoon period attracted customers from a wide range of
pin) in the first week, expanding to cover larger swathes of Dubai neighbourhoods such as Palm Jumeirah, Dubai Marina, and JLT,
reaching peak coverage on week 6. The primary trade areas of considered as high-end central high-end central areas with an
the mall then come back to 'normal' with the mall and the Arabian abundant supply of retail destinations.
Week 1 Week 6 Week 11
155.0% 3. Mall cannibalisation
4.5%
What happened to the visitation patterns
4.0%
for other retail destinations after
3.5%
3.0% Dubai Hills Mall opened? Is there any
2.5% cannibalisation effect? As seen on the left
2.0% graph, 4.6% of all of all regular visitors to
1.5% Souq Extra Al Barsha 2 switched to Dubai
1.0% Hills Mall. On the right tail, 1.1% of all the
0.5%
visitors to Mall of the Emirates switched to
0.0% Souq My City Arabian The Lei- Avenues Mudon AI Barsha Mira Mead- J3 The Village Club Vista Mall of Dana Dubai Hills Mall. We can immediately see
Extra Center AI Ranches sure Mall Commu- Mall Commu- ows Mall Mall Mare the Mall
AI Barsha Barsha Commu- Center nity nity Village Emirates that the retail destinations affected the
2 Center nity Center
Center most are primarily community centers and
smaller retail lifestyle destination concepts,
Percentage of customers cannibalised by Dubai Hills Mall
rather than big shopping malls.
4. Cannibalisation string plot
If we look at the spatial distribution of the
retail destinations most cannibalised by
Dubai Hills Mall, we can see an interesting
pattern: They are concentrated near the
mall, and spread along Umm Suqeim
Street and its extension, Al Qudra Road
(highlighted in blue), serving Dubai's
outer communities, to include Al Barsha 2
and Dubai Hills, to Arabian Ranches,
Sustainable City, and beyond.
Mall cannibalisation 1% 2% 3% 4% 5%
5. A quick look at the tenant mix at Dubai Hills Mall
Dubai Hills Mall is placed on the artery connecting the upscale outer communities to Downtown Dubai. Dubai Hills Mall has accordingly
been positioned to attract residents from these communities as its primary trade area. The tenant mix reveals how community-oriented
its offerings are, to include family entertainment, F&B concepts, DIY hardware shops and barbershops. We can also see a selection of
comparison goods, offering brands seen in Dubai's 'super regional centres' in a more accessible format.
16Middle East Real Estate Predictions | 2023
Dubai’s industrial and logistics
market
Average warehouse rents continue to recover as demand from logistics
companies remains buoyant and freight movements at the airports surpass
2020 levels.
Review of 2022 performance UAE imports and exports, 2018 to 2025f
The two Dubai airports (DWC and DXB) have a combined capacity
500
of almost 2.8 million tons and are supported by airport adjacent as
well as city-wide warehousing facilities. At the end of 2021, freight
400
movements at the two airports had increased in comparison to
the 2020 levels, although they were still below 2019 levels. DXB
300
is currently the third busiest hub in the world for international
US$ billion
air freight with rapid transfer time to Port Rashid or Jebel Ali.
200
Meanwhile, DWC’s dedicated bonded link to Jebel Ali Port has
enabled a rapid transit of sea to air cargo, supporting a swifter
100
recovery for the industrial and logistics market in Dubai.
-
E-commerce focused zones such as Dubai CommerCity and Dubai 2009 2020 2021f 2022f 2023f 2024f 2025f
South’s e-commerce cluster have been added to the supply in Imports USD$bn Exports US$bn
recent years, while JAZFA is also developing additional logistics
Source: Fitch Solutions; Note: f:forecast
capacity. Meanwhile, there are still limited international grade
specification warehouses in other parts of Dubai and this could
lead to redevelopment projects in older areas such as Al Quoz,
Umm Ramool among others.
Dubai key logistics indicators, 2021 vs 2022 (millions)
Metric DWC DXB Jebal Ali Road freight
cargo throughput cargo throughput tonnage tonnes
throughput
2021f 0.94 m 2.65 m 7.05 m 30.64 m
Y-o-y
trend 5% 3% 1% 3%
2022f 0.99 m 2.73 m 7.14 m 31.46 m
Source: Fitch Solutions
f: forecast
Dubai average warehouse rents, Q3 2022
JAFZA
AED 22
DAFZA
AED 26
Dubai South Al Quoz
AED 26 DIP AED 35
AED 26
Rents are quoted AED per sq ft per year
Rents are average achieved rents for purpose built warehouses exclusive of service charges
Source: Deloitte
17Middle East Real Estate Predictions | 2023 Key contacts Stefan Burch Partner Head of Real Estate Deloitte Middle East sburch@deloitte.com Oliver Morgan Partner Head of Real Estate Development Deloitte Middle East omorgan@deloitte.com Jaime Liversidge Director Head of Real Estate Valuations Deloitte Middle East jliversidge@deloitte.com Dunia Joulani Director Head of Travel, Hospitality and Leisure (EMEA) Deloitte Middle East djoulani@deloitte.com Manika Dhama Director Head of Research, Real Estate Development Deloitte Middle East mdhama@deloitte.com 18
Middle East Real Estate Predictions | 2023

                                       19
This publication has been written in general terms and therefore cannot be relied on to cover specific situations; application of the principles set out will depend upon the particular circumstances involved and we recommend that you obtain professional advice before acting or refraining from acting on any of the contents of this publication. Deloitte Professional Services (DIFC) Limited would be pleased to advise readers on how to apply the principles set out in this publication to their specific circumstances. Deloitte Professional Services (DIFC) Limited accepts no duty of care or liability for any loss occasioned to any person acting or refraining from action as a result of any material in this publication. Deloitte & Touche (M.E.) LLP (“DME”) is the affiliate for the territories of the Middle East and Cyprus of Deloitte NSE LLP (“NSE”), a UK limited liability partnership and member firm of Deloitte Touche Tohmatsu Limited, a UK private company limited by guarantee (“DTTL”). Deloitte refers to one or more of DTTL, its global network of member firms, and their related entities. DTTL (also referred to as “Deloitte Global”) and each of its member firms are legally separate and inde- pendent entities. DTTL, NSE and DME do not provide services to clients. Please see www.deloitte.com/ about to learn more. Deloitte is a leading global provider of audit and assurance, consulting, financial advisory, risk advisory, tax and related services. Our network of member firms in more than 150 countries and territories, serves four out of five Fortune Global 500® companies. Learn how Deloitte’s approximately 300,000 people make an impact that matters at www.deloitte.com. DME is a leading professional services firm established in the Middle East region with uninterrupted pres- ence since 1926. DME’s presence in the Middle East region is established through its affiliated indepen- dent legal entities, which are licensed to operate and to provide services under the applicable laws and regulations of the relevant country. DME’s affiliates and related entities cannot oblige each other and/ or DME, and when providing services, each affiliate and related entity engages directly and independent- ly with its own clients and shall only be liable for its own acts or omissions and not those of any other affiliate. DME provides audit and assurance, consulting, financial advisory, risk advisory and tax services through 26 offices in 15 countries with more than 5000 partners, directors and staff. About Deloitte in the Dubai International Financial Centre Deloitte Professional Services (DIFC) Limited (“DPSL”) is incorporated in the Dubai International Financial Centre (“DIFC”), with commercial registration number CL0748 and is registered with the Dubai Financial Services Authority (“DFSA”) as a Designated Non-Financial Business or Profession. DPSL is a sublicensed affiliated entity of DME. DPSL has a 100% wholly owned subsidiary in the DIFC namely Deloitte Corporate Finance Advisory Limited (DCFAL) which has commercial registration CL2220. DCFAL is regulated by the DFSA and licensed to provide regulated financial advisory services. DPSL & DCFAL co-inhabit with their principal place of business and registered offices at Al Fattan Currency House, Building 1, 5th Floor, Dubai International Financial Centre, Dubai, United Arab Emirates. Tel: +971 (0) 4 506 4700 Fax: +971 (0) 4 327 3637. © 2023 Deloitte Professional Services (DIFC) Limited. All rights reserved.
You can also read