Modal Profile Air Cargo - Georgia Statewide Freight and Logistics Plan, 2010-2050 - GDOT
←
→
Page content transcription
If your browser does not render page correctly, please read the page content below
Georgia Statewide Freight and Logistics Plan, 2010-2050

                    Air Cargo
                      Modal Profile

Document Completed: April 2011
Limited Update: January 2016
Georgia Statewide Freight and Logistics Plan
                                                                                                         Detailed Air Cargo Modal Profile

Table of Contents
                 1.0      Background and Introduction .......................................................................... 1-1
                          1.1 Air Cargo Stakeholders .............................................................................. 1-1
                          1.2     Key Air Cargo Characteristics .................................................................. 1-3
                          1.3     Air Cargo Success Factors ......................................................................... 1-6
                          1.4     Recent Trends in the Air Cargo Industry ................................................ 1-8

                 2.0      Georgia Air Cargo Infrastructure..................................................................... 2-1
                          2.1 Air Cargo Infrastructure and Operations................................................ 2-1
                          2.2     Approach Procedures................................................................................. 2-4

                 3.0      Georgia Air Cargo Volumes ............................................................................. 3-1
                          3.1 Historical and Existing Cargo Volume Data........................................... 3-1

                 4.0      Survey of Air Cargo Stakeholders ................................................................... 4-1
                          4.1 Regulatory Agencies .................................................................................. 4-2
                          4.2     Cargo Facility and Infrastructure Profile ................................................ 4-3

                 5.0      Air Cargo Demand.............................................................................................. 5-1
                          5.1 Global Market.............................................................................................. 5-1
                          5.2     National Market .......................................................................................... 5-2
                          5.3     Value of Air Cargo...................................................................................... 5-2
                          5.4     Tenant Interest, Space Availability and Marketing Initiatives ............. 5-3
                          5.5     Corridors and Hubs.................................................................................... 5-3

                 6.0      Operations ............................................................................................................ 6-1
                          6.1 Carrier Activity ........................................................................................... 6-1
                          6.2     Cargo Operation Key Metrics ................................................................... 6-3

                 7.0      Atlanta Airport Competitive Position............................................................. 7-1
                          7.1 Airport Comparisons ................................................................................. 7-1
                          7.2     Comparable Fees for Air Cargo Operations ........................................... 7-5

                 8.0      Summary of Air Cargo Issues and Needs ...................................................... 8-1
                          8.1 Near-Term and Long-Term Growth ........................................................ 8-1
                          8.2     Airport-Specific Issues and Needs ........................................................... 8-2

GDOT Office of Planning                                                                                                                             i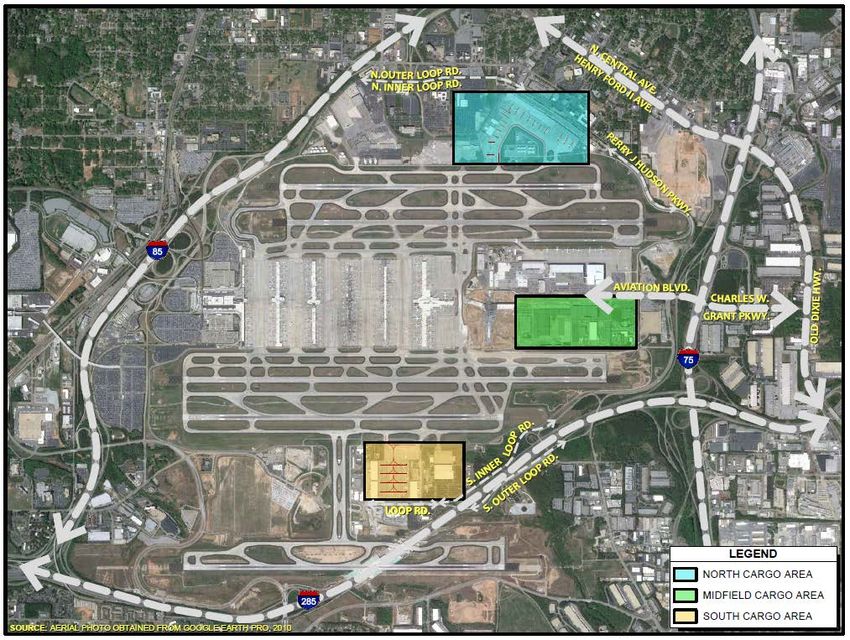
Georgia Statewide Freight and Logistics Plan
                                                                              Detailed Air Cargo Modal Profile

    1.0 Background and Introduction
       This air cargo profile is one of four detailed modal profiles developed for the Georgia
       Statewide Freight & Logistics Plan; the other three cover trucking, freight rail, and marine
       cargo. This document is comprised of the following eight chapters as described below:
                 •   Chapter 1 provides a primer on the air cargo industry – who is involved and
                     how they interact.
                 •   Chapter 2 describes the state’s air cargo infrastructure including the top three
                     air cargo airports and relevant access roads.
                 •   Chapter 3 provides information on cargo volumes at Georgia’s top ten air
                     cargo airports.
                 •   Chapter 4 provides detailed information on the air cargo activity at the state’s
                     top three air cargo airports based on data analysis and surveys.
                 •   Chapter 5 provides information on the characteristics of air cargo demand.
                 •   Chapter 6 describes air cargo carrier operations.
                 •   Chapter 7 compares Georgia air cargo airports to other air cargo airports
                     across the U.S.
                 •   Chapter 8 provides initial considerations on methods to improve air cargo
                     operations in Georgia.

       1.1 AIR CARGO STAKEHOLDERS
                 Successful air cargo operations are typically predicated on the efficient
                 interaction of a number of participants with different operating requirements
                 and perspectives. These participants have different levels of involvement based
                 on the commodity being moved and the geographic markets through which the
                 air cargo move. Almost every passenger carrier in this country carries freight in
                 the ‘belly’ of their aircraft. This section describes the other air cargo stakeholders
                 and their roles.

                 Freight Forwarders are private companies that specialize in exporting goods.
                 They serve as travel agents for a shipper’s freight. For example, if a shipper
                 wants to send 1,000 pairs of shoes to Borneo, or in some instances, Brooklyn, he
                 will call a forwarder. Forwarders control the routing of about 70% of the
                 international freight, and about 10% of the domestic freight. A forwarder facility
                 will typically involve a small amount of office space and approximately 5,000 ft2
                 warehouse, although some larger forwarder operations may require as much as
                 100,000 ft2. Freight forwarders do not need to be located on the airport, nor are

GDOT Office of Planning                                                                                    1-1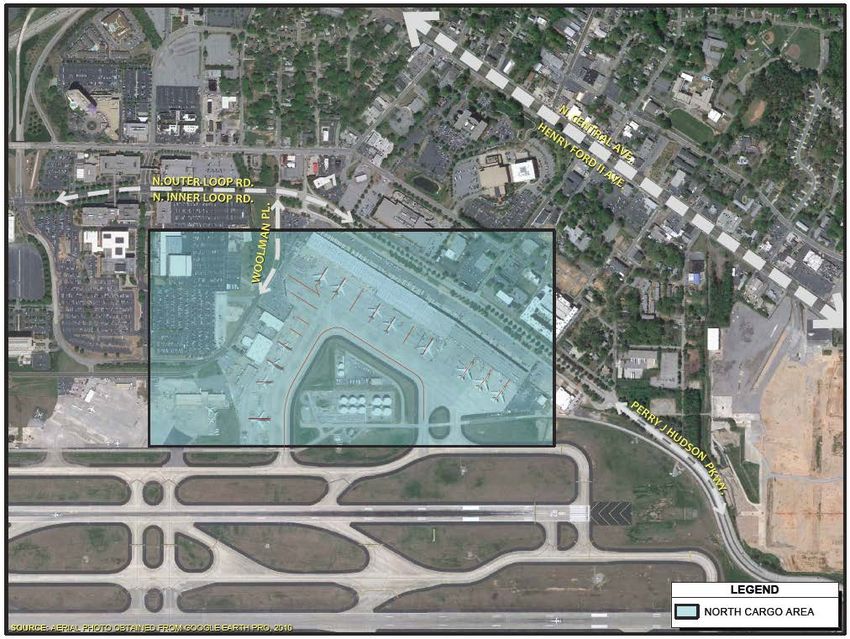
Georgia Statewide Freight and Logistics Plan
                                                                             Detailed Air Cargo Modal Profile

                 they usually prepared to pay higher airport leasing rates.                There are no
                 traditional freight forwarders located on-airport in Georgia.

                 Customs Brokers facilitate the clearance of international cargo through local and
                 federal customs processes. Like forwarders, they usually maintain minimal
                 office space but also have little need for warehouse space -- preferring instead to
                 form alliances with trucking companies that handle any large storage
                 requirements. Customs brokers do not need to be located at the airport, and
                 typically handle most of their business electronically with the federal clearance
                 agencies.

                 Federal Agencies have dual responsibility for customs control and facilitation of
                 goods movement. Most cargo activity involves the Transportation Security
                 Administration (TSA) and the U.S. Customs and Border Protection agency. Law
                 enforcement agencies at the federal, state, and local levels all provide assistance
                 as required. At an airport with a substantial international presence, it is
                 absolutely critical that these agencies have ready access to the cargo. A
                 centralized facility where all the agencies are located together is ideal. Such an
                 arrangement allows for rapid coordination on clearance issues and minimizes
                 ground traffic by shippers and consignees. There are no issues indicated with
                 any federal agencies related to cargo at Georgia airports.

                 Consolidators work with freight forwarders providing assembly points for cargo
                 prior to its delivery to a carrier on the airport. This consolidation of different
                 products on to specific flights and to specific destinations is critical in that it
                 creates shipping economies of scale and reduces the shipping cost per pound.
                 The ability to consolidate shipments and the frequency of flights to such a broad
                 range of destinations are important to Atlanta’s continued success.
                 Consolidators, although they require warehouse space, do not have to be on the
                 airport, however, similar to forwarders and brokers relatively easy access is
                 important to allow for delivery of the cargo to the carriers on the airport.

                 Container Freight Stations are typically located off-airport and handle the
                 breakdown of inbound international air freight. Their function is similar to a
                 consolidator in that they provide relatively inexpensive space for redistribution
                 to a number of clients. In many instances, these operations are bonded to allow
                 for the rapid movement of inbound cargo through the customs process.

                 Freighter Airlines are those dedicated freight carriers that specialize in heavy
                 freight as opposed to small packages or mail. Examples at Hartsfield-Jackson
                 airport include: UPS, Federal Express (“FedEx”), Cargolux (based in
                 Luxembourg), Atlas Air (US), Polar Air (US) and DHL Express (Germany). A
                 recent trend in this industry is the growth in “wet leases”, which provides
                 carriers with an option of leasing aircraft, crew, maintenance, and insurance
                 (ACMI) through companies that specialize in supporting the industry.

                 Integrators are carriers like FedEx and UPS that operate a trucking component as
                 well as aircraft and offer point-to-point as opposed to airport-to-airport delivery.
                 Their business is driven by time definite delivery and proximity to the regional

GDOT Office of Planning                                                                                   1-2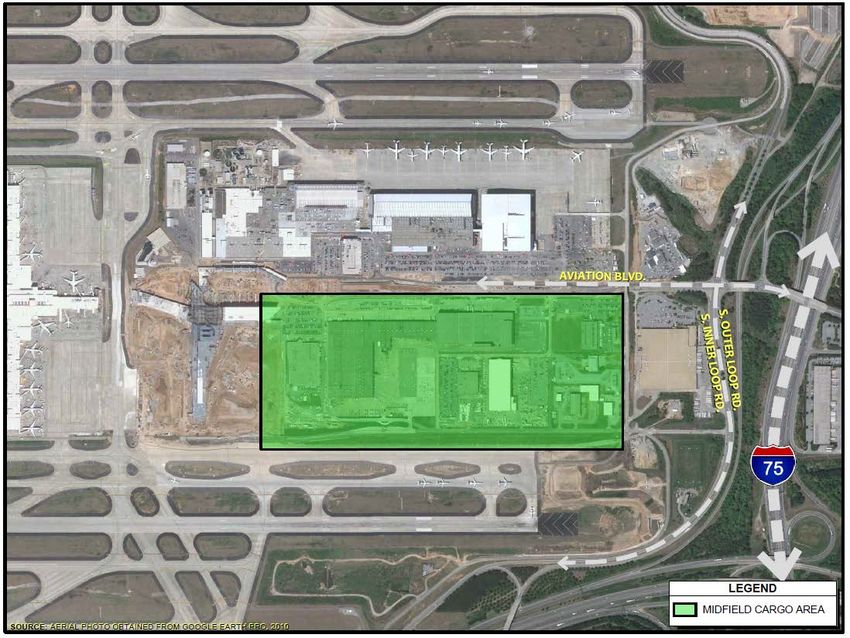
Georgia Statewide Freight and Logistics Plan
                                                                            Detailed Air Cargo Modal Profile

                 business districts is important to their operation, as well as offering specialized
                 service such as overnight express. Depending on their level of activity at an
                 airport, they tend to require substantial amounts of aircraft parking although
                 they may not require a large amount of building space. Depending on the
                 facility, they also may require significant amounts of truck and employee
                 parking.

                 Combination Carriers are defined as airlines such as Asiana, Korean Air and
                 Cathay Pacific that fly separate air freighters and passenger aircraft. These
                 carriers prefer to process both belly and freighter cargo in the same facility when
                 possible. In rare instances, a carrier will split their belly cargo and freighter
                 operations between airports when capacity becomes a factor, but this is typically
                 a last resort because of the added cost factors.

                 Cargo Handling Companies operate on a contract basis providing service to
                 carriers on the apron where they load and unload the aircraft and/or in the
                 warehouse where they assemble or breakdown the freight. Their business is
                 typically conducted on the airport grounds. Revenues are generated on a fee for
                 services basis, ranging from 2.5 to 6 cents per pound of cargo handled. At
                 Hartsfield Jackson airport, the existing buildings in the South Cargo Complex are
                 leased directly to cargo handling companies.

                 Trucking Companies make up the ground component of air cargo operations.
                 While these companies rarely lease space on an airport, it is very important that
                 air cargo facilities be designed to accommodate trucking, including frontage,
                 access, and roadway geometry.

                 In an ideal environment, most of these entities would be co-located on the
                 airport, creating an efficient, integrated, air cargo community. Operating costs
                 are lower, economies of scale can be achieved, and international goods can be
                 cleared faster and with fewer problems. The realities of limited on-airport space
                 and higher leasing costs have required that many of these businesses locate their
                 operations that do not require ramp access at off airport locations.

       1.2 KEY AIR CARGO CHARACTERISTICS
                 The Federal Aviation Administration (FAA) defines air cargo as freight and mail,
                 as well as being categorized as either international or domestic. As described in
                 more detail later, Georgia has three airports that handle measurable amounts of
                 air cargo: Atlanta, Albany, and Savannah. Because of its role as an international
                 passenger airport, Atlanta handles a large number of international, wide body
                 aircraft with substantial amounts of belly capacity. Albany handles smaller UPS
                 air shipments, and Savannah handles a mix of small regional aircraft.
                 Regardless of the airport, many passenger carriers also operate freighters. This
                 creates an ideal environment to transfer cargo between the diverse domestic
                 passenger and growing integrator operations. The presence of the Delta hub and

GDOT Office of Planning                                                                                  1-3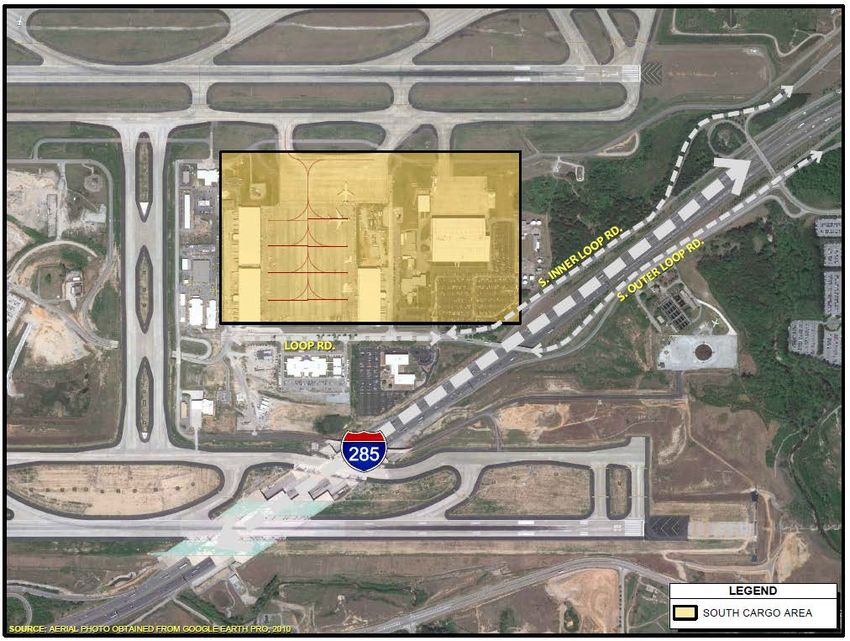
Georgia Statewide Freight and Logistics Plan
                                                                             Detailed Air Cargo Modal Profile

                 its substantial connections at Atlanta creates one of the most far-reaching air
                 distribution systems in the industry.
                 Products that move by air vary greatly, but have a number of things in common.
                 For the most part they are higher-cost products that move by other modes, are
                 lighter weight, and have a certain level of time sensitivity or urgency. Many
                 products are perishable either because of their inherent nature – vegetables, fish,
                 fruit, flowers, etc., -- or because they have a seasonal element that requires them
                 to be in retail outlets by a required date for an occasion such as Christmas,
                 Valentine’s Day, or for a season’s fashion line.
                 When appropriate alternatives present themselves, shippers typically will not
                 use air because of the higher cost. Depending upon a wide set of variables,
                 shipping by air can cost from six to 10 times as much as trucking (domestic) and
                 15 times as much by sea (internationally). The trade-off is time; trans-oceanic
                 shipping by air takes no more than one day, while by sea it can average two
                 weeks. For domestic shipping, the time savings is far less dramatic:
                 transcontinental shipping by truck averages only three days.
                 Because shippers must constantly balance the time-versus-cost equation,
                 domestic air cargo is trending more and more to using trucking instead. Because
                 virtually all air cargo begins or ends its journey on a truck, the ground
                 distribution system is as important as air routes. The design and location of
                 airports and their cargo facilities must take this into consideration and be capable
                 of accommodating growth in the landside component of the operations
                 commensurate with growth on the airside.
                 Freight forwarders (who effectively function as booking links between
                 manufacturers, shippers and logistics operations) and the non-integrated carriers
                 control about 70% of international cargo. Typically, to keep costs down they
                 book blocks of space with carriers in the belly of passenger aircraft. The other
                 30% is carried by the integrators who will accept shipments directly from
                 shippers and, upon occasion will take bookings from a forwarder.
                 On international shipments, integrators may compete directly with
                 airline/forwarder alliances for business but overnight delivery does not
                 necessarily play as vital a role in international shipping. Forwarders and
                 shippers will also utilize freighters operated either independently or by the
                 passenger carriers. In certain instances, carriers may lease freighter aircraft, but
                 the numbers of such operations and their impact on airport handling
                 requirements and infrastructure are not typically significant.
                 One key to successful international goods movement is clearance by the federal
                 agencies. Easy and timely access for inspection is vital. If the federal agencies do
                 not have the staffing to accommodate timely inspection and clearance, the benefit
                 of efficient facilities and prime location will not speed the flow of international
                 cargo.
                 Domestic cargo differs dramatically from international, but not because of the
                 lack of a customs clearance requirement. Instead, it is dominated by the

GDOT Office of Planning                                                                                   1-4
Georgia Statewide Freight and Logistics Plan
                                                                             Detailed Air Cargo Modal Profile

                 integrators, with very little influence by forwarders. Domestic air cargo also has
                 an enormous trucking component, and creates substantial demands on airport
                 aeronautical infrastructure. Integrators typically carry up to 90% of domestic
                 cargo. Competition among the integrated carriers is driven by guaranteed
                 overnight (or other time definite) delivery to almost any location. Integrators
                 operate with a very tight shipping window to their Midwestern distribution
                 hubs, creating a concentration of ground traffic in a region as trucks bring the
                 packages to the airport at the last possible minute.
                 Large volumes of domestic freight also move in the bellies of passenger aircraft.
                 At Hartsfield-Jackson, Delta is the largest cargo carrier based on the sheer
                 numbers of flights it operates. The cargo they handle are not typically as time-
                 sensitive and arrive at the cargo facilities (both origin and destination) in smaller
                 concentrations, but with much greater frequency, and without the well-defined
                 shipping windows.
                 Together, these segments of the cargo business create pressure on airports to:
                      •   Provide more passenger terminal capacity and proximate aircraft apron;
                      •   Expand warehousing, Ground Service Equipment (GSE), and office
                          space;
                      •   Create a more extensive network of restricted service roads
                      •   Develop more remote apron and accessing taxiways;
                      •   Construct significant building frontage, customer and employee parking;
                          and
                      •   Improve roadway access and geometry.
                 Few airports are positioned to deal effectively with the future requirements of
                 both the passenger and cargo segments of their business.
                 In an ideal environment, space for the on-airport cargo community would be
                 expansive enough to include a full complement of the supporting and ancillary
                 businesses that are important components of an air cargo operation. Geographic
                 proximity to the carriers allows these other businesses to realize operational and
                 financial benefits, while providing higher levels of service to their customers.

GDOT Office of Planning                                                                                   1-5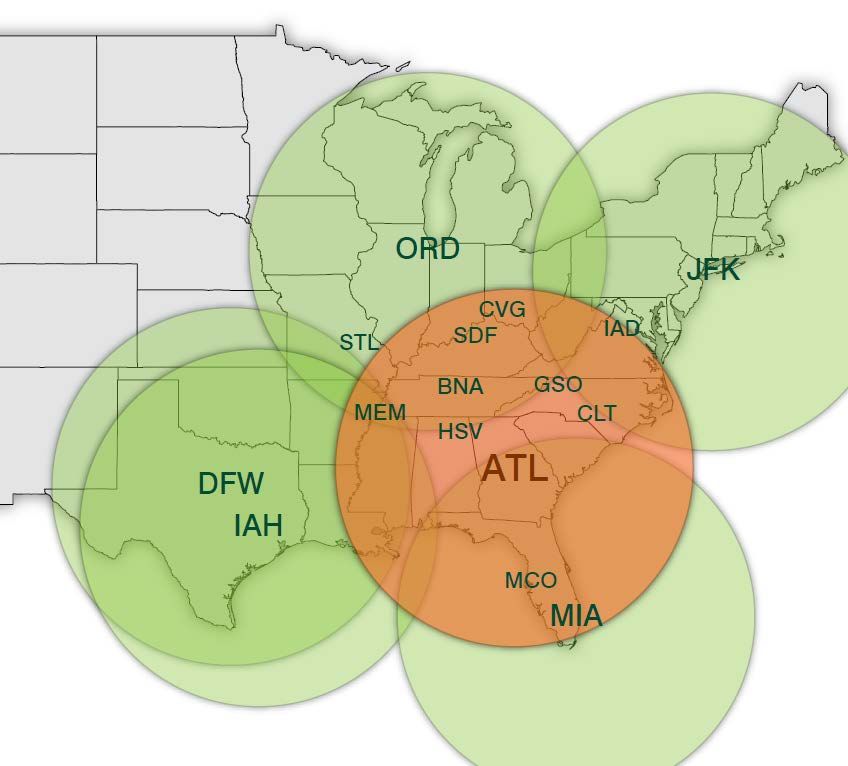
Georgia Statewide Freight and Logistics Plan
                                                                            Detailed Air Cargo Modal Profile

       1.3 AIR CARGO SUCCESS FACTORS
                 This section describes the basic ingredients of an airport’s successful air cargo
                 operations and describes each in relationship to Hartsfield-Jackson airport.
                 As airports mature, regional growth and evolving goods movement dynamics
                 can negatively impact the airport’s ability to meet the needs of the air cargo
                 industry, and eventually force shifts in operations to alternate facilities. In
                 looking at these factors, there are indications that some challenges pertaining
                 specifically to Atlanta may exist, however the attractiveness of the region for air
                 cargo remains strong. The challenges create opportunities to be explored
                 regarding more efficient utilization of existing airport assets as well as
                 development of new facilities and infrastructure.

                 Substantial passenger market – final origins, destinations and transfers:
                 Passenger flights provide carriers with the opportunity to use capacity in the
                 belly of passenger planes to ship cargo. Atlanta’s priority in maintaining its
                 preeminent position in passenger traffic will require the Airport to accommodate
                 substantial amounts of belly cargo and, in the instances of combination carriers,
                 provide adequate aircraft apron for the freighter component of the business.
                 Given the existing high levels of passenger activity and the projected growth for
                 the industry, the Atlanta airport is exceptionally well positioned to achieve this
                 goal. This assumes it can address geographic competition from other airports
                 and physical constraints that include competing uses for passenger,
                 maintenance, and general aviation activities, and limited available space to add
                 parking for international freighters.

                 Large regional consuming and producing marketplace: A balance between
                 inbound and outbound air cargo freight is critical to the financial success of an
                 air cargo operation. The flow of cargo to and from certain global regions will
                 vary based on economic trends; in the event the economics substantially decrease
                 in either direction there is a strong probability that freighter traffic will be
                 reduced accordingly. The large and growing population of the Atlanta region
                 and southeastern states could generate increased volumes of inbound and
                 outbound freight for Atlanta to handle.

                 Substantial “lift” to a large number of markets: A substantial number of flights
                 to global markets and sufficient volumes of cargo to each destination enables
                 shippers to consolidate shipments thus reducing overall shipping rates. Atlanta
                 has the large and diverse customer base that enables efficient interlining
                 (transferring cargo) between passenger and freighter aircraft with a resultant
                 global reach.

                 Supporting business infrastructure of freight forwarders, customs brokers, and
                 trucking: While integrated carriers such as FedEx and UPS control nearly 90% of
                 domestic cargo shipments, freight forwarders and customs brokers control

GDOT Office of Planning                                                                                  1-6
Georgia Statewide Freight and Logistics Plan
Detailed Air Cargo Modal Profile
approximately 70% of the international market. This is due to consolidations
where they can lower costs as well as use, through their multiple airline contacts,
giving a wide range of shipping options. Typically these businesses cluster on or
near the transportation facility they wish to utilize. The result is the existence, in
the area immediately surrounding the Atlanta Airport, of several million ft2 of
such facilities. This broker/forwarder community is in large part supported by
the increasing international use of their services for marine shipping through the
Port of Savannah. Nevertheless, growth of all cargo – both air and ocean-borne –
will continue to generate regional growth and demand for space.
Adequate roadway infrastructure between the airport and an effective
highway distribution system: One of the side effects of air cargo growth is a
corresponding increase in trucking traffic which therefore impacts regional
traffic patterns and flows. One of the original factors of air cargo success at the
Atlanta Airport was the excellent regional roadway infrastructure and the links it
provided between the Airport and the regional highway network. Given the
growth in passengers and cargo, as well as overall regional growth, congestion
could eventually cause facility access and efficient rates of travel to become
increasingly problematic. This will be more of an issue for passenger activity
than for cargo because trucking tends to operate at off-peak hours.
Connectivity to the highways from the cargo complexes is not currently an issue
nor do forecast volumes suggest that this will become an issue in the future.
There are separate landside operating concerns at the cargo complexes discussed
later in this document. Future business strategies must consider optimizing
traffic flow and maneuverability in these complexes that are shown in Chapter 4
of this document.
Physical capacity to accommodate growth: The most obvious criterion for the
future success of an air cargo program is the physical capacity to accommodate
the airside and landside requirements of both tenants and users. This includes
aeronautical infrastructure, physical facilities, landside parking and queuing, and
roadway geometry. The latter two elements are important to ensure that the
airport functions efficiently as an inter-modal facility. While cargo operations
continue to experience solid growth, there are some constraints facing the
Atlanta airport as it approaches its practical limitations.
Geographic positioning for cargo operations with clear advantages over
potential competitors: The geographic location of an airport is a prime driver of
its competitive position relative to other air cargo facilities. Capitalizing on the
Delta hub and its ideal positioning in the Southeast, Atlanta is well situated to
serve as a shipping facility for both domestic and international cargo. The
airport can also function effectively as a consolidation and distribution center for
north/south international goods movement as well. New and improved
customs clearance technology and longer-range aircraft broaden the ability of the
Airport to serve the global marketplace.
GDOT Office of Planning 1-7Georgia Statewide Freight and Logistics Plan
Detailed Air Cargo Modal Profile
Bilateral and Open Skies Agreements: The use of U.S. airports by foreign
carriers is based on international trade agreements which formally grant nations
and carriers access to airports in other countries. Atlanta, because of its size and
activity levels and ability to connect international passengers with domestic
destinations, is usually one of the first markets which international carriers seek,
and are granted access. The Delta acquisition of Northwest and its routes also
broaden the international capacity and connectivity of Atlanta based operations.
The acquisition has enabled Delta to reroute international passenger activity
through Atlanta from former Northwest facilities, and to develop sufficient
critical mass to warrant opening new routes to new destinations.
1.4 RECENT TRENDS IN THE AIR CARGO INDUSTRY
The goods movement industry has over the past decade experienced dramatic
changes. Factors such as increased reliance on speed, e-commerce, and high
speed logistics require that individual airports re-examine their business goals,
market priorities, physical capacity, and the compatibility of the three in meeting
the challenges of accelerating growth. Recent trends impacting the air cargo
industry are described below. All of these trends impact Georgia’s airports to
varying degrees. From an industry perspective, the three highest cargo airports
in the state are in Albany, Savannah, and Atlanta. Of these three, only Atlanta,
with 95% of Georgia’s total volume, has a significant international element and
strongest domestic activity base. Although some of the variables are not air
cargo specific, they reflect changes that affect air cargo volumes - particularly at
Atlanta and its long-term compatibility with industry needs.
Growth in Air Passenger Traffic: Global forecasts indicate that the world
passenger market could double over the next 20 years. All airports will be
challenged to provide the resources to achieve targeted levels of service for both
passenger and cargo growth. In instances where the capacity of an airport is
exhausted, there will be pressure to shift the most easily relocated business
segment – in most cases, cargo – to the nearest, most viable alternatives. Atlanta
is the busiest passenger airport in the world and as such faces greater challenges
than most airports in accommodating cargo growth, while addressing the critical
needs of 90 million passengers. In the event it is eventually necessary to shift
some cargo activity out of Atlanta, carriers would seek locations with low
operating costs, existing infrastructure and levels of activity that would facilitate
consolidations and transfer activity.
Key Shipping Windows: The general perception of the air cargo industry is that
air cargo aircraft operate around the clock or operate only at night; however this
is not the case. Integrators typically schedule departures on the west coast
between 8 and 10 pm to reach Midwestern sort facilities by midnight. For
Atlanta, this means substantial late-night operations to ensure timely departures
(fortunately this coincides with the time of the most minimal chance of conflicts
with passenger activity.) While not as time specific as the integrated carriers,
freight carriers must also operate out of shipping windows to allow for
GDOT Office of Planning 1-8Georgia Statewide Freight and Logistics Plan
Detailed Air Cargo Modal Profile
coordinated pickup and delivery at local and regional destinations, integration of
transshipments, and restrictive overseas airport and government controls. The
result is a clustering of operations and aircraft parking requirements. This causes
a peaking of demand for aircraft parking in Atlanta on a daily basis in the
morning and early evening.
Aircraft Parking: The increasing need for time-definite delivery and the growth
of the global air cargo market in general (the 2009 recession not withstanding)
continue to drive the market. In many instances, the cargo cannot be carried in
the belly of passenger aircraft (because of size or volume of the total shipment).
This has accelerated the utilization of freighter operations. While this trend
impacts airports differently, Hartsfield-Jackson is an attractive market for
international shippers, and based on long-term projections should see its
freighter operations recover from the recent reductions. Albany handles the
presence of UPS who have established a niche market served by air. Savannah
has an air cargo market that is almost exclusively based on FedEx activity and
should grow in line with the local demographics. The anticipated result at a
macro level will be increased demand for aircraft parking at airports that
typically handle in excess of 100,000 tons of air cargo annually, while smaller
niche airports could gain or lose freighter traffic based on truck substitution and
integrator strategies.
The Growth of Truck Substitution: One of the most difficult variables to
evaluate in air cargo is the truck substitution component. Many air cargo
facilities are operating to a great extent as truck terminals in which some
shipments into the terminals are being delivered to their final destination by
truck and others are being delivered through the use of air cargo. However, it is
difficult to measure the volume of truck-to-truck traffic because reporting is not
systematically done for truck traffic at airports. Airports cannot realistically
evaluate space demands, effectively plan for and phase new development, or
fully capture business opportunities without careful consideration of the truck
substitution component. Additionally, as truck substitution continues to play a
greater role because of cost and security constraints, airports must address the
fact that an air cargo facility is an inter-modal facility, and must be designed to
accommodate trucks as well as aircraft.
E-Commerce: Many of the shipments generated by home shopping networks,
catalogue shopping, and most recently, e-commerce, require specialized facilities
for efficient processing and expedited delivery. Accordingly, these shipments
have a greater tendency to move by air or expedited trucking. This has
accelerated demand for air cargo operations in general and freighter operations
in particular.
GDOT Office of Planning 1-9Georgia Statewide Freight and Logistics Plan
Detailed Air Cargo Modal Profile
Manufacturing Creep: Manufacturing facilities, particularly those focused on
time sensitive products, in response to demand for faster delivery are moving
and/or locating key warehouse facilities closer to airports, or on airport
property. This reduces inventory, trucking costs, and staffing requirements,
while increasing levels of customer service. The significant and growing amount
of state-of-the-art distribution center facilities in proximity to airports makes this
trend important to track.
High-speed Logistics: The changes in manufacturing and shipping are giving
rise to the design of new high-speed logistics facilities that can effectively
integrate a number of diverse industry segments. The facilities can handle
throughput and sortation, kitting (minor assembly), and returns, as well as
traditional operations. These value added distribution centers can be major job
generators, in some cases, approaching the employment levels of traditional
manufacturing operations. While the size of these buildings (often exceeding
500,000 ft2) makes them unlikely to occur on airports, they can be accommodated
in some of the newer industrial parks that have been developed throughout
Georgia such as the new parks in Braselton along I-85 or the Centerpoint
Intermodal Center in Savannah.
Building Technology: As a result of the escalating cost of storing goods, and the
shortage of on-airport property, modern cargo facilities are being designed to
emphasize speed of transition rather than warehousing. The result is taller
buildings to handle highly mechanized equipment with sufficient depth and
adequate airside and landside doors. It should be noted, however that not every
air cargo operation requires sophisticated equipment. The demand is a function
of the size of the operation, the nature of the cargo, the scheduling needs of the
shippers and forwarders, and budget. New security requirements may
eventually necessitate facility modifications that could reduce existing floor
capacity and require more internal storage.
Aircraft Technology: Modern freighters are more fuel-efficient, have greater
range, and carry larger payloads. This trend is most clearly illustrated by the
number of orders for the Boeing 777 and Boeing 747-800. The ability of new
aircraft to over-fly traditional points of entry, as well as the inability of many
airports to accommodate the new aircraft will affect the selection of origin and
destination airports. The Boeing 747 will carry 110-120 tons of cargo while a
Boeing 777 can carry approximately 90 tons of cargo. The belly component of the
new Airbus 380 passenger aircraft will deliver cargo volumes similar to what is
typically handled in today’s routine shipments on Boeing 747’s.
GDOT Office of Planning 1-10Georgia Statewide Freight and Logistics Plan
Detailed Air Cargo Modal Profile
2.0 Georgia Air Cargo
Infrastructure
This report’s air cargo assessment was approached from both a quantitative and
qualitative perspective. While historical data and trend lines are important
considerations in understanding present and future demand for air cargo, the
economic swings of the past decade create substantial issues with trend line
analysis. The air cargo industry changed significantly after September 2001.
Carriers reevaluated their business strategies to include routings, profit centers,
and fleet mix. The shift to regional jets as airlines “right-sized” their fleets
reduced belly capacity and continued to push domestic air cargo to trucks. After
a brief recovery period in the mid-2000s, Severe Acute Respiratory Syndrome
SARS, the fuel crunch, and the recession of 2009 have distorted trend lines
substantially.
Applying typical forecasting techniques to recent experience would indicate
negative growth. Therefore, while the statistical information is available, to
anticipate future growth FAA forecast information was utilized and
supplemented by a survey and interview process with the airports, key carriers,
and ancillary and supporting businesses. In addition, the consulting team drew
from information done recently in broad market analyses and reviews of
industry data to create a more comprehensive base for understanding the
regional air cargo demand dynamic.
The analysis incorporated two other elements – a review of the infrastructure
and facilities at Georgia’s primary air cargo airports and a comparative analysis
of activity at other airports to place Georgia air cargo in a more comprehensive
context.
2.1 AIR CARGO INFRASTRUCTURE AND OPERATIONS
The location and success of an air cargo operation is dependent on several key
factors that were discussed earlier in this report. In the state there are more than
100 public access airports, however not all could be considered ideal for
supporting air cargo operations. Exhibit 2-1 illustrates the Georgia airports
identified as theoretically most suitable for cargo activity.
GDOT Office of Planning 2-1Georgia Statewide Freight and Logistics Plan
Detailed Air Cargo Modal Profile
EXHIBIT 2-1
GEORGIA AIR CARGO FACILITY (EXISTING OR POTENTIAL)
BASED ON RUNWAY LENGTH
CODE FACILITY NAME
ATL HARTSFIELD–JACKSON ATLANTA INT’L.
AGS AUGUSTA REGIONAL AT BUSH FIELD
BQK BRUNSWICK GOLDEN ISLES
LSF LAWSON ARMY AIR FIELD (FORT BENNING)
MGE DOBBINS AIR RESERVE BASE
SVN HUNTER ARMY AIRFIELD
SAV SAVANNAH/HILTON HEAD INT’L.
VLD VALDOSTA REGIONAL
VAD MOODY AIR FORCE BASE
WRB ROBINS AIR FORCE BASE
Runway Length
To identify the airports with cargo activity and that are most relevant to this
analysis several criteria were applied. The primary criterion was the basic
requirement that virtually all commercial carriers have for cargo operations:
adequate runway length. An air cargo operation that includes commercial
aircraft typically requires a runway length of 8,000 feet for domestic operations
and 10,000 feet for international. (Although aircraft can operate from shorter
runways the determining factor is the weight of a fully loaded plane for takeoff).
Hartsfield-Jackson has a maximum runway length of 11,890 ft. Its other runways
are 10,000 ft. and three at 9,000 ft. which enables it to comfortably accommodate
the needs of international carriers that fly large wide body aircraft. SAV has a
runway length of 9,351 ft. -- longer than the 8,000 ft. minimum -- which enables it
to meet the needs of the domestic fleet they serve. ABY has a runway length of
6,601 ft.; normally this would not be acceptable for commercial service, but meets
the service needs of UPS which flies relatively smaller aircraft into the facility
and operates those aircraft for relatively short distances.
These ten airports were then qualitatively measured against the Air Cargo
Success Factors and the results were summarized in Table 1 on the next page.
The potential for each factor is indicated as green for “high”, yellow for
“medium”, and red for “low”. Designation as a military facility was not
considered other than from the perspective that if available, there would be
substantial physical capacity.
GDOT Office of Planning 2-2Georgia Statewide Freight and Logistics Plan
Detailed Air Cargo Modal Profile
As the graphic indicates, only Atlanta, and to a lesser extent Savannah meet most
of the criteria. This is because the growth of an airport as a cargo facility extends
well beyond its physical attributes.
TABLE 1
AIRPORT AIR CARGO COMPATIBILITY
Annual Tonnages
The consultant team also examined volumes at Georgia’s airports to identify
where air cargo is currently moving. As indicated in Table 2 on the next page,
the airports with measurable activity levels above 1,000 annual tons based on
cargo volumes for years 2008 and 2009 were:
1) Hartsfield-Jackson airport (ATL),
2) Southwest Georgia Regional Airport in Albany, and
3) Savannah International Airport.
The tonnage volumes at these three airports were: 663,724 tons; 26,076 tons; and
5,666 tons respectively. None of the other airports in the state moved more than
600 tons for the year of 2009. Therefore, developing an understanding of air
cargo at these three airports is the critical element to understanding air cargo for
the state.
GDOT Office of Planning 2-3Georgia Statewide Freight and Logistics Plan
Detailed Air Cargo Modal Profile
__________________________________________________________________
TABLE 2
GEORGIA ANNUAL AIR CARGO VOLUMES, 2008 & 2009
Source: US DOT Schedule T-100 data
2.2 APPROACH PROCEDURES
Also important for air cargo considerations were the airport’s navigational aids
that assist in landings. An aircraft preparing for a landing is considered to be
“on approach”. Modern commercial aircraft rely on technology and equipment
to help guide the plane to a successful landing. A precision approach is both
sophisticated and expensive. The price is a critical factor in determining the cost-
benefit of its installation. It includes an Instrument Landing System (ILS), and
specific lighting requirements and runway markings. There are three levels of
refinement for an instrument landing system - CAT I, II and III. Each brings the
aircraft in with a more precise degree of guidance from the least to the greatest.
GDOT Office of Planning 2-4Georgia Statewide Freight and Logistics Plan
Detailed Air Cargo Modal Profile
As the plane is flying in, electronics of the ILS are linked to the precision
markings on the runway to aid pilots. Commercial cargo aircraft typically will
not utilize an airport that does not have an ILS.
Runway lengths & approach procedures for 15 major U.S. airports are in Table 3.
TABLE 3
COMPARATIVE CARGO AIRPORT INFRASTRUCTURE
RUNWAY LENGTH AND APPROACH SYSTEM
All 15 airports in the table have at least one 10,000+ ft. runway and have
precision approach procedures which are detailed in the next section of this
report.
The last broad screening criterion to consider for cargo-ready airports is available
capacity. In Georgia, state air cargo volumes during the recent economic
downturn decreased by nearly 25% since 2006. A review of the available
capacity at Georgia airports indicates sufficient room for expansion to
accommodate growth for the next twenty years.
GDOT Office of Planning 2-5Georgia Statewide Freight and Logistics Plan
Detailed Air Cargo Modal Profile
3.0 Georgia Air Cargo Volumes
3.1 HISTORICAL AND EXISTING CARGO VOLUMES
As an introductory step in the analysis, the consultant team looked at the historic
cargo volume data at the three Georgia target airports. That review, which
focused most closely on statistics that were available at the time for the years
2006 to 2009, showed cargo volumes declining as the national economic
slowdown occurred.
As indicated in Table 4, the tonnage decline in 2007 was relatively small at
Atlanta compared to 2006, while the other two Georgia airports studied showed
modest increases. The decline for all three facilities started in 2008; in 2009 the
drop was in double-digit percentages. This pattern was largely driven by the
following industry trends;
• Reduced domestic air cargo capacity based on greater use of regional jets
• Depletion of existing inventory levels for economic reasons
• Increased use of trucks to substitute for shorter-haul cargo trips
TABLE 4
GEORGIA TOP THREE CARGO AIRPORT STATISTICS:
REPORTED CARGO VOLUMES DURING 2006-2009 (METRIC TONS)
Source: ATL and SAV source is ACI-NA; ABY source is the L&B T-100 Database
NOTE: Rounded to the nearest whole number
For the years that data was available, declining cargo numbers in Georgia were
in line with the national market trends. In fact, 15 major U.S. airports in the
eastern U.S. saw cargo tonnage down across the board with the exception of two
markets: Cincinnati / Northern Kentucky International Airport (CVG) and Saint
Louis-Lambert International Airport (STL). CVG saw an increase due to DHL’s
relocation of international operations back to CVG after shutting down their
operation at Wilmington, Ohio. STL’s data was due to a series of Asian test
GDOT Office of Planning 3-1Georgia Statewide Freight and Logistics Plan
Detailed Air Cargo Modal Profile
flights which contributed to a temporary spike in volumes -- not a sustained
increase. Table 5 tracks cargo activity for all 15 major U.S. airports between 2006
and 2009.
TABLE 5
COMPARATIVE AIRPORT CARGO STATISTICS
CARGO VOLUME COMPARISON 2006-2009 (METRIC TONS)
Source: ATL and SAV data came from ACI-NA Statistics
Table 6 reflects a 35 year history for cargo data at Hartsfield-Jackson. At the time
of this writing, it is anticipated that volumes will recover to a certain extent in
2010. However, it will be necessary to look at a three year trend to get a more
accurate determination on the extent to which the Atlanta market has recovered
and stabilized.
It is worth noting that in 2010, Hartsfield-Jackson broke into the top 10 air cargo
airports in North America. That year it clinched the #10 spot which it has held to
through the year 2013 (Source: ACI-NA).
GDOT Office of Planning 3-2Georgia Statewide Freight and Logistics Plan
Detailed Air Cargo Modal Profile
Table 7 reflects the market reversal that the industry has experienced in the first
six months of 2010, compared to the levels of activity in the years 2008 and 2009.
The data are for six large airports and include Hartsfield-Jackson. All of the
airports experienced declines for the first six months of the preceding years and
show positive growth for the corresponding period in 2010.
TABLE 6
HARTSFIELD-JACKSON AIR CARGO TONNAGE
ATL Air Cargo Tonnage
900000
800000
700000
600000
500000
400000
300000
200000
100000
0
1975 1977 1979 1981 1983 1985 1987 1989 1991 1993 1995 1997 1999 2001 2003 2005 2007 2009
Source: Airports Council International Traffic Report
As Table 7 indicates, while the industry was recovering, at the time of this
report’s original release the rebound had not yet brought the primary cargo
airports that compete with Atlanta back to 2008 levels.
TABLE 7
JANUARY – JUNE CARGO VOLUMES, 2008-2010 (METRIC TONS)
COMPETITIVE AIRPORTS - FIRST 6 MONTHS OF YEAR COMPARISON
%
YTD 2010 YTD 2009 % Change 2008
Change
ATL 312,121 20 260,081 -24 344,109
DFW 310,498 19 259,347 -22 334,888
EWR 366,692 14 320,154 -20 400,679
JFK 631,727 25 502,503 -24 669,577
MIA 896,263 10 814,002 -12.7 933,488
ORD 609,501 11 547,590 -27 758,395
GDOT Office of Planning 3-3Georgia Statewide Freight and Logistics Plan
Detailed Air Cargo Modal Profile
Based on the 2007 Global Insight Transearch freight flow database, the origins
and destinations for Georgia’s domestic air cargo were fairly dispersed
throughout the U.S. As shown in Tables 8 and 9, California was the highest
origin state comprising 13 percent of the originating air cargo traffic and
Tennessee was the largest destination of domestic air cargo with 18 percent of the
flows.
Transearch data also provided estimates of the commodity distribution for air
cargo. Table 10 shows that roughly one-third of all of Georgia air cargo can be
categorized as “miscellaneous mixed shipments”. “Mail and contract traffic”
represents another 21 percent of total volume. Over half of the air cargo in
Georgia is from one of these two commodities; the other 18 commodities
represent the remaining portion of the air cargo for Georgia.
TABLE 8
TOP ORIGIN STATES FOR GEORGIA’S DOMESTIC AIR CARGO, 2007
Domestic Origins of Air Cargo
Traffic Percent of Total Tons
California 13%
Texas 7%
Indiana 7%
New York 7%
Tennessee 6%
Other States 58%
Total 100%
TABLE 9
TOP DESTINATION STATES FOR GEORGIA’S DOMESTIC AIR CARGO, 2007
Domestic Destinations of Air Percent of Total
Cargo Traffic Tons
Tennessee 18%
Texas 16%
Florida 14%
California 6%
Ohio 5%
Other States 42%
Total 100%
GDOT Office of Planning 3-4Georgia Statewide Freight and Logistics Plan
Detailed Air Cargo Modal Profile
TABLE 10
COMMODITY DISTRIBUTION FOR GEORGIA AIR CARGO, 2007
Commodity Percent of Total Tons
Misc. Mixed Shipments 33%
Mail Or Contract Traffic 21%
Machinery 9%
Chemicals Or Allied Products 9%
Transportation Equipment 8%
Electrical Equipment 5%
Printed Matter 3%
Precision Instruments, Photo Equipment, Optical Equipment 2%
Apparel Or Related Products 2%
Fabricated Metal Products 2%
Pulp, Paper Or Allied Products 1%
Rubber Or Misc. Plastics 1%
Food Or Kindred Products 1%
Fresh Fish Or Marine Products 1%
Misc. Manufacturing Products 1%
Farm Products 1%
Textile Mill Products < 1%
Clay, Concrete, Glass Or Stone < 1%
Leather Or Leather Products < 1%
Primary Metal Products < 1%
Total 100%
3.2 Cargo Volume Forecast
Globally, forecasts of air cargo volumes over the next 25 years predict a tripling
over current volumes. Within the U.S., data supplied by the Federal Aviation
Administration (FAA) data in Table 11 depicts historical and forecast cargo. For
the U.S., the historical aggregate growth rate (AGR) from 1995-2009 was 1.9
percent (note: this historical growth was tempered by the 9/11 incidents and the
recent economic downturn). The FAA Forecast AGR for the years 2010 to 2030
predicts 5.0 percent nationwide; locally, this growth could be slightly greater or
less for Atlanta, but it is a reasonable planning guide. The long-term FAA
growth forecast is consistent with predictions from the International Air
Transport Association and Boeing which forecast growth from 4 to 6 percent.
In conjunction with this long-term air cargo growth, additional on-airport
roadway access and truck parking will be needed in the long run to prevent
GDOT Office of Planning 3-5Georgia Statewide Freight and Logistics Plan
Detailed Air Cargo Modal Profile
queuing, maneuvering, and loading problems. When combined with passenger
growth, particularly at Hartsfield-Jackson, the constraints of the land envelope
warrant business strategies, lease management practices, and physical planning
that will optimize airport property and its ability to serve customers.
TABLE 11
FAA FORECAST CARGO GROWTH: REVENUE TON MILES
US Carriers - Total Air Cargo Tonnage
measured by Revenue Ton Miles
100,000
15 year historical growth = 1.9% AGR FAA long term projection = 5.0% AGR
Revenue Ton Miles (in millions)
90,000
80,000
70,000
60,000
50,000
40,000
30,000
20,000
10,000
-
1995
1996
1997
1998
1999
2000
2001
2002
2003
2004
2005
2006
2007
2008
2010
2011
2012
2013
2014
2015
2016
2017
2018
2019
2020
2021
2022
2023
2024
2025
2026
2027
2028
2029
2030
2009E
Historical Forecast
Source: FAA Aerospace Forecasts
GDOT Office of Planning 3-6Georgia Statewide Freight and Logistics Plan
Detailed Air Cargo Modal Profile
4.0 Survey of Air Cargo
Stakeholders
As part of this report, discussions were held with major air cargo stakeholders in
Georgia to collect information and learn industry perspectives. The focus of
these discussions centered on Georgia’s three prime air cargo airports:
Hartsfield-Jackson Atlanta, Albany, and Savannah. Key businesses at each were
identified and an informal questionnaire was sent with a telephone follow-up.
The targeted organizations included the airport administration; carriers; freight
forwarders; trucking companies who move freight; and Federal agencies such as
Customs and Border Protection (CBP) and the Transportation Security
Administration (TSA). In addition, economic development agencies and other
companies that promote, monitor, and/or provide safeguards for air cargo
activity were contacted. Each airport has unique characteristics and these
aspects helped inform the identification of participants in the process.
Hartsfield–Jackson Atlanta International Airport (HJAIA)
This airport is considered one of the larger cargo gateways in North America,
even though cargo volumes have decreased over the past decade. As of the time
this report was produced -- prior to the growing presence of Southwest Airlines -
Delta airlines was a focus as most of the airport’s cargo tonnage is carried in the
bellies of its passenger fleet. Not surprisingly, the air cargo community located
in the Atlanta area is the largest of the three airports. Because of the presence of
the Port of Savannah, there are a large number of freight forwarders in the State
that focus on ocean-borne cargo and also utilize air cargo services.
The main cargo carriers (by volume) were provided by the airport. These
carriers were contacted to provide input on their air cargo activities. They
helped identify the top twenty regional freight forwarders.
Southwest Georgia Regional Airport (ABY)
UPS is the dominant air cargo carrier at the Albany Airport. There is also a small
aircraft cargo operator and a small charter flight operation at this airport. Airport
staff was the main source of information on air cargo activity at that airport.
Savannah International Airport (SAV)
Air cargo activity at Savannah is limited to regional jets or smaller aircraft with
constrained belly cargo capacity. The annual air cargo tonnage was less than
7,000 tons – approximately one percent of the air cargo through the Atlanta
GDOT Office of Planning 4-1Georgia Statewide Freight and Logistics Plan
Detailed Air Cargo Modal Profile
airport. The Savannah Airport staff provided most of the data which was
supplemented by input from one main carrier. They reported a large freight
forwarder ‘community’ in Savannah; however, their business is largely focused
on ocean shipments and not air cargo.
4.1 REGULATORY AGENCIES
Airport stakeholders were asked about agencies, policies and regulations that
impact their business. This produced a list of the most involved Federal agencies
and their relevant guidelines. Since 9/11 the operations of the air cargo
community have become increasingly influenced by the governmental entities
that, in part, oversee shipments. These agencies collectively have two functions:
interdiction and facilitation. Interdiction includes the monitoring and control of
regulated goods and the enforcement of rules and regulations regarding safety
and security. Facilitation is the responsibility of ensuring that the flow of goods
into the U.S. is maintained without adverse impact on the business community.
The focus of this discussion is on the supervision of goods movement by the
following organizations:
• Transportation Security Administration (TSA);
• Customs and Border Protection (CBP);
• Food and Drug Administration (FDA);
• Department of Agriculture (DOA); and
• U.S. Fish and Wildlife (FWS)
The TSA, CBP and DOA are part of the Department of Homeland Security (DHS)
and have the most interaction with the air cargo industry of all Federal agencies.
TSA is charged with nationwide implementation of security measures for
screening and inspecting all cargo. The organization was formed as a result of
the events of the 9/11 attacks on the U.S. In August 2010, TSA achieved one of
its mandated milestones - 100% screening of cargo loaded into the belly of
passenger planes.
In general, air cargo industry participants proceed under the assumptions that:
• Screening and inspection processes will eventually be extended to non-
passenger cargo aircraft, which will include the fleets of freighter
operators and possibly integrators;
• There will be a continuing effort to push screening to the initial points of
origin (the shippers); and
• Tracking of manufacturers that ship freight will continue.
On the facilitation side, CBP is primarily in charge of collecting duties from
international cargo coming into the U.S. and reviewing the accuracy of the data
on the paperwork that accompanies international shipments. Historically, CBP
has been focused on safety and security - ensuring that imported cargoes were
GDOT Office of Planning 4-2Georgia Statewide Freight and Logistics Plan
Detailed Air Cargo Modal Profile
inspected and cleared and outbound cargo is screened according to the latest
guidelines. As part of DHS, new cross training strategies are being developed to
utilize CBP to their full staffing potential and capitalize on and enhance their
industry knowledge base. This means that staff will now be able to shift between
the passenger and cargo sides of the business, as well as assume some duties
formally reserved for the Department of Agriculture. The CBP considers its
challenge to identify and adapt the latest technology or combination of
technologies that will address the security mandates while still enabling the
smooth entry and flow of air cargo in the system. This pertains to their primary
elements focused on air cargo – Customs, Agriculture, and Fish and Wildlife.
Air Cargo Community - Agency Issues
Interviews with the air cargo community identified several concerns which could
impact future shipping patterns.
• Despite the efforts of the TSA to cross-train staff and increase their
flexibility, they thought the overall availability of staff with adequate
industry knowledge to perform the necessary tasks to ensure the smooth
flow of goods varies from airport to airport. No issues were brought up
for Hartsfield-Jackson or the other two Georgia airports.
• They thought increasing industry costs could partly be attributed to the
increased screening and inspection of air cargo. It was unclear, in their
opinion, whether the industry could sustain these costs over the long-
term and what the overall impact could be on air cargo volumes. (Costs
are completely borne by the private sector air cargo community and not
subsidized by the federal government. Some thought these additional
costs may possibly contribute to a shift of domestic belly air cargo to the
trucking mode.)
• There was a thought that new security costs could deter demand for
smaller-to-mid-size airports resulting in a loss of revenue and Federal
funding, and potentially shifting domestic air cargo onto trucks.
4.2 CARGO FACILITY AND INFRASTRUCTURE PROFILE
The following section of the report describes the capacity of cargo facilities and
aeronautical infrastructure at the Atlanta, Albany and Savannah airports using
their data and inventory of available facilities and infrastructure along with
details on their specifications, condition and occupancy. Tenants provided
insights into building, ramp, roadway utilization, and the ability to
accommodate operational processes.
GDOT Office of Planning 4-3Georgia Statewide Freight and Logistics Plan
Detailed Air Cargo Modal Profile
Hartsfield-Jackson Atlanta International Airport (ATL)
The Atlanta airport has vibrant air cargo activity, with 13 air cargo carriers with
regular operations at the airport and five charter air cargo airlines at the time of
this report’s completion. Being within a two-hour flight or one day of transport
by truck to over 200 million people, it can reach 80 percent of American
consumers.
Located eight miles south of downtown Atlanta and with ready access to four
interstates (I-75, I-85, I-285, and I-20), the airport is also located within a 250-acre
Georgia Free Trade Zone, FTZ #26. This facilitates trade and increases efficiency
of companies doing business in the state by reducing operating costs and fees
associated with international trade. More than 100 motor carriers provide
expedited ground transportation for air cargo shipments to the Atlanta airport.
The cargo services feature operations by more than 100 licensed customs brokers
and 200 domestic and international freight forwarders.
Based on the cargo volumes and the logistics practices of the air cargo business
community, Hartsfield-Jackson is positioned as a main consolidation point in the
southeastern U.S. It has 11 buildings used for air cargo totaling approximately
1.55 million ft2 and with relatively young building ages ranging from 10 to 35+
years. As of the date of this report, one older facility is being removed and a
replacement facility is planned in its place.
As the air cargo industry continues to evolve, the general design and
configuration of cargo facilities world-wide have been modified to accommodate
faster ‘throughput’ to minimize ‘dwell time’ at the airport. This includes
changing building depths to accommodate the needs of specific tenants or cargo
operations and adding areas for specialized cargo such as perishables, high value
goods, and live animals. Changes are occurring on the ‘landside’ to improve
access for trucking and automobile needs: wider truck courts to handle larger
trucks and relocating auto parking away from the areas in which the trucks
typically operate.
To compile this report, available specifications and data on existing facilities
were examined, and information from previous site visits to all cargo buildings
was utilized to assess operating conditions and the compatibility of the buildings
with demand. Hartsfield-Jackson is developing Building C in the South Cargo
Complex subject to industry demand. Scheduled for completion in November
2015, the new Cargo C building will complete the South Cargo Facility complex
on South Loop Road. It will be the same size, appearance and function as the
three existing facilities and is developed with the intent to accommodate
multiple tenant operations. The facility will have high bay central cargo
operations with supporting facilities on a partial second floor. There will be a
total of 128,566 gross square feet consisting of 104,538 square feet on the first
GDOT Office of Planning 4-4You can also read